1. Introduction
The magnetic compound Sm2Fe17N3 exhibits a high saturation magnetic polarization (Js), a large anisotropy field, and a high Curie temperature,1,2) indicating promising applications in high-performance magnets. In a typical procedure, Sm2Fe17N3 alloy powder prepared by the reduction–diffusion process3–7) is mixed with epoxy resin to obtain resin-bonded magnets. The reduction–diffusion process for preparing Sm2Fe17N3 powder has been extensively studied in an effort to improve the resulting magnetic properties.8–13) An alternative approach for manufacturing Sm2Fe17N3-based bulk magnets involves mixing with a low-melting-point metal to obtain metal-bonded Sm–Fe–N magnets. For example, this strategy was adopted by Otani et al.,14) who reported that the use of Zn as the binder improved the coercivity of the meta-bonded Sm–Fe–N magnets compared with other metals (e.g., Al, Sn). Since this report, numerous researchers have attempted to improve the magnetic properties of Zn-bonded Sm–Fe–N magnets.15–28) This has enabled the identification of several key principles for enhancing the maximum energy products ((BH)max) of Zn-bonded Sm–Fe–N magnets, including minimizing the O content of the powder to suppress the decrease in coercivity, reducing the powder size to improve the dispersibility of Zn, and increasing the relative density to optimize the magnetization.28) Recently, our group developed Zn-bonded Sm–Fe–N magnets displaying high (BH)max of 200 kJm−3 27) or high coercivity (HcJ) of 2.4 MAm−1.24)
The increased coercivity of Zn-bonded Sm–Fe–N magnets can be explained as follows. Sm–Fe–N powder is easily oxidized and develops an oxidation layer on the particle surface.24,25,29,30) During annealing, the surface O atoms diffuse into the Sm2Fe17N3 phase, which decomposes to generate the α-Fe phase. Because the α-Fe phase is soft magnetic, it is thought that this phase on the powder surface provides nucleation sites for reversed magnetic domains, thus decreasing the coercivity of the Sm2Fe17N3 powder. In contrast, in Zn-bonded Sm–Fe–N magnets, the Zn melts and reacts with the α-Fe phase during annealing to form the non-magnetic Γ-FeZn phase,14,16,22–25,31–33) thus eliminating the soft magnetic phase. Recently, we investigated the detailed microstructural changes in high-coercivity Zn-bonded Sm–Fe–N magnets.25) The results indicated that Zn diffused into the Sm2Fe17N3 powder to a depth of several tens nanometers to generate a Zn-diffused region composed of polycrystalline nanosized grains of α-Fe, Γ-FeZn, and Sm–O. In addition, the Zn-diffused region isolated the soft-magnetic α-Fe phase from the Sm2Fe17N3 phase to afford high coercivity. Although Zn diffusion can enhance the coercivity of Zn-bonded Sm–Fe–N magnets, excess Zn diffusion was also found to reduce the saturation magnetization and (BH)max.25)
To further increase the (BH)max of Zn-bonded Sm–Fe–N magnets, it is necessary to control the diffusion and reaction of Zn in Sm2Fe17N3 powder to improve the coercivity. However, to the best of our knowledge, there has been no report concerning the diffusion behavior of the Zn and Sm2Fe17N3 phases, such as the phase changes and diffusion coefficients. Furthermore, besides the Sm2Fe17–Zn interface, there has been no report of these properties for other RE2Fe17–Zn systems (RE: rare-earth element). Therefore, it is necessary to clarify the diffusion behavior at the Sm2Fe17–Zn interface. In this regard, the diffusion couple technique is a useful method for investigating the diffusion behavior between two metals and/or alloys.
In this study, we prepared Sm2Fe17–Zn diffusion couples and examined their diffusion behavior, detailed microstructural and phase changes, and diffusion coefficients. To the best of our knowledge, this is the first paper elucidating the diffusion behavior at RE2Fe17–Zn interfaces.
3. Results and Discussion
3.1 Morphological changes and evaluation of diffusion coefficient
The Sm2Fe17–Zn diffusion couple was annealed at 400°C for various times ranging from 10 to 120 min. Figure 1 presents cross sectional SEM backscattered electron (SEM-BSE) images of samples annealed at 400°C for 10, 30, 60, and 120 min. In Fig. 1(a), the EDX line profile along the white dashed line is also shown as an overlay. Examination of the SEM-BSE images and EDX profiles revealed three clear diffusion regions exhibiting different contrasts between the Sm2Fe17 and Zn phases, which are labeled (A), (B) and (C) in the figures. EDX analysis indicated that regions (A), (B) and (C) had compositions of Fe7.5–Zn91.7–Sm0.8, Fe9.5–Zn85.8–Sm4.7, and Fe51.0–Zn41.4–Sm7.6 (at%), respectively. Region (A) accounted for the majority of the entire diffusion region and was composed two phases with gray and white contrasts. Region (B) with white contrast possessed a layer-like morphology and occurred between regions (A) and (C). Region (C) had bright gray contrast and was observed at the surface of the Sm2Fe17 phase. According to the SEM-BSE images, the thickness of region (A) increased drastically with increasing annealing time, whereas the thickness of regions (B) and (C) remained similar.

For evaluating the thicknesses of the diffusion regions, it was important to identify the initial interface between Sm2Fe17 and Zn. Thus, Ta foil and W powder were applied as markers to distinguish the initial interface. Figure 2 shows SEM-BSE and EDX mapping images of specimens containing the markers after annealing at 400°C for 10 min. First, pieces of Ta foil were sandwiched at the interface between Sm2Fe17 and Zn prior to clamping and annealing. A cross-sectional SEM-BSE image near the front of the Ta foil is presented in Fig. 2(a), and it can be seen that the Ta foil suppressed the interfacial diffusion of Zn, Fe, and Sm during annealing. A diffusion region was also observed at the part of the interface between Sm2Fe17 and Zn lacking Ta foil. Figure 2(b) shows a magnified SEM-BSE image of the area enclosed by the white rectangle in Fig. 2(a). The dashed line extrapolated from the Ta foil indicates the position of the initial Sm2Fe17–Zn interface, which was situated between regions (A) and (B). To clarify the difference in the interdiffusion rates of the elements, we also applied W powder as an additional marker as depicted schematically in Fig. 2. Figures 2(c) and (d) show SEM-BSE and EDX mapping images, respectively, of the interface between Zn and diffusion region (A) after annealing at 400°C for 10 min. In the SEM-BSE image, some particles with white contrast were observed at the interface between Zn and region (A). The EDX mapping image revealed that these particles were composed of W. Thus, the W powder moved from the initial interface between Sm2Fe17 and Zn to the interface between Zn and region (A) during annealing. This result indicates that the diffusion rate of Zn was faster than those of Fe and Sm, a well-known phenomenon referred to as the Kirkendall effect.

The thickness of diffusion region (A) was next evaluated by SEM-EDX line analysis. Figure 3 shows the relationship between the thickness (x) of region (A) and the square root of the diffusion time (t1/2). It is clear from this plot that x increased linearly with increasing t1/2. The slope of the line in Fig. 3 corresponds to the diffusion coefficient (D), which can be evaluated using the Einstein–Smoluchowski equation as expressed in eq. (1):
| \begin{equation}
x = (2Dt)^{1/2}.
\end{equation}
| (1) |
From
Fig. 3 and
eq. (1), the value of
D for region (A) was estimated to be 7.3 × 10
−13 m
2s
−1.
For the Fe–Zn diffusion couple, the diffusion coefficients of the ζ-Fe–Zn and δp-Fe–Zn phases at 400°C were reported to be 2.6–14.9 × 10⁻¹³ and 5.2 × 10⁻¹³ m2s−1,34–36) respectively. In this study, region (A) possessed the Zn-rich composition of Fe7.5–Zn91.7–Sm0.8 (at%); therefore, it is considered that the interdiffusion coefficients of Zn, Fe, and Sm in this region (A) may be of the same order as in the Fe–Zn binary system.
3.2 Phase and microstructural changes
In Section 3.1, three diffusion regions denoted (A), (B) and (C) were identified in the Sm2Fe17–Zn diffusion couples annealed at 400°C for 10–120 min. In this section, the detailed microstructure and temperature dependence of the morphological changes are investigated.
Figure 4 presents SEM-BSE images showing the interfacial microstructural changes of Sm2Fe17–Zn diffusion couples after annealing at 320, 350, or 400°C for 10 min. Although these annealing temperatures are below the melting temperatures of Zn (419°C), the Sm2Fe17 and Zn interfaces were connected after annealing, demonstrating that diffusion of the elements had occurred.

Figure 4(a) shows the interfacial microstructure of the sample annealed at 320°C. A region with gray contrast can be observed between the Sm2Fe17 and Zn phases. SEM-EDX analysis revealed that the composition of this region was Fe10.4–Zn88.7–Sm0.9 (at%). This result indicates that the interdiffusion of Zn, Fe, and Sm occurred during annealing at 320°C, which is approximately 100°C lower than the melting temperature of Zn. This phase had a Zn-rich and Sm-poor composition with approximately 90 at% of Zn and almost 0 at% of Sm. Diffusion regions (A), (B), and (C) identified in Fig. 1 and Section 3.1 after annealing at 400°C had compositions of Fe7.5–Zn91.7–Sm0.8, Fe9.5–Zn85.8–Sm4.7, and Fe51.0–Zn41.4–Sm7.6 (at%), respectively. Thus, the composition of the Zn-rich diffusion region observed in Fig. 4(a) most closely corresponded to that of region (A).
Figure 4(b) presents an SEM-BSE image of the sample annealed at 350°C for 10 min. This sample contained a thick diffusion region between the Sm2Fe17 and Zn phases composed of two phases with gray and white contrasts. SEM-EDX analysis revealed that the gray and white phases had compositions of Fe9.3–Zn90.1–Sm0.6 and Fe8.6–Zn89.6–Sm1.8 (at%), respectively. The composition and morphology of the gray phase were similar to those of region (A) observed in Figs. 1(a) and 4(a). Therefore, it is considered that annealing at 350°C for 10 min caused the Zn-rich region (A) to become thick and promoted the development of the white phase in this region. The white phase displayed an interesting ripple-like morphology in the vicinity of the Sm2Fe17 interface and existed as isolated patches near the Zn interface. Here, we should note that the phase with white contrast was submicrometer in size; therefore, the accuracy of the composition analysis of this phase was low owing to the limitation of the SEM beam spot size.
In Fig. 4(b), another region with a wedge shape and bright gray contrast was also observed, for which SEM-EDX analysis revealed a composition of Fe40.5–Zn54.4–Sm5.1 (at%). This wedge-shaped region appeared at the surface of the Sm2Fe17 phase, and its composition was close to that of the region (C) observed in Fig. 1(a). Therefore, this wedge-shaped region was identified as region (C).
Figure 4(c) shows an SEM-BSE image of the sample annealed at 400°C for 10 min. The composition of the diffusion regions between the Sm2Fe17 and Zn phases are listed underneath the image. The major component, region (A), consisting of the aforementioned gray and white phases with compositions of Fe11.0–Zn88.6–Sm0.4 and Fe8.6–Zn87.1–Sm4.3 (at%), respectively, displayed a thickness of approximately 32 µm. Here, we should note again that the submicrometer size of the white phase limited the accuracy of the composition analysis of this phase by SEM-EDX. Furthermore, phase (C) with bright gray contrast and a composition of Fe51.0–Zn41.4–Sm7.6 (at%) was observed at the surface of the Sm2Fe17 phase. Finally, phase (B) with white contrast and a composition of Fe9.5–Zn85.8–Sm4.7 (at%) was identified between regions (A) and (C).
The diffusion regions observed in the samples annealed at 320, 350, and 400°C are summarized in Table 1. In the diffusion couple annealed at 320°C, only region (A) with gray contrast was observed between the Sm2Fe17 and Zn phases. After annealing at 350°C, region (A) containing two phases with gray and white contrasts was observed, in addition to the wedge-shaped region (C) at the surface of the Sm2Fe17 phase. Finally, annealing at 400°C caused region (C) to transform from a wedge shape to a layer-like morphology and region (B) to appear between regions (A) and (C).

Table 1 Relationship between annealing temperature and observed diffusion regions.
To identify the phases and detailed microstructures of diffusion regions (A), (B), and (C), the sample annealed at 400°C for 10 min was subjected to TEM analysis. Figure 5 presents TEM images of the Zn-rich region (A) shown in Fig. 4(c). The selected-area diffraction (SAD) patterns in Fig. 5 were obtained from the grains indicated by the white arrows, and the corresponding compositions measured by TEM-EDX analysis are also shown. The bright-field TEM images in Fig. 5 revealed that region (A) was composed of polycrystalline grains with sizes ranging from several tens to hundreds of nanometers. The grains shown in Fig. 5(a) possessed a Sm content of only 0.2 at% and was thus ascribed to a Zn-rich Fe–Zn binary alloy phase. The SAD pattern corresponded to the ζ-FeZn13 phase with a monoclinic structure (a = 1.0878, b = 0.7607, c = 0.5074 nm) and a zone axis of [011]. The grains shown in Fig. 5(b) also had a Zn-rich composition with only 0.4 at% of Sm and thus was similarly assigned as a Zn-rich Fe–Zn binary alloy phase. The SAD pattern of this grain corresponded to the δ1p-FeZn10 phase, which has a hexagonal structure (a = 1.2787, c = 5.7222 nm) and a zone axis of [010]. Thus, the grains indicated in Figs. 5(a) and (b) were identified as Fe–Zn binary alloys with different crystal structure and similar Sm composition close to zero. The combined SEM-EDX and TEM-EDX results indicate that the matrix phase of region (A) with gray contrast and a low Sm composition consisted of the ζ- and δ1p-Fe–Zn binary alloy phases. The grain shown in Fig. 5(c) also had a Zn-rich composition, although it contained 14.1 at% of Sm. This finding indicates that there also existed some grains composed of Sm–Fe–Zn ternary alloy. As shown in Fig. 4(c), region (A) included a phase with white contrast that contained some amount of Sm, which was considered to correspond to the grain indicated in Fig. 5(c). The SAD pattern of this grain corresponded to the ThMn12-type SmZn12 or SmFe12 phase. Considering the composition analysis results, it is thought that some amount of Fe replaced the Zn to afford a ThMn12-type Sm(Zn,Fe)12 phase.

Therefore, the results indicate that the Zn-rich diffusion region (A) was composed of a mixture of the Fe–Zn binary alloy phases of ζ-FeZn13 and δ1p-FeZn10 and the ternary alloy phase of ThMn12-type Sm(Zn,Fe)12. In Section 3.1, the diffusion coefficient (D) of region (A) was evaluated as 7.3 × 10⁻¹³ m2s−1. The microstructural analysis in this section indicates that region (A) consisted of the ζ- and δ1p-Fe–Zn phases incorporating the Sm(Zn,Fe)12 phase. Considering that the matrix of region (A) was composed of the ζ- and δ1p-Fe–Zn phases, the calculated value of D is thought to correspond to the interdiffusion coefficient of Zn, Fe, and Sm in the ζ- and δ1p-Fe–Zn phases.
The microstructure of region (C) in Fig. 4(c) was next investigated by TEM. Figure 6(a) presents a low-magnification TEM image, which indicates that the diffusion region was polycrystalline. Figure 6(b) shows a higher-magnification TEM image of region (C) at the surface of Sm2Fe17 phase, revealing a fiber-like microstructure in which the fibers were oriented perpendicular to the Sm2Fe17 interface. Thus, to investigate the detailed microstructure of this region, TEM analysis was conducted in the direction perpendicular to the fiber direction after cutting the specimen by focused ion beam (FIB) milling.

Figure 7(a) presents a bright-field cross-sectional TEM image of the sample, revealing the presence of the fibers and the grain size of several tens nanometers. Figure 7(b) shows the SAD pattern recorded for the region with dark contrast in Fig. 7(a), indicating the existence of two phases corresponding to α-Fe or α-FeZn with a zone axis of [111] and ThMn12-type SmFe12 or SmZn12 with a zone axis of [011]. In addition, the SAD pattern revealed that these two phases possessed an in-plane orientational relationship that was considered to correspond to α-Fe or α-FeZn(10-1)[111]//ThMn12-type(01-1)[011]. Figure 8(a) shows a high-angle annular dark-filed (HAADF) image of this sample, and Figs. 8(b), (c), and (d) present the corresponding elemental mapping images for Zn, Fe, and Sm, respectively. The HAADF image indicated the presence of two phases, namely, a Fe-rich phase and a Zn- and Sm-rich phase, as shown by the EDX analysis. Although accurate composition analysis was not possible owing to the nanoscale grains, the compositions of the Fe-rich phase and Zn- and Sm-rich phase were approximately evaluated as Fe86–97–Zn0–11–Sm0.9–2.6 and Fe11–32–Zn54–83–Sm6–22 (at%), respectively, by TEM-EDX. Thus, the Fe-rich phase appeared to contain small amounts of Sm and Zn, while the Zn- and Sm-rich phase contained a moderate amount of Fe in addition to relatively large amount of Zn and Sm. As described above, the SAD analysis indicated that the Fe-rich phase and Zn- and Sm-rich phase were composed of α-Fe or α-FeZn and ThMn12-type SmZn12 or SmFe12, respectively. Considering the results of the SAD and EDX analyses, these two phases were identified as α-FeZn and Sm(Zn,Fe)12, respectively. Figure 9 presents a high-magnification HAADF image and the corresponding fast Fourier transform (FFT) patterns of the two phases. Fine grains of the α-FeZn and Sm(Zn,Fe)12 phases were observed in the HAADF image, and the FFT patterns indicated the specific orientational relationship identified in the SAD pattern shown in Fig. 7(b).


The TEM observations indicated that the diffusion of Zn into the Sm2Fe17 phase resulted in the decomposition of the Sm2Fe17 phase into α-FeZn and Sm(Zn,Fe)12 phases with a specific orientational relationship, and this suggests that the Sm(Zn,Fe)12 phase could be more stable than the Sm2Fe17 phase. The formation enthalpy is one indicator for evaluating the phase stability of compounds. The formation enthalpies $\Delta H_{298}^{0}$ of Th2Zn17-type Sm2Fe17 compound have been reported by several researchers with values of −3.1 ± 3.2 kJ mol−1,37) −3.28 kJ mol−1,38) and 1.578 kJ mol−1,39) while the formation enthalpy of ThMn12–SmZn11–12 was reported as −25 kJ mol−1.40–42) Because the formation enthalpy of ThMn12–SmZn11–12 is less than that of Sm2Fe17, it is considered that the Zn diffuses in the Sm2Fe17 phase then reacts with Sm to afford the Sm(Zn,Fe)12 and residual α-FeZn phases shown in Figs. 7–9.
Next, the microstructure of the region (B) in Fig. 4(c) was examined by TEM. As shown in Figs. 4(a)–(c), region (B) emerged after the formation of region (C), suggesting that the former may have originated from the latter. Figure 10 presents a bright-field TEM image and SAD pattern taken from region (B) in Fig. 4(c). As labeled in Fig. 10(a), the composition determined by TEM-EDX was Fe8.5–Zn85.8–Sm5.7, which is similar to the SEM-EDX result shown in Fig. 4(c). The bright-field TEM image indicated that this region consisted of fine grains with sizes ranging from 10 to 20 nm, and the SAD pattern (Fig. 10(b)) composed of multiple rings owing to these fine polycrystalline grains. Although some of these rings could not be assigned, most of them corresponded to the Γ-FeZn phase, which possesses a cubic structure with space group no. 217, and the α-FeZn phase. Because the EDX analysis indicated that region (B) contained approximately 6 at% of Sm, it is considered that this region (B) also included ternary alloy grains in addition to the Γ- and α-FeZn binary alloy grains. Considering that both regions (A) and (C) contained fine grains of Sm(Zn,Fe)12, it is thought that region (B) also contained the Sm(Zn,Fe)12 phase. Consequently, region (B) is considered to be composed of polycrystalline nanosized grains of the Γ-FeZn, α-FeZn, and Sm(Zn,Fe)12 phases.

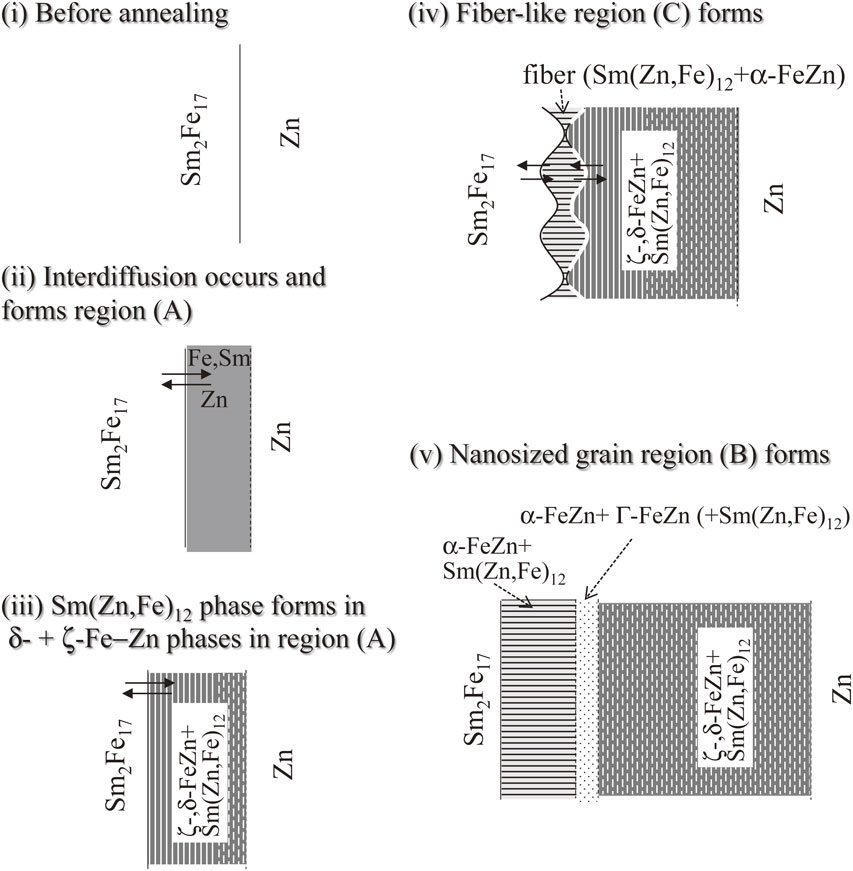
Figure 11 summarizes the observed morphological and microstructural changes. In the early stage of diffusion depicted in step (ii) in Fig. 11, the interdiffusion of Zn, Fe, and Sm occurs, resulting in the appearance of the Zn-rich diffusion region (A) consisting of the ζ- and δ1p-Fe–Zn phases between the Sm2Fe17 and Zn phases (Fig. 4(a)). As the interdiffusion of these elements progresses, region (A) becomes thicker and the Zn–Fe–Sm ternary alloy phase appears (Fig. 4(b) and step (iii) in Fig. 11). This ternary alloy phase must correspond to Sm(Zn,Fe)12, which was identified in the ζ- and δ1p-Fe–Zn phases. This Sm(Zn,Fe)12 phase possesses the ripple-like microstructure shown in Fig. 4(b), and it exhibits an isolated morphology in region (A) far from the Sm2Fe17 interface (Fig. 4(b)) or in samples annealed at higher temperatures (Fig. 4(c)). The results indicate that the Sm(Zn,Fe)12 phase originates from the Sm2Fe17 phase after Zn diffusion therein, and the faster diffusion coefficient of Zn with respect to Fe and Sm could account for microstructural variation from ripple-like to isolated. Further Zn diffusion into the Sm2Fe17 phase leads to the fiber-like microstructure observed for region (C) in Figs. 4(b) and (c). This region (C) changes from wedge-shaped to layer-like as diffusion progresses (Figs. 4 and steps (iv) and (v) in Fig. 11). Interestingly, the fiber-like microstructure of region (C) is composed of α-FeZn and Sm(Zn,Fe)12 phases with the specific orientational relationship of α-FeZn(10-1)[111]//Sm(Zn,Fe)12(01-1)[011]. As the Zn diffusion progresses into the fiber-like region (C), the Zn reacts with the α-FeZn phase to Γ-FeZn and residual α-FeZn phases, which can stably coexist as shown by the phase diagram for Fe–Zn binary alloy.43) In addition, the fiber-like microstructure composed of α-FeZn and Sm(Zn,Fe)12 is converted to polycrystalline nanosized grains to form region (B) consisting of Γ-FeZn, α-FeZn, and Sm(Zn,Fe)12 at the front of region (C) (Fig. 4(c) and step (v) in Fig. 11). Upon further Zn diffusion into the layer-like region (B), the Γ-FeZn and α-FeZn phases are converted into the Zn-rich ζ- and δ1p-Fe–Zn phases, and region (B) is gradually converted to region (A) as its Zn content increases.
In this study, detailed microstructural changes between Sm2Fe17 and Zn interface was revealed. This study suggests important fact that forming α-Fe(Zn) phase is inevitable because of Zn diffusion in Sm2Fe17 phase. In previous papers about Zn-bonded Sm2Fe17N3 magnets, α-Fe phase was discussed to form by oxidation decomposition of Sm2Fe17N3 phase. However, this study suggests that the Zn diffusion in Sm2Fe17N3 phase could also decompose the Sm2Fe17N3 phase resulting in forming α-Fe(Zn) phase. In our previous reports about microstructural observation in high coercivity Zn-bonded Sm2Fe17N3 magnets,25) there were a α-FeZn grain surrounded by Γ-FeZn phase at grain boundary and a Zn-diffused region composed of polycrystalline nanosized grains of α-Fe(Zn), Γ-FeZn, and Sm–O phases at the surface of Sm2Fe17N3 phase. This Zn-diffused polycrystalline region could correspond to the region (B) observed in this study. Although soft-magnetic α-FeZn appeared, the Zn-bonded Sm2Fe17N3 magnets showed high coercivity. The reason is discussed as follows; although α-FeZn appeared in the Sm2Fe17N3 Zn-bonded magnets, the α-FeZn grains at the surface of Sm2Fe17N3 phase were nanometer in size, which were below single domain size, and the grains were embedded in Γ-FeZn phase. Coarse α-FeZn grains at the grain boundary was also surrounded by the Γ-FeZn phase. Because the Γ-FeZn phase was non-magnetic,44) the soft magnetic α-FeZn phase was thought to be magnetically isolated from hard magnetic Sm2Fe17N3 phase resulting in high coercivity even though there was a knick in hysteresis loop.24,25)


