Abstract
The catalytic hydrogenation of acetylene over crystalline CeNi2 and amorphous CeNi2Hx was investigated. CeNi2 was found to undergo a transformation to an amorphous phase after exposure to 0.35 MPa hydrogen at 25°C. Both crystalline CeNi2 and amorphous CeNi2Hx without exposure to air showed minimal catalytic activity. These results indicated that the hydrogen-induced amorphization of CeNi2Hx does not result in an increase of catalytic activity and that the absorbed hydrogen in CeNi2Hx was minimally active. After exposure to air, both materials were found to catalyze the hydrogenation of acetylene, suggesting that surface oxidation was a prerequisite. Amorphous CeNi2Hx also exhibited higher catalytic activity than crystalline CeNi2 and provided complete conversion of acetylene at 125°C. Both the crystalline CeNi2 and amorphous CeNi2Hx were characterized by X-ray photoelectron spectroscopy, thermogravimetry-differential thermal analysis and transmission electron microscopy. Amorphous CeNi2Hx was more readily oxidized and formed a dense surface nanostructure that provided superior catalytic activity. Amorphous CeNi2Hx is evidently a better catalytic precursor for acetylene hydrogenation than crystalline CeNi2.

1. Introduction
Hydrogen storage is an important aspect of developing a so-called hydrogen economy.1,2) Hydrogen absorption is one of the most interesting properties of intermetallic compounds (IMCs), and many IMCs with this ability have been reported.3,4) These materials also have potential applications as catalysts, and the catalytic properties of some hydrogen storage materials have been investigated.5–13) Kato et al. applied metal hydrides to carbon dioxide (CO2) hydrogenation6,7) and reported that the hydrogen desorption from bulk alloys was an important step in the reduction of CO2.7) Soga et al. used LaNi5, one of the most well-known hydrogen storage alloys, to hydrogenate ethylene (C2H4) and found that the hydrogen contained in LaNi5Hn is used for hydrogenation without the need for hydrogen in gas phase.5) On the other hand, recent research by our own group with RENi5 (RE = rare earth element)-based hydrogen storage alloys10,11) showed that absorbed hydrogen in these compounds exhibited minimal activity, but changes in the electronic states of these materials due to hydrogen absorption increased their ability of the hydrogenation of acetylene (C2H2),10) propyne (C3H4)10) and C2H4.11) Furthermore, recent studies have demonstrated that the catalytic activity of some IMCs for the hydrogenation of hydrocarbons is reduced following hydrogen absorption.9,11,13) As an example, the catalytic activity for the hydrogenation of C2H2 and C2H4 over Mg2Ni is reduced by hydrogen absorption and formation of Mg2NiH4.9,11) BaGa2H2 also shows lower activity for the hydrogenation of phenylacetylene than Zintl phase BaGa2.13) Therefore, the contribution of hydrogen absorption to catalytic efficiency remains uncertain and requires further research.
Hydrogen-induced amorphization (HIA) is an interesting phenomenon in which the ordered structure of a material transforms to a disordered, amorphous structure upon hydrogen absorption.14) That is, hydrogen absorption changes the atomic arrangement and also the electronic state, which would be expected to significantly modify any catalytic properties. In fact, it has been previously reported that amorphous materials cause unique catalytic performance because of their disordered structures, no surface segregation and specific coordination states, which are different from those in the crystalline form.15–19) Thus, IMCs capable of undergoing HIA could represent unique catalysts. Alloys having C15 Laves phases and the formula REM2 (M = Fe, Co or Ni) are known to exhibit HIA.20,21) Endo et al. reported that amorphous CeNi2Hx demonstrates excellent performance as a catalytic precursor for carbon monoxide (CO) hydrogenation.22) Amorphous CeNi2Hx also shows higher activity for the hydrogenation of C2H2 and C2H4 than crystalline CeNi2.23,24) Previous reports concluded that the disordered structure of the amorphous phase in CeNi2Hx leads to high catalytic activity.23,24) However, the specific active sites and mechanism of catalytic activity were not identified in previous research.23,24) In the present study, in order to clarify the mechanism of catalytic activity of CeNi2Hx, we assess the catalytic properties of crystalline CeNi2 and amorphous CeNi2Hx from the prospective of the HIA characteristics, hydrogen absorption and oxidation of these materials. Furthermore, the expression of catalytic activity and active sites of both compounds is evaluated.
2. Experimental
CeNi2 was prepared by arc melting in a furnace under an argon (Ar) atmosphere, using Ce (99.9% purity) and Ni (99.9% purity) as the raw materials. The as-cast alloy was heat treated at 500°C for 72 h to ensure a homogeneous material. Amorphous CeNi2Hx was prepared as follows: first the heat-treated ingot was crashed to obtain particles in the size range of 25–63 µm in mortar, next the particles were transferred into stainless-steel vessel, then hydrogen at a pressure of 0.35 MPa was introduced and held at 25°C for 3 h. Structural analyses of the product was performed using powder X-ray diffraction (XRD; Ultima IV, Rigaku). The alloy composition was determined by inductively coupled plasma atomic emission spectroscopy (ICP-AES; SPECTRO, ARCOS EOP) while surface analysis was conducted using X-ray photoelectron spectroscopy (XPS; PHI 5600, ULVAC-PHI). Thermogravimetry-differential thermal analysis (TG-DTA; Thermo plus TG8120, Rigaku) data were acquired in the temperature range from 25 to 600°C under a 20% O2/80% Ar flow (400 mL/min), employing a sample mass of approximately 17 mg. The morphology and microstructure were determined by transmission electron microscopy (TEM; Topcon, EM-002B).
Catalytic trials were performed using a fixed-bed flow reactor with a reaction gas comprising 2% C2H2/18% He/80% H2. The total flow rate and total pressure were 30 mL/min and 0.1 MPa, respectively. The products were analyzed by in-line gas chromatography (GC; GC2014, Shimadzu). The conversion of C2H2 and the selectivity for C2H4 were defined as:
| \begin{align*}
\text{Conv.}\ [\%]& = ([\text{C$_{2}$H$_{2}$(feed)}]_{\text{mol}} \\
&\quad - [\text{C$_{2}$H$_{2}$}]_{\text{mol}})/[\text{C$_{2}$H$_{2}$(feed)}]_{\text{mol}}\times 100
\end{align*}
|
and
| \begin{equation*}
\text{Sel.}\ [\%] = [\text{C$_{2}$H$_{4}$}]_{\text{mol}}/([\text{C$_{2}$H$_{4}$}]_{\text{mol}} + [\text{C$_{2}$H$_{6}$}]_{\text{mol}})\times 100.
\end{equation*}
|
The carbon loss originating from carbon deposition, higher molecular weight hydrocarbons or the formation of oligomers was calculated as:
| \begin{align*}
\text{C}_{\text{loss}}\ [\%] &= ([\text{C$_{2}$H$_{2}$(feed)}]_{\text{mol}} - [\text{C$_{2}$H$_{2}$}]_{\text{mol}} - [\text{C$_{2}$H$_{4}$}]_{\text{mol}}\\
&\quad - [\text{C$_{2}$H$_{6}$}]_{\text{mol}})/[\text{C$_{2}$H$_{2}$(feed)}]_{\text{mol}}\times 100.
\end{align*}
|
Catalytic tests were initially conducted without exposing the samples to air. In these trials, the crystalline CeNi2 was sieved to obtain particles sizes in the range of 25–63 µm, and amorphous CeNi2Hx was prepared inside a glovebox under an Ar atmosphere (with an O2 level of less than 1 ppm), after which approximately 0.15 g of each specimen was transferred into the reactor and catalytic assessments were carried out. Following this, the catalytic properties of the two materials were evaluated after air exposure. That is, both the crystalline CeNi2 and amorphous CeNi2Hx were exposed to air after which 0.15 g samples of each were transferred to the reactor. Then, the catalyst test was performed. The specific surface area of each specimen was estimated using the Brunauer-Emmett-Teller (BET) method based on krypton adsorption data.
3. Results and Discussion
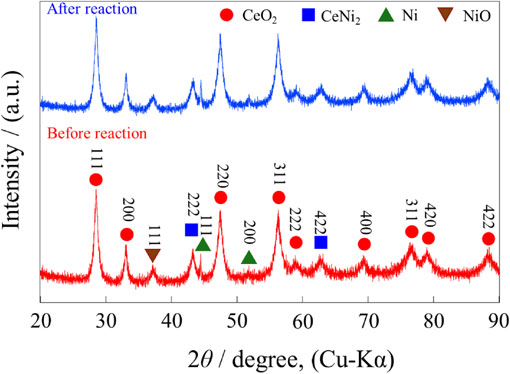
The XRD pattern for the annealed CeNi2 is presented in Fig. 1(a). This specimen comprised a C15 Laves phase (meaning a cubic structure with space group Fd-3m).25,26) The indexed pattern corresponded well to this phase and showed a lattice parameter of 0.723 nm. The composition of the specimen determined from the ICP analysis was CeNi1.99. The XRD pattern for the amorphous CeNi2Hx is displayed in Fig. 1(c), showing that the diffraction peaks originally obtained from the crystalline CeNi2 were disappeared after the hydrogen absorption treatment. The HIA of the CeNi2 was therefore essentially complete after treatment under 0.35 MPa hydrogen for 3 h, in agreement with previous reports.23,24) The results of the catalytic assessments of the crystalline CeNi2 and amorphous CeNi2Hx without exposure to air are shown in Fig. 2, while the specific surface areas of both materials before and after the catalytic reaction are summarized in Table 1. It is apparent that neither the crystalline CeNi2 nor the amorphous CeNi2Hx prepared without exposure to air showed significant catalytic activity, giving C2H2 conversions of less than 3%. Endo et al. reported that amorphous CeNi2Hx converted C2H2 or C2H4 at around 100°C,23,24) but this level of catalytic activity was not observed in the present samples processed under an inert atmosphere. The XRD pattern for the amorphous CeNi2Hx was also found not to have changed after the reaction (Figs. 1(c) and (d)). In contrast, the intensity of the XRD peaks generated by the CeNi2 following the reaction was reduced by about 75% (Figs. 1(a) and (b)). In fact, integral intensity of (331) peak was reduced by about 35%. This decrease in intensity indicates that the CeNi2 absorbed hydrogen from the reaction gas mixture during the catalytic test and underwent HIA. However, the crystalline CeNi2 that presumably underwent HIA also did not show catalytic activity (Fig. 2). Thus, although Endo et al. found that CeNi2 showed higher catalytic activity after undergoing HIA,23,24) this effect was not observed in the present work with CeNi2. In addition, the absorbed hydrogen in CeNi2Hx exhibited minimal activity and did not appear to improve the catalytic activity by reacting directly with the C2H2. Soga et al. reported that the absorbed hydrogen in LaNi5Hx reacts with C2H4 and forms C2H6, instead of using gas phase hydrogen.5) However, our prior work demonstrated that the absorbed hydrogen in RENi5−xAlxHx (RE = La, Er) did not significantly participate in the hydrogenation of C2H2 and C2H410,11) but rather acted to optimize the electronic states of these compounds to promote the reaction.11) The results of the present study show that the absorbed hydrogen in CeNi2Hx exhibited minimal activity (that is, almost no reaction is evident in Fig. 2), which is consistent with our previous finding.10,11)


Table 1 Specific surface areas of CeNi2 and CeNi2Hx samples before and after catalytic tests performed without exposure to air.
Although the lattice volume of an IMC typically increases after hydrogen absorption, the XRD peaks generated by the CeNi2 after the reaction (Fig. 1(b)) were shifted to higher angles and the lattice volume of the material was decreased by 3.3%. This abnormal behavior associated with hydrogen absorption was also observed in prior works.27–29) Paul-Boncour et al. found that the Ce valency was decreased after hydrogen absorption based on assessing X-ray absorption at the Ce LIII edge.27) The atomic radius of Ce and the lattice volume should increase with decreasing valency, and so the change in Ce valency with hydrogen absorption does not explain the lattice contraction.27) Other studies have suggested that Ce atoms are removed from crystalline CeNi2 during hydrogen absorption to generate Ce1−xNi2, which contains numerous vacancies.28,29) Kim et al. reported that CeNi2 undergoes HIA at a low temperature of −76°C under 4.5 MPa H2 and is decomposed into two amorphous phases that are either Ce or Ni rich.30) The evident shift in the XRD peaks to higher angles in Fig. 1(b) is suggested to originate from the high concentration of vacancies in the Ce1−xNi2 during the phase transformation.
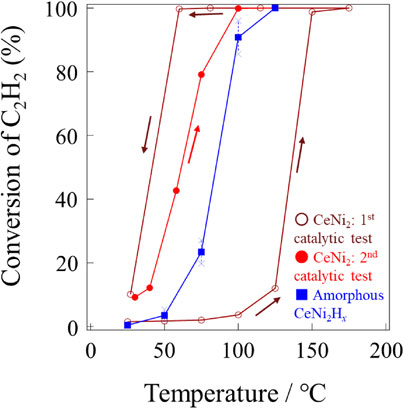
The catalytic behavior of crystalline CeNi2 and amorphous CeNi2Hx samples that had been exposed to air was also investigated, and the XRD patterns for these specimens are presented in Fig. 3 while the results of catalytic trials and specific surface areas are summarized in Fig. 4 and Table 2, respectively. Both materials catalyzed the hydrogenation of C2H2, as shown in Fig. 4(a). The amorphous CeNi2Hx completely converted C2H2 at 125°C, and about 15% of the original C2H2 was lost as other products (such as carbon deposits, higher molecular weight hydrocarbons and oligomers) at this time. This sample also exhibited higher catalytic activity than crystalline CeNi2, in agreement with reports by Endo et al.23,24) Therefore, surface oxidation of this compound is required for it to provide catalysis. The changes in the XRD patterns for the crystalline CeNi2 and amorphous CeNi2Hx after the reaction as seen in Fig. 3 were the same as those obtained from the CeNi2 and CeNi2Hx not exposed to air (Fig. 1). The HIA of the crystalline CeNi2 during the catalytic tests was assessed by acquiring in situ XRD patterns at the same hydrogen partial pressure as was applied during the catalytic trials (PH2 = 0.08 MPa), and these patterns are shown in Fig. A1. The in situ XRD patterns obtained under hydrogen indicate that the crystalline CeNi2 underwent HIA between 100 and 150°C and that the HIA process continued up to 200°C. However, improvements in catalytic activity such as were exhibited by the amorphous CeNi2Hx were not shown by the crystalline CeNi2 after heating at 100–200°C (Fig. 4). Thus, the HIA of crystalline CeNi2 did not improve its catalytic performance.


Table 2 Specific surface areas of CeNi2 and CeNi2Hx before and after catalytic tests performed after exposure to air.
Surface analysis of the crystalline CeNi2 and amorphous CeNi2Hx after exposure to air was performed by acquiring XPS data. The results of these analyses are displayed in Fig. 5 while the details regarding the reference materials (CeO2, NiO and Ni) used for comparison are described in Table A1. Six peaks (v, v′′, v′′′, u, u′′ and u′′′) corresponding to Ce4+ were obtained from the reference CeO2 sample.31–33) The v(indexed) and u(indexed) in Fig. 5(a) represent Ce 3d5/2 and Ce 3d3/2 states, respectively.31) The Ce 3d spectra obtained from the crystalline CeNi2 and amorphous CeNi2Hx showed different peaks (v0, v′, u0 and u′) from those for the reference CeO2 that were attributed to Ce3+.31–33) Therefore, the Ce on the surfaces of both specimens was likely present as CeO2 with defects. CeO2 is often used as a catalyst support and the oxide itself has actually been shown to catalyze the hydrogenation of alkynes.34,35) However, the catalytic activity of the reference CeO2 was found to be very low under the test conditions employed in this study (see Appendix Section A3). This was not unexpected since the present test conditions were quite different from those under which this oxide has demonstrated catalytic activity in previous work.35) A prior study revealed that the reduction of CeO2 and the formation of oxygen vacancies decreased the catalytic activity for C2H2 hydrogenation.35) It should also be noted that the hydrogen concentration in the reaction gas in this study (H2/C2H2 = 40) was higher than that in the previous study (H2/C2H2 = 10–30).35) In addition, the present reaction temperature of less than 200°C was lower than that in previous research (150–350°C).35) Therefore, the Ce oxide on the crystalline CeNi2 and amorphous CeNi2Hx surfaces are not believed to have served as active sites. Furthermore, the Ce 3d XPS spectra obtained from the crystalline CeNi2 and amorphous CeNi2Hx (Fig. 5(a)) were very similar, and so did not explain the different catalytic properties of these two materials. Consequently, Ni atoms are believed to have functioned as the active sites. The two specimens generated Ni 2p XPS spectra at the same positions, but the peaks were shifted to higher energies than those in the spectrum of the Ni reference. This suggests an interaction between Ni atoms and Ce oxide in which Ni transfers electrons to compensate the unpaired electrons in Ce3+. The peak at 856.7 eV in the Ni 2p XPS spectra obtained from both the crystalline CeNi2 and amorphous CeNi2Hx (indicated by the * symbol in Fig. 5(b)) is attributed to the formation of the metastable Ni oxide since it is close to the 856.1 eV value for Ni3+.36) The assignment of this peak to Ni3+ is also supported by the higher binding energy compared with the Ni2+ peak generated by the NiO reference. The Ni 2p peak at 856.7 eV in the amorphous CeNi2Hx spectrum is more obvious than that in the crystalline CeNi2 spectrum and so the amorphous CeNi2Hx was evidently more readily oxidized than crystalline CeNi2.

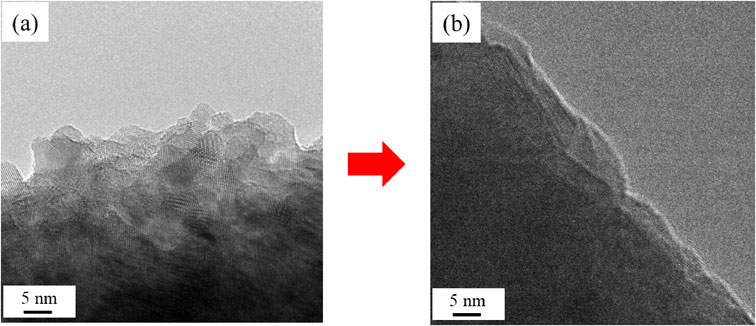
The TG-DTA data are presented in Fig. 6. Figure 6(a) shows an exotherm corresponding to oxidation of amorphous CeNi2Hx that is about 100 degrees centigrade lower than that of crystalline CeNi2, indicating again that the former material was easier to oxidize even in the bulk. The endothermal response obtained from amorphous CeNi2Hx at about 170°C suggests hydrogen desorption. The increase in mass due to oxidation in Fig. 6(b) was less for amorphous CeNi2Hx than for crystalline CeNi2, and there are two possible reasons for this difference. One is that amorphous CeNi2Hx released absorbed hydrogen during the TG-DTA analysis, while the other is that this material was more readily oxidized and that oxidation had taken place by the time the sample was mounted in the apparatus. The above results are reasonable since it has been reported that the hydride Zr3AuHx is more easily oxidized than Zr3Au, which does not contain absorbed hydrogen.37) TEM images acquired from these samples are displayed in Fig. 7. Selected area electron diffraction (SAED) results for the crystalline CeNi2 and amorphous CeNi2Hx in Figs. 7(b) and (d), respectively, exhibit crystal and halo patterns, respectively. The inner and outer rings in Fig. 7(d) demonstrate spacings of d = 0.327 and 0.200 nm, respectively. Kim et al. suggested that the inner ring corresponds to a Ce rich amorphous phase (based on CeH2 (111), d = 0.322 nm) while the outside one is related to a Ni rich phase (based on CeNi5 (111), d = 0.207 nm).30) This suggestion could be accurate because amorphous CeNi2Hx undergoes a disproportionation reaction upon heat treatment and recrystallize as CeH2 and CeNi5.22,30) However, it should be noted that these structures may have been present only in small areas of the specimen or were generated in response to heating by the electron beam during the TEM analysis. It should be noted the XRD patterns obtained from amorphous CeNi2Hx (Figs. 1 and 3) did not show peaks corresponded to these halo rings. The TEM image of crystalline CeNi2 in Fig. 7(a) demonstrates a relatively smooth surface, while that of amorphous CeNi2Hx (Fig. 7(c)) indicates both fine and rough nanoscale surface structures. The fine surface structure formed on amorphous CeNi2Hx as a consequence of the HIA and of atmospheric oxidation has been responsible for the higher catalytic activity of this material compared with crystalline CeNi2. We also confirmed that the oxidation of crystalline CeNi2 at 400°C increased the surface area and resulted in higher catalytic activity, comparable to that of amorphous CeNi2Hx (see Appendix Section A4). The decreased specific surface area of amorphous CeNi2Hx after the catalytic reaction (Table 2) is attributed to the decrease in the fine surface nanostructure during catalytic reaction, as shown in Fig. A5. In summary, the above results indicate that amorphous CeNi2Hx was more easily oxidized than crystalline CeNi2 and showed high catalytic activity by the formation of a fine surface nanostructure due to HIA and atmospheric oxidation.

4. Conclusion
Hydrogenation of C2H2 over crystalline CeNi2 and amorphous CeNi2Hx was investigated from the viewpoint of HIA, the activity of absorbed hydrogen and surface oxidation. CeNi2 absorbed hydrogen at a hydrogen pressure of 0.35 MPa at 25°C and underwent HIA under these conditions. Crystalline CeNi2 and amorphous CeNi2Hx without air exposure showed no significant catalysis, confirming that the HIA itself did not provide catalytic activity and that the activity of the absorbed hydrogen in CeNi2Hx was also minimal. Both materials did exhibit catalytic activity after exposure to air, demonstrating that surface oxidation was necessary for catalysis. Amorphous CeNi2Hx showed higher catalytic activity than crystalline CeNi2 and completely converted C2H2 at 125°C. Both XPS and TG-DTA revealed that amorphous CeNi2Hx was more readily oxidized in conjunction with surface decomposition that generated ceria, Ni and partial Ni oxide. Ni atoms evidently functioned as the active sites in this material because the CeO2 reference sample did not show catalysis under the same conditions. A fine nanostructure was observed on the surface of amorphous CeNi2Hx in TEM images and this specimen is believed to have provided a high degree of catalytic activity as a consequence of this nanostructure, which in turn was produced by HIA and atmospheric oxidation. We conclude that amorphous CeNi2Hx is a better catalytic precursor for C2H2 hydrogenation than crystalline CeNi2.
Acknowledgements
This study was supported by a JSPS KAKENHI grant (no. 21J10161) and Grants-in-Aid for Scientific Research (nos. 18H01783, 19H02452 and 20H05260) from the Ministry of Education, Culture, Sports, Science and Technology (MEXT) of Japan and by the Dynamic Alliance for Open Innovation Bridging Human, Environment and Materials.
The authors thank Yoshiyuki Gambe for providing assistance in acquiring the XPS data and Satoko Murata for assisting in the ICP analyses.
REFERENCES
- 1) J.O. Abe, A.P.I. Popoola, E. Ajenifuja and O.M. Popoola: Int. J. Hydrogen Energ. 44 (2019) 15072–15086. doi:10.1016/j.ijhydene.2019.04.068
- 2) G. Marbán and T. Valdés-Solís: Int. J. Hydrogen Energ. 32 (2007) 1625–1637. doi:10.1016/j.ijhydene.2006.12.017
- 3) K.C. Kim: Int. J. Energy Res. 42 (2018) 1455–1468. doi:10.1002/er.3919
- 4) B. Sakintuna, F. Lamari-Darkrim and M. Hirscher: Int. J. Hydrogen Energ. 32 (2007) 1121–1140. doi:10.1016/j.ijhydene.2006.11.022
- 5) K. Soga, H. Imamura and S. Ikeda: J. Phys. Chem. 81 (1977) 1762–1766. doi:10.1021/j100533a010
- 6) S. Kato, A. Borgschulte, D. Ferri, M. Bielmann, J.C. Crivello, D. Wiedenmann, M. Parlinska-Wojtan, P. Rossbach, Y. Lu, A. Remhof and A. Züttel: Phys. Chem. Chem. Phys. 14 (2012) 5518–5526. doi:10.1039/c2cp23264b
- 7) S. Kato, S.K. Matam, P. Kerger, L. Bernard, C. Battaglia, D. Vogel, M. Rohwerder and A. Züttel: Angew. Chem. Int. Ed. 55 (2016) 6028–6032. doi:10.1002/anie.201601402
- 8) R. Yamagishi, T. Kojima, S. Kameoka, D. Okuyama, T.J. Sato, C. Nishimura and A.P. Tsai: Int. J. Hydrogen Energ. 42 (2017) 21832–21840. doi:10.1016/j.ijhydene.2017.07.072
- 9) R. Tsukuda, R. Yamagishi, S. Kameoka, C. Nishimura and A.P. Tsai: Sci. Technol. Adv. Mater. 20 (2019) 774–785. doi:10.1080/14686996.2019.1629836
- 10) R. Tsukuda, T. Kojima, D. Okuyama, S. Kameoka, C. Nishimura and A.P. Tsai: Int. J. Hydrogen Energ. 45 (2020) 19226–19236. doi:10.1016/j.ijhydene.2020.05.062
- 11) R. Tsukuda, T. Kojima, Y. Xu, C. Nishimura, M. Krajči and S. Kameoka: J. Phys. Chem. C 125 (2021) 20919–20929. doi:10.1021/acs.jpcc.1c06484
- 12) H. Yu, X. Yang, X. Jiang, Y. Wu, S. Chen, W. Lin, Y. Wu, L. Xie, X. Li and J. Zheng: Nano Energy 80 (2021) 105476. doi:10.1016/j.nanoen.2020.105476
- 13) K.L. Hodge and J.E. Goldberger: J. Am. Chem. Soc. 141 (2019) 19969–19972. doi:10.1021/jacs.9b09856
- 14) X.L. Yeh, K. Samwer and W.L. Johnson: Appl. Phys. Lett. 42 (1983) 242–244. doi:10.1063/1.93901
- 15) Á. Molnáar, G.V. Smith and M. Bartók: Adv. Catal. 36 (1989) 329–383. doi:10.1016/S0360-0564(08)60020-6
- 16) J.F. Deng, H. Li and W. Wang: Catal. Today 51 (1999) 113–125. doi:10.1016/S0920-5861(99)00013-9
- 17) W. Cai, R. Chen, H. Yang, H.B. Tao, H.Y. Wang, J. Gao, W. Liu, S. Liu, S.F. Hung and B. Liu: Nano Lett. 20 (2020) 4278–4285. doi:10.1021/acs.nanolett.0c00840
- 18) N. Yang et al.: Adv. Mater. 30 (2018) 1803234. doi:10.1002/adma.201803234
- 19) J. He, P. Lyu, B. Jiang, S. Chang, H. Du, J. Zhu and H. Li: Appl. Catal. B 298 (2021) 120603. doi:10.1016/j.apcatb.2021.120603
- 20) K. Aoki and T. Masumoto: J. Alloy. Compd. 231 (1995) 20–28. doi:10.1016/0925-8388(95)01832-8
- 21) K. Aoki, X.G. Li and T. Masumoto: Acta Metall. Mater. 40 (1992) 1717–1726. doi:10.1016/0956-7151(92)90115-U
- 22) N. Endo, S. Ito, K. Tomishige, S. Kameoka, A.P. Tsai, T. Hirata and C. Nishimura: Catal. Today 164 (2011) 293–296. doi:10.1016/j.cattod.2010.11.039
- 23) N. Endo, S. Kameoka, A.P. Tsai, T. Hirata and C. Nishimura: Mater. Trans. 52 (2011) 1794–1798. doi:10.2320/matertrans.MAW201105
- 24) N. Endo: Ph. D. Dissertation, (Tohoku University, 2011).
- 25) R.C. Mansey, G.V. Raynor and I.R. Harris: J. Less-Common Met. 14 (1968) 337–347. doi:10.1016/0022-5088(68)90039-8
- 26) R.C. Mansey, G.V. Raynor and I.R. Harris: J. Less-Common Met. 14 (1968) 329–336. doi:10.1016/0022-5088(68)90038-6
- 27) V. Paul-Boncour, A. Percheron-Guégan, M. Diaf and J.C. Achard: J. Less-Common Met. 131 (1987) 201–208. doi:10.1016/0022-5088(87)90518-2
- 28) V. Paul-Boncour, C. Lartigue, A. Percheron-Guégan, J.C. Achard and J. Pannetier: J. Less-Common Met. 143 (1988) 301–313. doi:10.1016/0022-5088(88)90052-5
- 29) M.D. Chio, S. Livraghi and M. Baricco: J. Alloy. Compd. 426 (2006) 180–185. doi:10.1016/j.jallcom.2006.02.041
- 30) Y.G. Kim, S.M. Lee and J.Y. Lee: J. Less-Common Met. 169 (1991) 245–256. doi:10.1016/0022-5088(91)90073-D
- 31) A. Pfau and K.D. Schierbaum: Surf. Sci. 321 (1994) 71–80. doi:10.1016/0039-6028(94)90027-2
- 32) J.P. Holgado, R. Alvarez and G. Munuera: Appl. Surf. Sci. 161 (2000) 301–315. doi:10.1016/S0169-4332(99)00577-2
- 33) K.I. Maslakov, Y.A. Teterin, A.J. Popel, A.Y. Teterin, K.E. Ivanov, S.N. Kalmykov, V.G. Petrov, P.K. Petrov and I. Farnan: Appl. Surf. Sci. 448 (2018) 154–162. doi:10.1016/j.apsusc.2018.04.077
- 34) G. Vilé, B. Bridier, J. Wichert and J. Pérez-Ramírez: Angew. Chem. Int. Ed. 51 (2012) 8620–8623. doi:10.1002/anie.201203675
- 35) J. Carrasco, G. Vilé, D. Fernández-Torre, R. Pérez, J. Pérez-Ramírez and M.V. Ganduglia-Pirovano: J. Phys. Chem. C 118 (2014) 5352–5360. doi:10.1021/jp410478c
- 36) A.F. Carley, S.D. Jackson, J.N. O’Shea and M.W. Roberts: Surf. Sci. 440 (1999) L868–L874. doi:10.1016/S0039-6028(99)00872-9
- 37) N. Endo, S. Kameoka, A.P. Tsai, T. Hirata and C. Nishimura: Catal. Lett. 193 (2010) 67–71. doi:10.1007/s10562-010-0397-x
Appendix
A1. In Situ XRD Analyses of CeNi2 under H2
The in situ XRD patterns acquired under a hydrogen atmosphere are presented in Fig. A1. Prior to obtaining patterns, the CeNi2 was ground in a mortar and pestle under air to obtain particle sizes less than 25 µm. The in situ XRD analyses were conducted using an Empyrean instrument (PANalytical). After applying a vacuum, hydrogen was introduced to the same partial pressure as was used in the catalyst tests (PH2 = 0.08 MPa), and the temperature was raised to 200°C and then lowered to 25°C. The intensity of the XRD peaks began to decrease at 150°C and the peaks shifted to higher angles. A further intensity decrease appeared at 200°C but there were no changes as the sample was cooled. Therefore, the HIA of crystalline CeNi2 would have occurred between 100 and 150°C and progressed up to 200°C during the catalytic tests.
A2. XPS Analysis Details
Details concerning the reference materials used in the XPS analyses (CeO2, NiO and Ni) are summarized in Table A1. Note that the Ni foil was treated by Ar+ sputtering before acquiring XPS data, which caused the peak in its O 1s spectrum to almost disappear.

Table A1 Details regarding the reference materials used in XPS analyses.
A reference sample of powdered CeO2 (JRC-CEO-4, The Catalysis Society of Japan made by KANTO CHEMICAL Co.) having a specific surface area of 65.1 m2/g was used for the catalytic tests. The diffraction patterns by XRD measurement corresponded to single phase CeO2 with the space group Fm-3m and a lattice parameter of 0.541 nm. In this trial, a 0.03 g quantity of CeO2 was transferred into the reactor and a catalytic test was conducted. The catalytic activity of CeO2 was found to be minimal under the present conditions (2% C2H2/18% He/80% H2, 30 mL/min) and the maximum conversion was 2% at 200°C.
A4. Hydrogenation of C2H2 over CeNi2 Heat Treated at 400°C under air
CeNi2 sieved to obtain particle sizes in the range of 25–63 µm was heated at 400°C for 24 h under air, and the XRD patterns for this material before and after the catalytic reaction are displayed in Fig. A2. The CeNi2 was evidently decomposed into Ni, NiO and CeO2 by the heat treatment, as shown in Fig. A2, and its specific surface area increased from 0.111(6) to 0.836 m2/g. A sample having a mass of 0.15 g was placed in the reactor and a catalytic test was conducted, with the results presented in Fig. A3. The oxidized CeNi2 exhibited significant hysteresis during the first catalytic test, which was ascribed to the reduction of the oxidized surface by hydrogen in the reaction gas mixture as the temperature was increased. The oxidized CeNi2 demonstrated greater catalytic activity than the amorphous CeNi2Hx during the second temperature increase. On this basis, it appears that high catalytic activity could be achieved by oxidizing CeNi2 without any absorbed hydrogen. The XRD pattern was not changed after the reaction (Fig. A2), while the specific surface area decreased from 0.836 to 0.731 m2/g. The Ce 3d XPS spectrum was unchanged following the reaction (Fig. A4(a)), and the peaks that were obtained were consistent with those for Ce4+ in CeO2. This result also confirmed that the Ce 3d state did not affect the catalytic properties of the material. Peaks corresponding to Ni0 were present in the Ni 2p XPS spectrum after the reaction (Fig. A4(b)), showing that Ni0 was formed via the reduction of nickel oxides by hydrogen in the reaction gas mixture during the catalytic test. Therefore, these Ni atoms are considered to have functioned as the active sites. The intense Ni2+ signal in the spectrum in Fig. A4(b) acquired after the reaction is attributed to oxidation of specimen before XPS measurements. This material possesses a large surface area and easily oxidized when exposed to air during the sample transfer process between catalytic test and XPS measurements.
TEM images of amorphous CeNi2Hx before and after the catalytic reaction are provided in Figs. A5(a) and (b), respectively. The fine surface structure is seen to have been reduced after the catalyst test, which in turn decreased the specific surface area (Table 2).