Abstract
Electrical resistivity and Vickers hardness of Alloy 625 due to cold rolling were measured, and, discussed with the microstructural change obtained using electron backscattered diffraction and X-ray diffraction. Both increase in dislocation density and grain subdivision due to rolling was observed. Although the electrical resistivity of the normal pure metals increases with increasing the rolling reduction, that of Alloy 625 initially decreased with increasing the rolling reduction of 70%. Then, the electrical resistivity slightly increased with increasing the rolling reduction of 80%. Up to the rolling reduction of 70%, the reduction of electrical resistivity is associated with K-effect, which is the destroy of the short-range ordered domain due to the plastic deformation. On the other hand, Vickers hardness increased with increasing the rolling reduction. It was associated with the contribution of grain refinement, dislocation, solid solution, and sort-range order strengthening.
This Paper was Originally Published in Japanese in J. Japan Inst. Met. Mater. 85 (2021) 391–398. Section 2.2 was slightly modified.
1. Introduction
Ni super alloys consisting of Ni as a matrix and alloying elements, such as, Cr, Mo, Al, and Ti, have been used in severe environments, e.g. high temperature materials for jet engines of aircrafts and gas turbines of power generations, and corrosion resistance materials for chemical plants, due to their superior high temperature strength, and corrosion/oxidation resistance properties. From these applications, the mechanical properties and corrosion/oxidation resistance properties were focused, but the electrical properties of Ni super alloys were rare to be focused. Especially, the reports about the effect of the plastic deformation, for instance, rolling, on the electrical properties of Ni super alloy were limited. However, the high electrical resistivity of Ni super alloys get more focused due to the progress of the electrical parts and motorization of automobiles.1)
As it is written in the textbook,2) free electrons move toward opposite direction of the current direction as an average when the current passes in metallic materials. The mean distance that free electrons move straightly without scattering is the mean free path, and the longer mean free path results in the lower electrical resistivity. Thus, the higher density of scattering centers exists, the higher electrical resistivity is observed, since the mean free path is shortened as a result of higher frequency of scattering of electrons. It is well known that solute atoms work as scattering centers of electrons, but, lattice defect, such as, vacancies, dislocation, grain boundaries (GBs), and free surfaces, also work as scattering centers. In the case of general metals, the electrical resistivity is higher at higher temperatures since the lattice vibration also affects the scattering of electrons. These are known as Matthiessen’s rule.
Lately, it was reported that the electrical resistivity increases with increasing the equivalent strain when pure metals, such as, pure aluminum, pure copper, and pure nickel, were applied an accumulative roll bonding (ARB) process which is known as one of the severe plastic deformation processes.3–5) It was shown that the change in electrical resistivity can be quantitatively evaluated from the change in the defect density, i.e. dislocation density and density of GB obtained from microstructure observations using field emission-scanning electron microscopy/electron backscattered diffraction: (FE-SEM/EBSD), scanning/transmission electron microscopy (S/TEM), and X-ray diffraction (XRD). Thus, it can be said that the quantitative analysis of lattice defects is principally possible from change of electrical resistivity.
Density of GB increases due to the grain refinement as a result of grain-subdivision in addition to the increase in dislocation density, when the ARB process which is one of the plastic deformation processes6) is applied to pure metals. Thus, electrical resistivity increases with increasing the equivalent strain given by the ARB process via the increase in lattice defect density resulting in the decrease in the mean free path of electrons. Furthermore, it was reported the ARB process could achieve the equivalent plastic deformation to the normal rolling when the surface of the rolls was made as lubricated condition formed by machine oil.7) Therefore, the relationship between electrical resistivity and microstructure in pure metals can be treated as the result of normal cold rolling apart from the fact that the value of the equivalent strain is larger than the normal cold rolling, when the plastic deformation caused by the ARB process is applied.
On the other hand, some Ni alloys, such as, Ni–Cr alloys8) and Ni–Mo alloys9) were known to exhibit order-disorder transition. Especially, Ni–Cr alloy show K-effect which are abnormal electrical behaviors being associated with the formation of short-range order or short-range clustering.10) The K-effect was observed on some alloys, for instance, Cu3Au, CuAu3, Cu2NiZn, Fe3Al alloys,10,11) and the decrease in the electrical resistivity with progressing the plastic deformation was contained as one of the abnormal electrical behaviors. It is known that the widely used 600 series solution strengthening type Ni super alloys containing high concentration of Cr show order-disorder transition.12) However, it was unclear whether the change in electrical resistivity of the solution-strengthening type Ni super alloys would simply increase due to the introduction of lattice defects by the plastic deformation or not due to the K-effect.
Therefore, Alloy 625 which is one of the solution-strengthening type Ni super alloys was used in the present study in order to investigate the change in electrical resistivity and Vickers hardness caused by the cold rolling, and tried to be associated with the change in microstructure.
2. Experimental Procedure
2.1 Sample preparation and processing
A 4 mm thick Alloy 625 sheet of which chemical composition is shown in Table 1 was subjected to this study. Solid solution treatment in ambient condition at 1473 K for 3.6 ks was applied for the subjected sheet. The sheets were rolled without a lubricating condition up to the rolling reduction of 80% using a rolling mill (Nihon cross atuen) having rolls of which diameter was 100 mm. The rolling reduction, r, was defined as following equation using the thickness before and after the rolling to be h1 and h2, respectively.
| \begin{equation}
r = (h_{1} - h_{2})/h_{1}
\end{equation}
| (1) |
Here, rolling direction (RD), transverse direction (TD), and normal direction (ND) were defined as the sample coordinates.

Table 1 Chemical composition of Alloy625.
Then, the bar shaped specimens for electrical resistivity measurement with the length of around 50 mm (RD) and the width of around 1 mm (TD) were cut by an arc discharge wire cutting machine from the rolled sheet having each rolling reduction. When the thickness was more than 1 mm after rolling, the thickness of the sheet was reduced by mechanical polishing until the thickness became 1 mm. When the thickness was less than 1 mm after rolling, the thickness of the bar shaped specimen was equal to the thickness of the rolled sheet. The specimens for microstructural observations and Vickers hardness tests were also cut by the arc discharge wire cutting machine. The surface of all the specimens was mechanically polished using emery paper #2000 in order to remove the damaged layer due to the arch discharge. In the case of the specimens for the FE-SEM/EBSD measurement, electrolytic polishing was performed in 30% nital (mixture of nitric acid and methanol, 1:2 in volume) at around 243 K with around 6 V, and the miller surface was obtained.
2.2 Electrical resistivity measurements
Electrical resistivity measurements were performed using a four-terminal method. First, four Ni wires with the diameter of 0.3 mm (Nilaco, purity of 99%) were spot welded using a spot welder NRW-100A (Nippon Avionics) and a weld head NA-60A (Nippon Avionics). Then, resistivity measurements were conducted at room temperature (R. T., 293 K) and at liquid nitrogen temperature (77 K) using a precise DC current source 6220 (Keithley) and a nanovoltmeter 2182A (Keithley) with a passing current of 100 mA and a delta mode. Here, the delta mode is a method that current direction was changed in turn for canceling the thermoelectromotive force generated within the measurement circuit. Electrical resistivity ρ was evaluated by the following equation using the cross sectional area of the specimen S, distance between wires l, passing current between the outer wires A, and voltage drop between the internal wires V.
| \begin{equation}
\rho = \frac{V}{A}\cdot \frac{S}{l}
\end{equation}
| (2) |
Here,
S and
l were measured by a digital micrometer and a digital caliper, respectively. The detail of the electrical resistivity measurements can be found elsewhere.
4,13) In this study, ARB resin frames made by a 3D printer were adopted in order to avoid the delamination of the spot-welded parts due to the handing. The ARB resin frames work without any problems like the conventional frames made by quarts rods, since they were only used for the measurements at R.T. and liquid nitrogen temperature.
2.3 Vickers hardness tests
Vickers hardness tests were conducted to evaluate the mechanical properties. In the present study, Vickers hardness machine HMV-G30 (SIMADZU) was used with the applied force of 5 kgf for 10 s. A total of 9 points, consisting of three points close to each side and three points close the center along the longitudinal direction, were measured. The maximum and the minimum values of the nine points were excluded, and finally an average value was obtained using the remaining seven points. Here, error bars represent the maximum and the minimum values of the remaining seven points.
2.4 Microstructure observations and XRD measurements
As microstructural observations, FE-SEM/EBSD measurements were performed from TD and RD using a JSM-7900F (JEOL) with the acceleration voltage of 20 kV. Both the determination of the orientation and the data analysis were performed using AZtec (Oxford Instrument).
XRD measurements were performed using a SmartLab (Rigaku) with the wave length λ = 0.15418 nm (Cu-Kα radiation), the tube voltage of 45 kV, the tube current of 200 mA, and step angle of 0.01°. As a standard material, Si powder was used to remove the instrumental profile.
Williamson-Hall method was used to determine the dislocation density from the broadening of the diffraction peaks.
| \begin{equation}
\frac{(\Delta 2\theta)\cos \theta}{\lambda} = \frac{k_{s}}{D} + \frac{2e\sin \theta}{\lambda}
\end{equation}
| (3) |
Here,
ks is the Scherrer constant, which is normally 0.9.
14) In this study, full width-half maximum (FWHM) Δ2θ was obtained by fitting of Pseudo-Voigt function. The linear fitting was performed on the Williamson-Hall plots drawn by using
eq. (3), and the crystallite size
D and the microstrain
e was evaluated from the intercept and the gradient, respectively. Then, the
eq. (4) proposed by Williamson and Smallman was used to convert the dislocation density
LV from the
e.
15)
| \begin{equation}
L_{\text{V}} = Ke^{2}/b^{2}
\end{equation}
| (4) |
Here,
b is the magnitude of Burgers vector (0.249 nm),
16) and
K is a constant according to the crystal structure. In the present study, the specimens were fcc structure, so
K = 16.1 was used.
3. Experimental Results and Discussion
3.1 Microstructural observations by EBSD and XRD measurements
Figures 1–2 show the inverse pole figure (IPF) maps constructed from the EBSD data of each rolling reduction. Figure 1 and Fig. 2 are the observations from TD and RD, respectively. As can be seen from Figs. 1–2, the grain boundary separation along ND decreases and that along RD increase with increasing the rolling reduction. It is because the grains are elongated along RD and compressed along ND at the same time, and thus, the initial grains change to the pancake-like shapes.6) Such change is the typical microstructural evolution of the material deformed by the normal rolling and the ARB process. Fine deformation twins are formed when the rolling reduction exceeds 50%. It is attributed to the lowered stacking fault energy (SFE) compared with pure Ni caused by the alloying elements, such as, Cr and Mo.17)
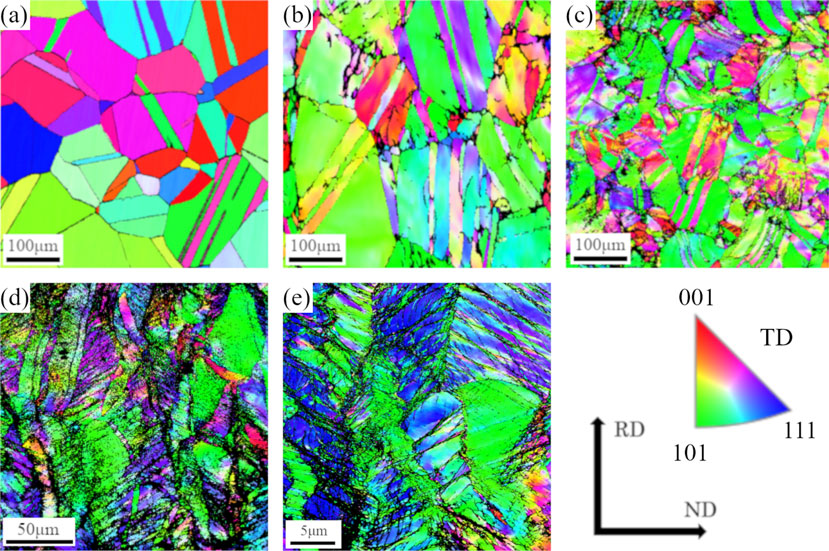

Figure 3 is the rolling reduction dependence of the mean separation of GB along ND dND obtained by the intersection method with Fig. 1. Here, GB contains both low angle grain boundary (LAGB) of which misorientation angle less than 15° and high angle grain boundary (HAGB) of which misorientation angle is equal to and more than 15°. Due to the limitation of the measurement method, GB having misorientation less than 2° is excluded. Initially, dND was around 40 µm, and it decreases down to around 2 µm with increasing the rolling reduction. It is associated with the grain refinement due to the grain subdivision6) in addition to the geometrically necessary deformation. Thus, the change in dND is similar to the case in pure metals,3) such as, the increase in LV due to plastic deformation, then forming of dislocation structures and LAGB, and finally forming of HAGB due to the increase in misorientation angle.

Figure 4 shows the result of XRD measurement of each rolling reduction. From the figure, the alloy 625 is a single phase and there is no secondary phase, which agrees with the results of EBSD measurements. From the figure, peak broadening can be seen with increasing the rolling reduction. Some peaks which cannot be seen are attributed to the formation of rolling texture. Figure 5 shows the rolling reduction dependence of LV obtained from the broadening of each peaks using Williamson-Hall method. In the case of 0%, in other words, the specimen before rolling (as solution treated) has the value lower than the measurement limit, so that, the value cannot be obtained. Since the grain size of the specimen with 0% is large to be around 40 µm, the situation is thought to be rather Laue spot-like than Debye Scherrer ring, which is caused by too small number of grains contained in the measured area. Thus, LV of 0% is assumed to be lower than 1 × 10¹⁴ m−2, and treated as a reference. As shown in Fig. 5, LV rapidly increases to be around 1.5 × 10¹⁵ m−2 at 20%, due to the introduction of dislocations by rolling via plastic deformation. LV slightly increases to be around 2.0 × 10¹⁵ m−2 between 20% and 60%. Then, LV again increases to be around 4.0 × 10¹⁵ m−2 at 80%.

It was reported that the value of LV are different depending on the measurement methods.18) When a differential scanning calorimetry is used to determine LV of ARB-Ni and ARB-Cu, although the value of the ARB-Cu is slightly higher than that of ARB-Ni, both values are around 2 × 10¹⁵ m−2. On the other hand, LV of ARB-Cu and ARB-Ni evaluated using Williamson-Hall method are around 5 × 10¹⁵ m−2 and around 3 × 10¹⁵ m−2, respectively. Furthermore, LV is around 5 × 10¹⁴ m−2 obtained by S/TEM observations on ARB-Cu.19,20) Like this, there is a difference within an order of magnitude among the value of LV obtained by different methods on an identical specimen.
3.2 Electrical resistivity measurements
Figure 6 shows the change in the electrical resistivity measured at 293 K and 77 K due to rolling. The values measured at room temperature were always around 0.03 µΩm larger than these measured at liquid nitrogen temperature because of the lattice vibration. The electrical resistivity at 293 K is initially at around 1.28 µΩm, but, it gradually decreases around 0.08 µΩm down to be around 1.19 µΩm with increasing the rolling reduction up to around 70%. Then, it finally increases around 0.01 µΩm to be around 1.21 µΩm at the rolling reduction of 80%. The electrical resistivity measured at 77 K is initially at around 1.25 µΩm, but, it gradually decreases around 0.08 µΩm down to be around 1.16 µΩm with increasing the rolling reduction up to around 70%. Then, it finally increases around 0.01 µΩm to be around 1.17 µΩm at the rolling reduction of 80%. It is common for both measured temperature cases that the electrical resistivity gradually decreases with the rolling reduction up to 70%, and then slightly increases. It indicates that the contribution (coefficient) of lattice defects against electrical resistivity is not the function of temperature. The above mentioned data is important in order to obtain the microstructure parameters using electrical resistivity measurements, since there are no reports about the electrical resistivity of Alloy 625 depending on the rolling reduction.

In the case of pure metals, electrical resistivity increases with increasing the rolling reduction. Increase in dislocation density and density of GB occur since lattice defects, i.e. dislocations and GBs are introduced with progressing the plastic deformation, which can be understood from the grain subdivision occurred in the material processed by cold rolling and the ARB process.3) It results in the decrease in the mean free path of electrons since the lattice defects can be the scattering center of electrons. Thus, the electrical resistivity of the pure metals increases with increasing the rolling reduction, which can be easily understood based on their microstructural change. However, it is different for each elements of which contribution (coefficient: Δρdisl and ΔρGB) of dislocation density and the density of GB against electrical resistivity even in the case of pure metals. The contribution of the lattice defects based on the theoretical calculation was reported,21) and some of the values are shown in Table 2. The contribution of lattice defects against the electrical resistivity was experimentally obtained, and the increase in electrical resistivity due to the plastic deformations is nΩm order in the case of Al and Cu.3,4) For instance, the electrical resistivity of pure Ni should increase around 6.74 nΩm when the dislocation density and the density of GB in Ni increase around 1015 m−2 and around 10 Mm−1, respectively.21)

On the other hand, the electrical resistivity of Alloy 625 decreases with increasing the rolling reduction. It is contradictive to the change in the lattice defects density, since both dislocation density and the density of GB evaluated by XRD measurements and microstructure observations increase. Thus, the electrical resistivity should increase based on the change in the lattice defect density. The decrease in electrical resistivity with increasing the rolling reduction is attributed to K-effect observed in Ni–Cr alloys.10,11) As the K-effect, following phenomena are known.
-
(1)
S shaped bend is seen in resistance-temperature curves.
-
(2)
Increase in electrical resistivity is observed due to low temperature annealing after quenching from high temperature.
-
(3)
Electrical resistivity decreases due to the cold working.
In the case of the present study, case (3) corresponds to the results. The K-effect is caused when the density of the scattering center of electrons changes due to the temperature change or progress of the plastic deformation in alloys showing order-disorder transition. Qualitatively, it can be understood that the solid solution treated alloys having short-range order has less ordered structure compared with the completely random solid solution.
11) There is a microdomain model assuming that short-range ordered domains are embedded in disordered matrix for the microstructure of alloys having short-range order.
22,23) Presence of the microdomains was supported by the combination of the Monte-Carlo simulation and the high-resolution TEM observations.
9)
It can be thought that the short-range ordered domains work as the scattering center of free electrons, and furthermore, the density of the scattering centers decreases by the plastic deformation. It is shown by a schematic diagram as shown in Fig. 7(a). In the present study, the short-range ordered domains are destroyed by the rolling so that the electrical resistivity decreases. It can be explained by the schematic diagram as shown in Fig. 7(b) that the short range ordered domains are destroyed by the repetition of cutting of dislocations introduced by plastic deformation, and finally disordering was achieved. It is noted that there was literature using short-range ordered phase in the past,24) but short-range ordered domains are used in the present study since the electrical resistivity measurement detects small domains working as scattering centers.

However, the electrical resistivity of Alloy 625 increases with the rolling reduction exceeding 70%. The reason why the electrical resistivity increases due to the cold rolling is associated with the increase in the density of the lattice defects, that was observed in the ARB processed pure metals.3–5,18–20) The increase in electrical resistivity measured at 77 K with the rolling reduction exceeding 70% is around 9.87 nΩm, which is comparable to the estimated value based on the change in the density of lattice defects. In other words, the increase in electrical resistivity with the rolling reduction exceeding 70% is caused since the effect of increase in dislocation density and the density of GB becomes larger than the decreases in electrical resistivity via the K-effect. The another possibility is that most of the short-range ordered domains are destroyed and the decrease in electrical resistivity via K-effect might be saturated with the rolling reduction up to around 70%. Nevertheless, the change in electrical resistivity of Alloy 625 with increasing the rolling reduction is not the same as the simple increase like pure metals. It was observed that the electrical resistivity firstly decreases, and then gradually increases with increasing the rolling reduction. Although it is similar to the reported case about Ni–Cr alloys, the reduction in electrical resistivity of Alloy 625 is found, which is also important since the presence of short-range ordered domains in the practical Ni base super alloy is confirmed.
3.3 Vickers hardness tests
Figure 8(a) shows the change in Vickers hardness with increasing the rolling reduction. With increasing the rolling reduction, Vickers hardness increases around 213 HV from 252 HV till 465 HV. It can be understood by the effect of grain refinement strengthening due to the reduction of GB separation observed by EBSD, in addition to the work hardening due to plastic deformation. For instance, there are some reports about pure Ni processed by cold work and the ARB process. They contain the discussion about the comparison of the yield stress σy which increases with progressing the grain subdivision determined by tensile tests and the estimated yield stress based on the grain size and dislocation density based on the microstructure observations.25,26) Similar analysis is performed for pure Al applied by the ARB process.27) In these studies, yield stress is estimated by using eq. (5) which is the summation of the Hall-Petch relationship28,29) and Taylor (Bailey-Hirsch)30–32) relationship.
| \begin{equation}
\sigma_{y} = \sigma_{0} + M\alpha G\sqrt{L_{\text{V}}} + k_{\text{HP}}d^{-1/2}
\end{equation}
| (5) |
Here, σ
0 is friction stress,
M is Taylor factor, α is a constant,
G is the shear modulus for pure Ni,
kHP is the Hall-Petch coefficient, and d is the grain size.
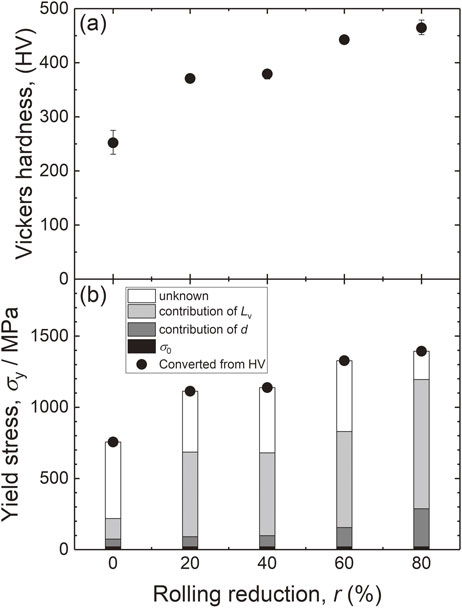
In the present study, only Vickers hardness is measured so that the yield stress σy obtained from tensile tests cannot be directly discussed. However, it is possible to discuss the yield stress with converting from Vickers hardness.33,34) It is assumed that the yield stress is three times of the Vickers hardness,33) and the discussion is proceeded that yield stress changes with increasing the rolling reduction as represented by filled circles in Fig. 8(b). Here, the values shown in Fig. 3 are used as grain size, and the values shown in Fig. 5 are used as dislocation density. It is noted that the dislocation density of 1 × 10¹⁴ m−2 at 0% is just a reference. The values, σ0 = 20 MPa, G = 79 GPa, M = 3.06, α = 0.24, kHP = 345 MPa µm0.5 are also used. The estimated values are shown as bars in Fig. 8(b). The black, the dark gray, the light gray, and the white bars are friction stress, contribution of GB (Hall-Petch relationship), contribution of dislocation (Taylor relationship), and the other. Although the white bar representing the contribution apart from the friction stress, GB, and dislocation occupies almost 95% of the yield stress converted from Vickers hardness with the rolling reduction at 0%, the white bar occupies 25%–35% of the yield stress with the rolling reduction between 20%–60%. Then, the contribution becomes almost 0% with the rolling reduction at 80%. The white bar should contain the contribution of solid solution strengthening since Alloy 625 is the solution strengthening type alloy. However, if white bar consists of only solid solution treatment strengthening, it should contribute to the yield strength regardless of the increase in the rolling reduction,19) and therefore, there might be other contributions apart from the solid solution strengthening.
It was pointed out that the short-range order strengthening exists in high entropy alloys (HEA) which consists of more than five elements with equal molar composition.35) Although Alloy 625 of which chemical composition shown by Table 1 cannot be treated as HEA, the fractions of contained multiple elements as alloying elements are relatively high, and furthermore, Alloy 625 contains short range ordered domains. Thus, the change of white bar in Fig. 8(b) with increasing the rolling reduction can be qualitatively explained, if short-range strengthening contributes to the strength. Specifically, the drastic decrease of white bar with the rolling reduction between 0% and 20% can be understood by either large stress is required to destroy the bonding of the short-range ordered domains at the first time, or the short-range ordered domains are drastically destroyed with the rolling reduction up to 20%. If the number density of short-range ordered domains continuously decreases with increasing the rolling reduction, the yield stress can be explained by almost only the contribution of dislocation and GB when rolling reduction at 80%, and there are no contradictions. Although the discussion about the separation of each contribution against the rolling reduction dependence on Vickers hardness of Alloy 625 is qualitative, there is a possibility that short-range ordered strengthening might relate to the strength in addition to the work hardening, grain refinement strengthening, and solid solution strengthening.
Lately, a XRD analysis method considering anisotropy of elasticity, the modified Williamson-Hall method,36) were proposed in order to evaluate the more accurate value of LV. In addition to them, Takaki et al. proposed a method (Direct-fitting method) which can easily correct the anisotropy of elasticity.37) However, careful treatment is requested to correlate with the mechanical properties since some new parameters, i.e. dislocation arrangement parameter, appears in addition to LV in some method. As a future issue, analysis using the yield strength evaluated using tensile tests in addition to the dislocation evaluation using above mentioned new methods is requested.
4. Conclusions
The change in electrical resistivity of Alloy 625 which is one of the Ni super alloys with progressing the cold rolling was revealed. Vickers hardness as one of the mechanical properties, dislocation density evaluated by XRD measurements, and the microstructure observations by EBSD measurements were investigated at each rolling reduction.
From the microstructure observations using EBSD measurements, the grain thickness was around 40 µm before rolling, but the mean separation of GB along normal direction decreased with increasing the rolling reduction, and finally reached down to around 2 µm. The microstructural change was similar to the typical rolling deformation. From the XRD measurements, dislocation density became around 3 × 10¹⁵ m−2 with the rolling reduction of 20% due to the rapid introduction of the dislocations via cold rolling, and then it remained almost constant with the rolling reduction up to 60%. Then, the dislocation density again increased with the rolling reduction of 80%. Electrical resistivity was measured at two temperatures; 77 K and 293 K, and the values measured at 293 K was always around 0.03 µΩm higher than those measured at 77 K due to the lattice vibration. The electrical resistivity measured at both temperatures were around 1.28 µΩm and 1.25 µΩm, respectively. Both values gradually decreased around 0.08 µΩm with increasing the rolling reduction up to 70%, and then increased around 0.01 µΩm. In the case of normal pure metals and dilute alloys, electrical resistivity increased around several nΩm with increasing the rolling reduction due to the introduction of lattice defects such as dislocations and grain boundary. On the other hand, the different behavior of electrical resistivity was observed in the case of Alloy 625 even though the increase in lattice defects density with increasing the rolling reduction was confirmed by the microstructure observations and the XRD measurements. It was attributed to the K-effect caused by the destroy of the short-range ordered domains which was reported in some alloys such as Ni–Cr alloys. Vickers hardness increased from 252 HV till 465 HV with increasing the rolling reduction, which highly-probably related to the short-range order strengthening in addition to the work hardening due to plastic deformation, grain refinement strengthening due to the reduction of the mean separation of GB observed by EBSD, and solid solution strengthening.
Acknowledgements
This study was financially supported by a Grand-in-aid for Scientific Research on Innovative Area (19H05168, 19K05056) through the Ministry of Education, Culture, Sports, Science and Technology (MEXT), Japan/Japan society of promotion of science, and the Kanazawa University frontier science and innovation cooperation young investigator grant. The authors would like to appreciate Prof. C. Watanabe at Kanazawa University for SEM/EBSD measurements.
REFERENCES
- 1) Y. Nakamura and Y. Koyanagi: Collected Abstracts of the 2021 Spring Meeting of the J. Inst. Metals No. 164 (Online PDF), (2021).
- 2) C. Kittel: Introduction to Solid State Physics, (Wiley, Hoboken, 2004).
- 3) Y. Miyajima, T. Shinohara, H. Adachi, T. Fujii, S. Onaka and M. Kato: Mater. Trans. 59 (2018) 393–398. doi:10.2320/matertrans.M2017298
- 4) Y. Miyajima, S.Y. Komatsu, M. Mitsuhara, S. Hata, H. Nakashima and N. Tsuji: Philos. Mag. 90 (2010) 4475–4488. doi:10.1080/14786435.2010.510453
- 5) Y. Miyajima, T. Ueda and T. Fujii: Mater. Trans. (2021), in press.
- 6) N. Tsuji: J. Jpn. Welding Soc. 74 (2005) 92–96. doi:10.2207/qjjws1943.74.92
- 7) Y. Miyajima, M. Uchiyama, H. Adachi, T. Fujii, S. Onaka and M. Kato: Mater. Trans. 57 (2016) 1411–1417. doi:10.2320/matertrans.MH201506
- 8) L. Barnard, G.A. Young, B. Swoboda, S. Choudhury, A. Van der Ven, D. Morgan and J.D. Tucker: Acta Mater. 81 (2014) 258–271. doi:10.1016/j.actamat.2014.08.017
- 9) K. Oki, S. Hata and N. Kuwano: Materia Japan 36 (1997) 862–865. doi:10.2320/materia.36.862
- 10) T. Nagashima: Bull. Jpn. Inst. Metals 3 (1964) 281–291. doi:10.2320/materia1962.3.281
- 11) M. Hirabayashi: Bull. Jpn. Inst. Metals 1 (1962) 753–762. doi:10.2320/materia1962.1.753
- 12) S. Kim, I.H. Kuk and J.S. Kim: Mater. Sci. Eng. A 279 (2000) 142–148. doi:10.1016/S0921-5093(99)00640-1
- 13) S. Komatsu and S. Fujikawa: J. JILM 47 (1997) 170–181. doi:10.2464/jilm.47.170
- 14) H.P. Klug and L.E. Alexander: X-ray Diffraction Procedures for Polycrystalline and Amorphous Materials 2nd edn, (A Wiley-Interscience Pub, New York, 1974).
- 15) G.K. Williamson and R.E. Smallman: Philos. Mag. 1 (1956) 34–46. doi:10.1080/14786435608238074
- 16) J.S. Koehler: Phys. Rev. B 2 (1970) 547–551. doi:10.1103/PhysRevB.2.547
- 17) P.S. Kotval and O.H. Nestor: Trans. Metall. Soc. AIME 245 (1969) 1275.
- 18) Y. Miyajima, T. Ueda, H. Adachi, T. Fujii, S. Onaka and M. Kato: IOP Conf. Ser. Mater. Sci. Eng. 63 (2014) 012138. doi:10.1088/1757-899X/63/1/012138
- 19) Y. Miyajima, H. Abe, T. Fujii, S. Onaka and M. Kato: Acta Mater. 61 (2013) 1537–1544. doi:10.1016/j.actamat.2012.11.031
- 20) Y. Miyajima, S. Okubo, H. Abe, H. Okumura, T. Fujii, S. Onaka and M. Kato: Mater. Charact. 104 (2015) 101–106. doi:10.1016/j.matchar.2015.04.009
- 21) A.S. Karolik and A.A. Luhvich: J. Phys. Condens. Matter 6 (1994) 873–886. doi:10.1088/0953-8984/6/4/007
- 22) S. Hashimoto: Acta Crystallogr. Sec. A 30 (1974) 792–798. doi:10.1107/S0567739474001884
- 23) S. Hashimoto: Bull. Jpn. Inst. Metals 16 (1977) 137–144. doi:10.2320/materia1962.16.137
- 24) S. Tomita: Bull. Jpn. Inst. Metals 27 (1963) 1–4. doi:10.2320/jinstmet1952.27.1_1
- 25) N. Hansen: Scr. Mater. 51 (2004) 801–806. doi:10.1016/j.scriptamat.2004.06.002
- 26) Y.B. Zhang, O.V. Mishin, N. Kamikawa, A. Godfrey, W. Liu and Q. Liu: Mater. Sci. Eng. A 576 (2013) 160–166. doi:10.1016/j.msea.2013.04.002
- 27) N. Kamikawa, X.X. Huang, N. Tsuji and N. Hansen: Acta Mater. 57 (2009) 4198–4208. doi:10.1016/j.actamat.2009.05.017
- 28) E.O. Hall: Proc. Phys. Soc. B 64 (1951) 747–753. doi:10.1088/0370-1301/64/9/303
- 29) N.J. Petch: J. Iron Steel Inst. 174 (1953) 25–28.
- 30) G.I. Taylor: Proc. R. Soc. London, Ser. A 145 (1934) 362–387. doi:10.1098/rspa.1934.0106
- 31) G.I. Taylor: J. Inst. Met. 62 (1938) 307–324.
- 32) J.E. Bailey and P.B. Hirsch: Philos. Mag. 5 (1960) 485–497. doi:10.1080/14786436008238300
- 33) J.T. Busby, M.C. Hash and G.S. Was: J. Nucl. Mater. 336 (2005) 267–278. doi:10.1016/j.jnucmat.2004.09.024
- 34) D. Tabor: Br. J. Appl. Phys. 7 (1956) 159–166. doi:10.1088/0508-3443/7/5/301
- 35) C.G. Schön: Scr. Mater. 196 (2021) 113754. doi:10.1016/j.scriptamat.2021.113754
- 36) T. Ungár and A. Borbély: Appl. Phys. Lett. 69 (1996) 3173–3175. doi:10.1063/1.117951
- 37) S. Takaki, T. Masumura and T. Tsuchiyama: Tetsu-to-Hagané 105 (2019) 648–654. doi:10.2355/tetsutohagane.TETSU-2018-167


