Materials Processing
Investigation of the Effect of Hydrogen Gas as Raw Material for DLC Film Preparation
2022 年 63 巻 3 号 p. 351-356

詳細
2022 年 63 巻 3 号 p. 351-356
For reducing the frictional losses on the sliding surfaces of mounting parts and improving the wear resistance in order to extend the life of the component, diamond-like carbon (DLC) film coating has been considered, in recent years. However, reduction of the long processing time involved is desirable for mass production. For achieving this, the effect of mixing hydrocarbon gas and hydrogen gas in the deposition process is compared, and the differences in the resulting DLC films are determined in this study. DLC films are deposited on Si wafers through radio frequency plasma chemical vapor deposition (RF-PECVD), with a mixture of methane gas and hydrogen (dilution gas) as the raw material. In addition, DLC films are prepared by mixing acetylene gas with hydrogen gas for comparison, and the effect of the hydrogen gas mixture on the deposition rate, composition, and hardness of the films is confirmed. When hydrogen gas is mixed with methane gas, the deposition rate increases with the increase in the ratio of hydrogen gas in the raw material, and the percentage of sp3 bonds increases; however, the hardness and elastic modulus decrease. Furthermore, the adhesiveness deteriorates with the increase in the hydrogen gas ratio.

In the case of methane gas mixed with hydrogen gas, the obtained deposition rate increases with the increase in the hydrogen gas mixing ratio, but no such change is observed in the case of acetylene gas.
Increasing the life of industrial components has been one of the most challenging issues, in recent years. Surface-to-surface contact of parts is one of the main factors in reducing the life of industrial components.1–3) To overcome this problem, diamond-like carbon (DLC) films with excellent hardness, good friction and wear properties, and biocompatibility have been actively studied over the past few years.4–9) Coating with DLC thin films possessing such properties, can extend the service life, and applications include tribology and aerospace.10,11)
DLC films are a type of amorphous carbon material with a mixture of sp3 and sp2 carbon bonding, the ratio of which influences the properties of the coating, such as the mechanical and optical characteristics.12–14) There are two methods for fabricating DLC films: chemical vapor deposition (CVD) using hydrocarbon gas or other raw materials, and physical vapor deposition (PVD) using solid carbon as a raw material.
DLC films with hydrogen can be fabricated through CVD, whereas hydrogen-free DLC films can be fabricated through PVD. DLC films do not exhibit good adhesion to soft substrates such as steel because of the high internal stress.15,16) However, this internal stress can be alleviated by adding hydrogen to the film.17) In addition, it has been demonstrated that hydrogen termination in hydrogenated DLC films plays a major role.18,19) These hydrogen terminations are gradually depleted under friction, increasing the friction coefficient. Moreover, the friction coefficient decreases with the increase in the hydrogen content of the DLC film. This is because the hydrogen terminations in the carbon network impart chemical stability to the network structure and lower the potential energy of the physisorption or chemisorption sites.20)
The deposition rate of methane gas, commonly used for film deposition, is not as high as that of acetylene or benzene. However, benzene requires a high bias voltage, and although acetylene is used for mechanical applications, its purity is not high; hence, it is not used in electronics.21) In view of the above, we attempted to increase the film deposition rate using methane gas through hydrogen withdrawal in the film by including hydrogen gas as a raw material.
In this study, in addition to the effect of hydrogen, the effect of the type of hydrocarbon gas on the structural changes and properties of the DLC coating on Si wafers through radio frequency plasma enhanced chemical vapor deposition (RF-PECVD) is investigated. The microstructural changes are investigated through Raman spectroscopy, X-ray photoelectron spectroscopy (XPS), and scanning electron microscopy (SEM). The main objective of this study is to compare and investigate the effect of mixing hydrocarbon gas and hydrogen gas for the high-speed deposition of DLC films, in order to determine the differences in the obtained DLC films.
Si(100) wafer (ϕ15.2 mm) or austenitic stainless steel SUS304 (ϕ25 mm) was used as the substrate on which the films were deposited through RF-PECVD (ACV-1060D, Shinko Seiki Co., Ltd., Japan). Table 1 lists the applied deposition conditions. In all the experiments, the flow rate of hydrocarbon gas was fixed at 50 mL min−1. Hydrocarbon gas and hydrogen gas were mixed at the respective flow rates, and used as the feedstock gas. The RF (13.56 MHz) output power was 800 W, and the furnace temperature was set to 443 K. Only during film deposition on SUS304, 0.05 µm Ti film was deposited as the intermediate layer through PVD. The deposition rate was determined based on the film thickness measured through SEM (JSM-6060LV, JEOL, Japan). Further, Raman spectroscopy (XploRA PLUS, HORIBA, Japan) was performed at a laser wavelength of 532 nm, and C1s was measured by XPS (PHI 5000, ULVAC-PHI, Japan). The optical properties were determined through spectroscopic ellipsometry (M-2000, J.A. Woollam Co., Inc., USA) at a wavelength range of 370–1000 nm, and incident angle of 75°. The hydrogen content was measured through glow discharge optical emission spectrometry (GD-OES) (GD-Profiler2, HORIBA, Ltd., Japan). After the above measurements, the film thickness was standardized to 300 nm, and the mechanical properties were examined through nanoindentation (ENT-2100, ELIONIX Inc., Japan). For all the samples, the load was set to 1.5 mN such that the indentation hardness was less than 1/10 the film thickness. Finally, the adhesiveness was evaluated using the Rockwell indentation test, which was performed only for the SUS304 sample. The indentations were observed under an optical microscope, and the state of peeling around each indentation was classified as HF1–HF6 according to the German standard VDI3198.22–24)

Figure 1 shows a SEM image of a typical DLC film from the CH4–H2 or C2H2–H2 series. The samples of the CH4–H2 and C2H2–H2 series shown in Fig. 1 were taken without hydrogen gas mixture. It was confirmed that the film was deposited from Fig. 1. Figure 2 shows the thickness of each DLC film determined through cross-sectional SEM measurements. The deposition rate is greater when acetylene gas is used as a raw material, compared to methane gas. Furthermore, when hydrogen gas is mixed with methane gas, the obtained deposition rate increases with the increase in the hydrogen gas mixing ratio; however, no such change is observed in the case of acetylene gas. As the flow rate of the hydrocarbon gas is not changed in either case, the change in the deposition rate may be due to the difference in the deposition process depending on the gas.

Typical SEM image of DLC film prepared by (a) methane gas and (b) acetylene gas.

Deposition rates of different gas mixtures with different ratio: (a) CH4–H2 series and (b) C2H2–H2 series.
In the deposition process using methane gas, active chemical species, such as CH3 radicals, are produced. When hydrogen gas is mixed, hydrogen etching is caused, and the hydrogen withdrawal reaction occurs. The large quantity of H atoms generated by the dissociation of H2 pull out the H atom from the CH4 molecule, promoting efficient dissociation. In addition, the extraction reaction of H atoms terminating the film surface occurs, which is considered to enhance the film growth rate.25,26) As depicted in Fig. 2(b), when acetylene gas is used, the deposition rate does not change even when the mixing ratio of hydrogen gas is increased. This is because acetylene gas has an additive reaction that does not require the formation of dangling bonds due to the withdrawal of hydrogen.27)
3.2 Binding ratio and hydrogen content in DLC filmsFigure 3 shows a typical Raman spectrum of a CH4–H2 series or C2H2–H2 series DLC film. The samples of CH4–H2 series and C2H2–H2 series shown in Fig. 3 were taken without hydrogen gas mixture. The four peaks include the D1 peak at approximately 1180 cm−1 corresponding to nanocrystalline diamond, the D2 peak at approximately 1350 cm−1 corresponding to microcrystalline or nanocrystalline graphite, the G1 peak near 1490 cm−1 associated with disordered graphite, and the G2 peak at 1580 cm−1 corresponding to ordered graphite.28) These peaks are characteristic of the DLC structure.28–30) The sum of the G1 and G2 peaks was used to estimate the intensity ratio of the D and G peaks (ID/IG), used for characterizing DLC films.31) The result obtained for ID/IG1+2 is shown in Fig. 4. Comparison of the intensity ratios indicate that ID/IG1+2 reduces with the increase in the hydrogen gas mixing ratio in the case of methane gas, and slightly smaller in the case of acetylene gas. It is suggested that the intensity ratio of the D peak to G peak decreases with the increase in the sp3 bond percentage.32) It can be observed that both methane and acetylene are converted to sp3. For the CH4–H2 series, hydrogen withdrawal could have occurred leading to the formation of a dangling bond, followed by adsorption of the precursor CH3 radical, and sp3 formation.33,34)

Typical Raman spectra and waveform separation of DLC film prepared by (a) methane gas and (b) acetylene gas.

ID/IG1+2 of DLC film obtained from the peak separation results of Raman spectra.
To predict the hydrogen content in the film from the Raman spectrum, the Raman scattering intensity at the G-peak position was calculated as S and the fluorescence component as N.35,36) The N/S ratio was calculated without peak separation and compared to the hydrogen content determined through GD-OES. Figure 5 depicts the N and S diagrams, whereas Fig. 6 shows the N/S ratio and the hydrogen content determined through GD-OES. As shown in Fig. 6(a), for the CH4–H2 series, N/S obtained from the Raman spectra and through GD-OES show different trends for the hydrogen content. However, for the C2H2–H2 series, N/S and GD-OES exhibit similar trends, and N/S and the hydrogen content decrease with the increase in the hydrogen gas mixing ratio. With respect to the hydrogen content in the film, the hydrogen mixture in the CH4–H2 series is consistent with that predicted through Raman spectroscopy and GD-OES measurements up to 25 mL min−1, but not beyond 50 mL min−1. This is probably due to sedimentation. The deposition of DLC films is a competitive process between deposition and hydrogen etching.37) Therefore, when the hydrogen mixture is less than 50 mL min−1, the process of deposition on the dangling bonds generated through hydrogen etching is favored more; hence, many hydrogen atoms are in a bonded state, and the N/S and GD-OES trends are consistent. However, when the hydrogen mixture is more than 50 mL min−1, the hydrogen gas generated through hydrogen etching does not escape from the film but is adsorbed, and the hydrogen not bound to the film is not detected through Raman spectroscopy.38–40) For the C2H2–H2 series, the hydrogen content and ID/IG1+2 decrease with the increase in the hydrogen mixture, as shown in Figs. 4 and 6(b), suggesting the occurrence of hydrogen etching by the hydrogen radicals, and in addition to the withdrawal of hydrogen from the film, the carbon in sp2 is etched and partially converted to sp3.41)

Example of Raman spectrum of DLC film.

N/S obtained from Raman spectra and amount of hydrogen in the film obtained from GD-OES: (a) CH4–H2 series and (b) C2H2–H2 series.
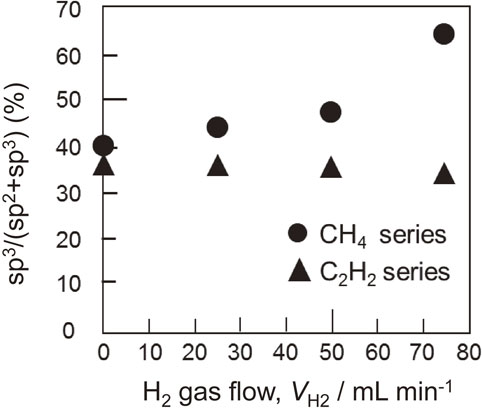
XPS was used to analyze the elemental composition of the DLC film surface. Figure 7 depicts the C 1s spectrum of a typical DLC film and the peak separation results. Peak separation occurs at 284.4 ± 0.05 eV for sp2 binding, 285.3 ± 0.05 eV for sp3 binding, and the remaining CO-contaminated. In the CH4–H2 series, the C 1s band shifts toward the high binding-energy side. The binding ratio obtained through peak separation is depicted in Fig. 8. For the CH4–H2 series, the sp3 bonds increase with the increase in the hydrogen gas ratio, whereas the change in the C2H2–H2 series is negligible. This result is consistent with the Raman spectroscopy prediction (Fig. 4).

Typical C 1s spectra and waveform separation of DLC film.
Binding ratio of each DLC film.
Figure 9 displays the optical constants (refractive index n and extinction coefficient k) of each DLC film at a wavelength of 550 nm, measured through spectroscopic ellipsometry. It can be observed that the extinction coefficients of the CH4–H2 as well as C2H2–H2 series decrease as the hydrogen gas mixing ratio increases, with the CH4–H2 series showing a smaller extinction coefficient. In the CH4–H2 series, the hydrogen content and sp3 bonds increase, suggesting that the CH3 radical is adsorbed on the dangling bond generated by hydrogen withdrawal. As a result, the refractive index and extinction coefficient are likely to be smaller as shown in Fig. 9(a).33,34) For the C2H2–H2 series, the Raman and GD-OES results shown in Figs. 4 and 6(b) indicate a decrease in the hydrogen content and the formation of a few sp3 bonds. In the DLC film deposited through PECVD, sp2 bond clusters are formed in the sp3 network, indicating the occurrence of hydrogen etching due to which sp2 C=C is etched, resulting in minor sp3 and hydrogen extraction from the film. Hydrogen etching may cause the partial conversion of sp2 C=C to sp3, suggesting hydrogen withdrawal from the film.38,42,43) The refractive index and extinction coefficient are reduced because of the etching of sp2 C=C.39,43)

Optical constants of each DLC film at 550 nm wavelength: (a) CH4–H2 series and (b) C2H2–H2 series.
Nanoindentation and Rockwell indentation tests were performed to evaluate the mechanical properties and adhesion, respectively, of the DLC films. Table 2 lists the nanoindentation results of each DLC film, and Fig. 10 shows the Rockwell indentation test results. The nanoindentation test indicates that the mechanical properties of the films obtained using the methane gas and acetylene gas are different. In the CH4–H2 series, the indentation hardness (HIT) and indentation Young’s modulus (EIT) decrease with the increase in the hydrogen gas mixture ratio, whereas no change is observed in the C2H2–H2 series. It is likely that the CH4–H2 series includes more adsorbed CH3 radicals and more hydrogen terminations, breaking the bond and reducing the indentation hardness (HIT) and Young’s modulus (EIT). As such radicals are not adsorbed in the C2H2–H2 series, it remains unaffected. Nanoindentation testing, which can be used for material evaluation, was utilized to determine H3/E2, which indicates the resistance to plastic deformation.44–47) The CH4–H2 series shows lower values than any of the C2H2 conditions. Among the CH4–H2 series, under a H2 gas flow rate of 75 mL min−1, the lowest value is exhibited. Based on the evaluation after the Rockwell indentation test, it is concluded that the conditions for the C2H2–H2 series are better than those of the CH4–H2 series because the HF values obtained for the C2H2–H2 series samples are lower than those of the CH4–H2 series. In the CH4–H2 series, the delamination area is maximum under a H2 gas flow rate of 75 mL min−1. This is in agreement with the results predicted from the H3/E2 values shown in Table 2. In addition, the C2H2–H2 series with high H3/E2 values show better adhesion than the CH4–H2 series with low H3/E2 values. This can be attributed to the increase in hydrogen content in the DLC film and the decrease in density due to the dangling bonds, as predicted by the hydrogen content measurements through Raman spectroscopy and GD-OES (Fig. 6) and the refractive index (Fig. 9).


Optical microscope images of each DLC film after Rockwell indentation test: (a) CH4–H2 series and (b) C2H2–H2 series.
To achieve high-speed DLC film deposition, this study compared the effect of mixing hydrocarbon gas and hydrogen gas in the deposition process, and the differences in the resulting DLC films. It was determined that the effect of hydrogen gas as a raw material depended on the type of hydrocarbon gas. In addition, when CH4 gas was mixed with H2 gas, the deposition rate as well as the percentage of sp3 bonds increased, whereas the hardness and the other properties were reduced; depending on the conditions, the adhesiveness was significantly affected. In the case of C2H2 gas, it was determined that the film could be deposited without considerable influence by H2 gas.
We would like to express our deepest gratitude to Mr. Satoru Hattori in the Kyoto Prefectural Technology Center for Small and Medium Enterprises for his cooperation in the nanoindentation test, to Prof. Hiromitsu Kozuka in the Department of Chemistry and Materials Engineering, Kansai University, for his cooperation in spectroscopic ellipsometry, and to Prof. Hiroshi Tani in the Department of Mechanical Engineering, Kansai University, for his cooperation in Raman spectroscopy analysis.