1. Introduction
The high manganese steel (HMnS) consists of 10 manganese wt% on average that extends the austenite region, it consequently guarantees the stable austenite microstructure at room temperature. The HMnS (in the FCC) had known with high toughness, low hardness. However, the deformation mechanism in high pressure and impacted load working conditions will enhance plasticity and high strength. As a result, the high hardness and abrasion resistance of the surface and maintains toughness of the core can be obtained in this steel. This phenomenon is called “work-hardening”.1–4) The phenomenon “durable deformation” was explained by the plastic deformation mechanism and the transformation of austenite in the durable chemical process.5–8) For a long time, the hard-working mechanism of the HMnS was explained by austenite to martensite transformation under impact load. However, in recent years, many researchers found that martensite transformation was not the main cause to increase the hardness value of this steel. The steel containing about 13% manganese and 1% carbon is known for stable austenite phase and the martensitic transformation was not observed in the room temperature or only occurs at temperatures of −196°C.9) Besides, the hard-working mechanism by twin or crystal lattice dislocations were also noticed.10)
Under the influence of the impact load, the crystal of structure can be deformed and remained. As a result, the crystal can be broken or twin or slide dislocations. The deformation of metals is easier than others (ductility). Under the same conditions, metals with a face-centered cubic (FCC) are more flexible than body-centered cubic (BCC).1–3,11–14) The high strength in the austenitic high manganese alloy relates to the grain size of the austenite phases. The microstructure with small grain size after alloying and heat treatment enhanced the hard-working of the steel. The misorientation particles in polycrystalline metal, different particles with different crystalline orientations produce grain boundaries. Grain profile can be considered as the inverse of particle size which has a great influence on mechanical properties. When the metal is deformed, the grain boundary movement will hinder the movement of the deflection, so increasing the grain boundary density is also a measure of durability.12,13,15–19) However, the important factor is the austenite microstructure changes after deformation process that will create a stacking fault. When the HMnS is subjected to impact loads, the lattice of austenite is buckled and appears the stacking fault. The stacking fault carries an amount of energy called the stacking fault energy (SFE). The value of this one was effected by many factors but the composition of steel is the most important.20,21)
The results of Ref. 22) and some researchers have demonstrated that SFE plays an important role in loading, deformation, twining or ε - martensite phases formation. The ε - martensite phase was only formed when SFE was less than 18 mJ/m2 that facilitation on transforming from FCC to HCP; whereas the twin was created when SFE ranged from 18 to 35 mJ/m2 and the dislocation (dislocation-dislocation interaction) is created when the SFE was larger than 35 mJ/m2. Thus, the elements that decrease the SFE will reduce the stability of austenite and enhance γ (anti-ferromagnetic) → ε (paramagnetic) transformation conditions.20) S.B. Sant, R.W. Smith23) found the twin microstructure and without martensite in the steel after deformation by using TEM. TEM image shows the twin bands on the surface of the sample that means the austenite to martensite transformation not occurred in this case. The plastically deformed surface was the result of twin deformation and a stack fault.10,24) The abrasion resistance of HMnS increased significantly corresponding with the high impacted energy and this result was related to the microstructure changing during impaction test. The interaction of the twin deformation and the stacking fault and crystal lattice dislocations led the formation of nanostructure austenitic phase that to be embedded into the amorphous structure.4,15,16,25–27)
The deformation of the sample surface, accumulated energy and crystal lattice dislocations were observed during impaction test. The nanostructures were formed by the concentration of dislocation, the interaction between the twins and the development of microstructure. The inhomogeneous nanostructures at the grain boundary enhanced the strengthening of the material. The nanostructures transformed into the amorphous structure under increasing impact force continuously conditions. This phenomenon played an important role in improving the mechanical properties and abrasion resistance of the high manganese austenite steel.5,28) The austenitic nanoparticles were important factors to enhance the strength of the austenitic high manganese steel.
In this paper, the microstructure changes at the surface of HMnS under 3,000 and 10,000 impacted times are investigated.
2. Experimental Procedure
The samples were prepared by melting in an induction furnace, modified by FeV, then poured into a sand mold with D = 30 mm and L = 250 mm. The details chemical composition of samples is given in Table 1.
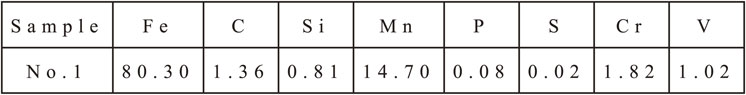
Table 1 The chemical composition of the sample.
The samples were cut out from the ingot and then heat treated with the following process: heating up to 650°C, holding for 2 hours and then air-cooling; after that, the samples were re-heated up to 1100°C, holding for 2 hours and then water-cooling. This steel was heated at a temperature that is less than the austenitic temperature (about 650°C) for the purpose of forming secondary carbides. At this temperature, the diffusion of carbon and alloying elements of the alloy steel is limited. The atoms only move in short segments, so the carbides will be small in grain size. After, this steel was heated above 1000°C, the microstructure of this steel was homogeneous.
After heat treatment, the samples with a homogeneous austenitic microstructure were impacted with a specific load to determine the hard-working mechanism.
A mass of 10 kg is dropped freely at a height of h (m) onto a specimen with a diameter of 20 mm. The impact toughness value of this steel is 115 J/cm2.
We have:
| \begin{equation}
A = a_{k} \times F = 1150 \times 8 = 92\ (\text{J})
\end{equation}
| (1) |
The cross-section of the specimen at the impact test site is F = 0.8 cm2.
We have Aelastic limit:
| \begin{equation*}
A^{\textit{elastic limit}} = 55.2\ (\text{J})
\end{equation*}
|
The force applied to the specimen to cause elastic deformation is:
| \begin{align}
A^{dh} = F \times \Delta l \to F &= A^{dh}/\Delta l = 55.2/(0.04 \times 10^{-2}) \\
&= 138.000\ (\text{N})
\end{align}
| (2) |
The amount of elastic deformation of the sample is 0.2%. The length of the tensile test piece is 20 cm. So Δl = 0.04 cm.
The stress acting on a unit area is:
| \begin{align}
\sigma &= F/S = 138.000/(3.14 \times 10^{-4}) \\
&= 43949 \times 10^{4} \left(\frac{N}{m^{2}}\right) = 439.5\ (\text{MPa})
\end{align}
| (3) |
Thus, the potential energy of the weight acting on the sample must be greater than the elastic value that the sample has. The height required to drop the weight on the sample is:
| \begin{equation}
A^{\textit{elastic limit}} \leq m \times g \times h \to h \geq 0.552\ (\text{m}) = 55.2\ (\text{cm})
\end{equation}
| (4) |
The selected load fell from the height of 65 cm to the modified samples without breaking. The number of impacts was 3,000 times and 10,000 times. The tests were performed on a ballast machine to determine the relationship between the number of impacts and the microstructure of the high manganese austenitic steel.
The optical microscope (Axiovert 25), X-Ray, FESEM (Jeol 7600), and TEM (JEM1400) were used to analyze the surface microstructure changes before and after impacted tests.
3. Results and Discussions
3.1 Stacking fault energy (SFE) results
Based on the fact that a single stacking fault can be viewed as two layers of HCP structure, Olson and Cohen29) proposed that the SFE in face-centered cubic (FCC) steels can be expressed as in eq. (5):
| \begin{equation}
\mathrm{SFE} = 2\rho \Delta \text{G}^{\gamma \to \varepsilon} + 2\sigma^{\gamma/\varepsilon}
\end{equation}
| (5) |
where ρ is the molar surface density along {111} planes, which is related to lattice parameter
a. Δ
Gγ→ε is the free energy for the γ-ε transformation, and σ
γ/ε interfacial energy per unit area of γ and ε phases boundary.
To calculate the SFE, we used the chemical composition of the samples to calculate the molar fraction of each element Xi, as shown in eq. (6):
| \begin{equation}
X_{i} = \frac{n_{i}}{\displaystyle\sum n}\ \text{and}\ n_{i} = \frac{\text{wt}\%_{i}}{M_{i}}
\end{equation}
| (6) |
where
wt%
i is the weight percent,
Mi is the molar mass and
ni is the amount of each element in the mole. The calculation results are shown in
Table 2.
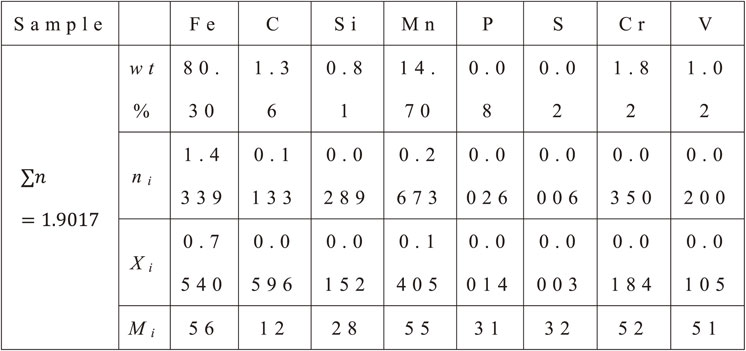
Table 2 The calculation results of Xi.
The molar surface density ρ is calculated after Allain et al.30) as follows eq. (7):
| \begin{equation}
\rho = \frac{4}{\sqrt{3}}\frac{1}{a^{2}N}
\end{equation}
| (7) |
where a is the lattice parameter of the alloy and
N is Avogadro’s number.
The lattice parameter of austenite is calculated through the composition-dependent equation by Babu et al.31) as follows eq. (8):
| \begin{align}
a_{\textit{FCC}} &= 3.5780 + 0.033X_{C} + 0.00095X_{\textit{Mn}} \\
&\quad + 0.0006X_{\textit{Cr}}\ 0.0018X_{V}
\end{align}
| (8) |
where
Xi is the molar fraction of the elements
i in the system, and
aFCC is the lattice parameter of the alloy in
A.
The temperature dependency of the lattice parameter is given by the following eq. (9):32,33)
| \begin{equation}
a_{\gamma} = a_{\gamma 0} [1 + \beta_{\gamma}(T - 300)]
\end{equation}
| (9) |
where
aγ0 is equal to
aFCC from
eq. (8); β
γ is linear thermal expansion coefficient of austenite is equal to 2.065 × 10
−9 K
−1 and
T is the temperature in Kelvin. The calculation results of ρ are shown in
Table 3.
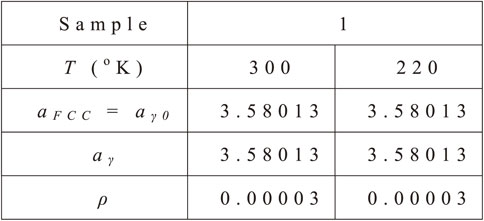
Table 3 The calculation results of ρ.
Based on the regular solution model, ΔGγ→ε, can be calculated using the following eq. (10):
| \begin{equation}
\Delta G^{\gamma \to \varepsilon} = \Delta G_{\textit{che}}^{\gamma \to \varepsilon} + \Delta G_{\textit{mg}}^{\gamma \to \varepsilon} + \Delta G_{\textit{seg}}^{\gamma \to \varepsilon}
\end{equation}
| (10) |
where
$\Delta G_{\textit{che}}^{\gamma \to \varepsilon }$,
$\Delta G_{\textit{mg}}^{\gamma \to \varepsilon }$ and
$\Delta G_{\textit{seg}}^{\gamma \to \varepsilon }$ are the molar thermochemical free energy difference, magnetic free energy difference and the free energy difference due to the Suzuki effect between γ and ε, respectively.
$\Delta G_{\textit{seg}}^{\gamma \to \varepsilon }$ is neglected here since its value is very low.
According to Yang and Wan,34) in the Fe–Mn–C system, the free energy for the γ → ε phase transformation, $\Delta G_{\textit{che}}^{\gamma \to \varepsilon }$, is calculated by the regular solution model, as follows eq. (11):
| \begin{align}
\Delta G_{\textit{che}}^{\gamma \to \varepsilon} &= X_{\textit{Fe}}\Delta G_{\textit{Fe}}^{\gamma \to \varepsilon} + X_{\textit{Mn}}\Delta G_{\textit{Mn}}^{\gamma \to \varepsilon} + X_{C}\Delta G_{C}^{\gamma \to \varepsilon} \\
&\quad + X_{\textit{Fe}}X_{\textit{Mn}}\Delta \varOmega_{\textit{FeMn}}^{\gamma \to \varepsilon} + X_{\textit{Fe}}X_{C}\Delta \varOmega_{\textit{FeC}}^{\gamma \to \varepsilon} \\
&\quad + X_{\textit{Mn}}X_{C}\Delta \varOmega_{\textit{MnC}}^{\gamma \to \varepsilon}
\end{align}
| (11) |
where
Xi and
$\Delta G_{i}^{\gamma \to \varepsilon }\boldsymbol{ }$ show the molar fraction and free energy change, respectively, due to HCP martensite formation from FCC austenite in pure metals. The
$\Delta \varOmega_{ij}^{\gamma \to \varepsilon }$ is the interaction energy between the components
i and
j.
The values of the thermodynamic parameters of eq. (11) were extracted from the works of Saeed-Akbari, J. Imlau, U. Prahl, and W. Bleck,26) are given as follow from eq. (12) to eq. (19):
| \begin{equation}
\Delta G_{\textit{Fe}}^{\gamma \to \varepsilon} = -950.68
\end{equation}
| (12) |
| \begin{equation}
\Delta G_{\textit{Mn}}^{\gamma \to \varepsilon} = -663.1
\end{equation}
| (13) |
| \begin{equation}
\Delta G_{C}^{\gamma \to \varepsilon} = -22166
\end{equation}
| (14) |
| \begin{equation}
\Delta G_{\textit{Si}}^{\gamma \to \varepsilon} = -2960.0
\end{equation}
| (15) |
| \begin{equation}
\Delta \Omega_{\textit{FeMn}}^{\gamma \to \varepsilon} = 2873 - 717 (X_{\textit{Fe}} - X_{\textit{Mn}})
\end{equation}
| (16) |
| \begin{equation}
\Delta \Omega_{\textit{FeSi}}^{\gamma \to \varepsilon} = 2850 + 3520 (X_{\textit{Fe}} - X_{\textit{Si}})
\end{equation}
| (17) |
| \begin{equation}
\Delta \Omega_{\textit{FeC}}^{\gamma \to \varepsilon} = 42500
\end{equation}
| (18) |
| \begin{equation}
\Delta \Omega_{\textit{MnC}}^{\gamma \to \varepsilon} = 26910
\end{equation}
| (19) |
where
T is the temperature in Kelvin,
$\Delta G_{i}^{\gamma \to \varepsilon }$ and
$\Delta \varOmega_{ij}^{\gamma \to \varepsilon }$ is in J/mol.
The $\Delta G_{\textit{mg}}^{\gamma \to \varepsilon }$ in eq. (10) is the variation in the magnetic contribution of the austenite and martensite phases due to the paramagnetic to antiferromagnetic transition, calculated according to the diagram in Fig. 1.
Based on the calculation results of $\Delta G_{\textit{che}}^{\gamma \to \varepsilon }$ and $\Delta G_{\textit{mg}}^{\gamma \to \varepsilon }$ from Table 4 and 5, the ΔGγ→ε can be calculated by the eq. (10). The calculation results are shown in Table 6.
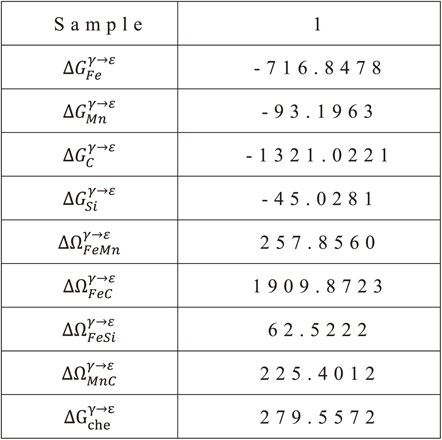
Table 4 The calculation results of $\Delta \text{G}_{\text{che}}^{\gamma \to \varepsilon }$.

Table 5 The calculation results of $\Delta \text{G}_{\text{mg}}^{\gamma \to \varepsilon }$.
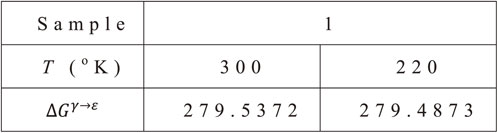
Table 6 The calculation results of ΔGγ→ε.
As for transition metal, the value of σγ/ε is usually taken as 9 mJ/m2. So, from the calculation results from ρ (Table 3), ΔGγ→ε (Table 6), we can calculate the SFE of samples by eq. (5).
Table 7 shows the calculation results of SFE for sample 1 after the heat treatment process and after the sub-zero treatment process. We can see that the values of both samples at two different temperatures are almost equal. The value of sample 1 is 34 mJ/m2. However, with this stacking fault energy, the γ → ε transformation could not occur in these samples. With the results of this calculation, both samples can only happen twinning movement or sliding strip. When carbon steel is greater than 1% of energy in the region, disabilities of 20–30 mJ/m2 or greater, the hardening of steel will be the twinning mechanism or sliding strip. Carbon steel with less than 1% defects has a lower energy content of 18 mJ/m2 and can be transformed to martensite ε. With the sub-zero temperature at −80°C, the SFE’s results are almost unchanged. This is evidenced by the results of microstructure and hardness tests.
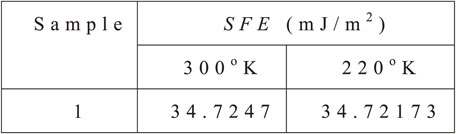
Table 7 Stacking Fault Energy calculation results of samples.
The austenite grain size and carbide distribution effect on the properties of steel. Figure 2 shows the austenite phase that expanded at room temperature and the carbide precipitation from the melted metal and carbide in the cooling process in the casting mold or in the air after casting. The carbide sizes after casting are usually larger than others. According to ASTM, the austenite grain size was level 5 on 3,910 µm2 average.
The carbide distribution and the carbide fraction are shown in Fig. 3(a), Fig. 3(b) respectively. The observation of the high fraction of the coarse carbide grain and some pearlite phase in the grain boundaries led to brittle destruction during working. Therefore, it is necessary to have an appropriate treatment process to dissolve the carbides at the grain boundaries to create a relatively homogeneous austenite distribution, increase the impact resistance, and replace the traditional heat treatment processes.
3.2.2 Microstructure after heat treatment
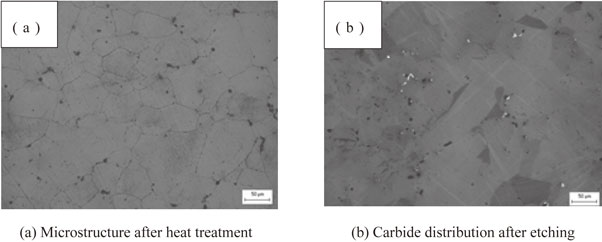
Figure 4 shows that carbide was not concentrated at the grain boundary. After heat treatment, the scattered carbides on the austenite phase indicated that a small V-carbide type was dispersed and remained on the surface of the sample.
The carbide fraction after heat treatment is presented in Fig. 5 and Table 8.

Table 8 The carbide fraction after heat treatment.
The analyzed results for sample 1 after the heat treatment process show that the carbide fraction that remains after treatment at 650°C for 2 hours and then continued heating to 1100°C in 2 hours was 0.35% compared to 6.12% after casting. Moreover, the small carbide grains were dispersed in the austenite matrix that replaced the coarse carbide grains in the boundaries.
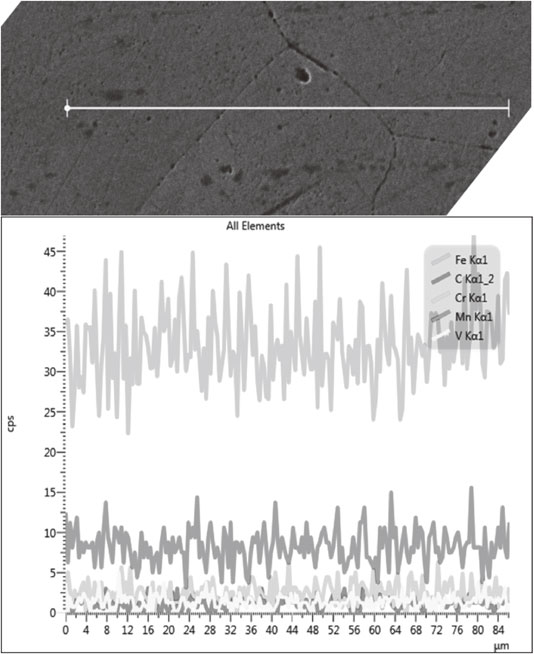
Figure 6 shows the homogeneous austenite phases were on the surface without carbides. This may mean the carbide particles were too small in grain size that can be not seen by X-ray analysis. This judgment has been proven by the following micro-analysis methods.
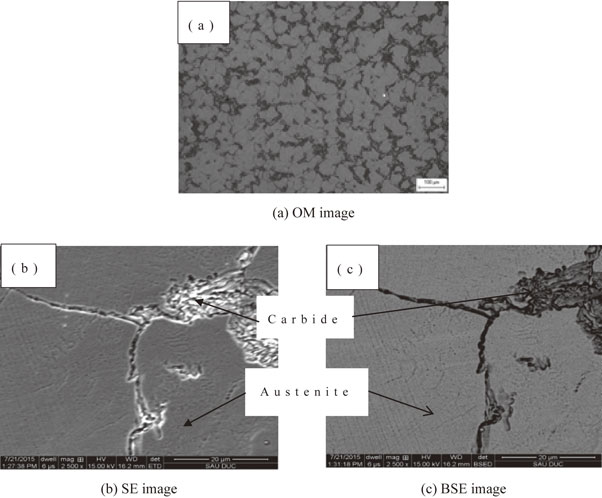
By SEM (Fig. 7(a)), BSE (Fig. 7(b)) and EDS lines (Fig. 8), after heat treatment, the microstructure was homogeneous. With these methods, do not see carbide which has small grain size and is distributed in the microstructure. If there weren’t carbide on the boundary, the impact value would be increased.
As can be seen in Fig. 9, the black fine particles are distributed on the austenite matrix at a magnification of 150.000 times. The V and Cr contents of the ones were higher than the matrix. By considering the correlation between the total number of alloying elements and carbon, the fine particles were the carbides.
By TEM image analysis, the nano-sized square carbide particles (40 nm) that were dispersed on the austenite matrix were VC carbides on the austenite matrix (Fig. 10).
The presence of nanosized particles in the matrix is related to the high values of hardness and toughness after the heat treatment process and hardworking under impact load.
3.3 Microstructure of the steel after impact test
By comparison Fig. 11, the peaks moved when the number of impacts increased. However, the gap between the peaks is very small, which means the austenite matrix was still stable in this case. The displacement may be due to the presence of twins or slide defects.
If the number of the impact was 3,000 times, this movement is very little or does not seem to have any movement. When the increase is 10,000 times, this movement takes place stronger. This can be explained by the increase in the number of times the surface structure of the steel has changed.
The microstructure before the impact test was homogeneous austenite phases. However, when the number of impacts was 3,000 times, the nanosize particle appeared on the surface of the sample; moreover, the twin sliding could be seen too.
After heat treatment and impact tests, there were twin bands without martensite. In samples containing V alloy, the twin bands were more clearly and sharper. It can be concluded that in the samples containing V through 3,000 impacts, martensite transformation did not occur. The increasing of hardness values due to mechanical hardening by twin and shear resistance of carbide particles distributed in the austenite matrix (Fig. 12).
Figure 12 shows that the slides that are not blocked by carbides will be parallel sliding bands. In contrast, the sliding bands were deformed and concentrated on the carbide boundaries.
The result of the analysis of the sample after 10,000 impacts showed the appearance of an amorphous structure on the surface layer of steel (Fig. 13). Thus, it can be seen that the increase in the number of impact loads changed the structure of this steel.