Abstract
Duplex stainless steel (DSS) can be used in harsh environments owing to its excellent strength and corrosion resistance. However, the sigma (σ) phase, which reduces the corrosion resistance, precipitates during manufacturing. To elucidate the deterioration mechanism of corrosion resistance, we prepared three types of DSS (F55) with different volume fractions of the σ phase. Polarization curves were measured to investigate the corrosion characteristics. The corrosion rate and corrosion potential (Ecorr) were evaluated using Tafel extrapolation. Owing to the precipitation of the σ phase, Ecorr was low, and the corrosion rate was high, which indicates that the σ phase precipitation promotes the anodic reaction. An electricity damage corrosion test at a constant quantity of electricity was conducted on the sample, which was heat-treated at 1173 K and had the largest amount of σ phase precipitation. The X-ray diffraction results before and after the corrosion test showed that the alpha (α) phase was reduced by corrosion. In addition, the results of optical micrographs and electron probe microanalysis maps confirmed that the σ phase was precipitated in the α phase. This indicates that the precipitation of the σ phase increases the corrosion rate of the surrounding α phase. Therefore, the precipitation of the σ phase, which is harmful to DSSs, deteriorates the corrosion resistance because the periphery of the σ phase is easily corroded.
1. Introduction
Duplex stainless steel (DSS) is composed of an α-ferrite phase and a γ-austenite phase and can be used in harsh environments because of its excellent corrosion resistance and mechanical properties. Therefore, it has been used as a structural material in power generation equipment, petrochemical industries, and marine construction.1,2) Generally, the pitting resistance equivalent (PREN) is used to evaluate the pitting corrosion resistance of DSS, and can be calculated by the following equation:3,4)
| \begin{equation}
\mathrm{PREN} = \text{mass% Cr} + \text{3.3$\,$mass% Mo} + \text{16$\,$mass% N}
\end{equation}
| (1) |
The F55 alloy, designed with an emphasis on corrosion resistance, is a super DSS with a PREN of 41. However, during the manufacturing process of this material, the σ phase is precipitated in the metal structure. Precipitates of the σ phase form because of a low cooling rate due to the mass effect in the internal ingot, in the temperature range of 873–1273 K. It is accepted that the σ phase has an adverse effect on the corrosion resistance,5–10) but the detailed deterioration mechanism of corrosion resistance has not been elucidated. To clarify the effect of the σ phase on the corrosion behavior of DSS, three types of F55, with different volume fractions of the σ phase, were used. The extent of the surface corrosion was inspected and analyzed by X-ray diffraction (XRD) before and after the corrosion test. In addition, to investigate the effect of the σ phase on the elemental distribution, element mapping of each sample was performed using electron probe microanalysis (EPMA).
2. Experimental Procedure
2.1 Process and materials
Three types of F55 materials, heat treated under different conditions, were prepared to evaluate the influence of the volume fraction of the σ phase. Table 1 shows the chemical composition of F55. The amount of σ phase precipitation was controlled by heat treatment. The three test samples were annealed at 1173 K, 1273 K, and 1373 K, respectively, for 1.5 hours and then water quenched. The size of test samples was 30 mm × 30 mm × 200 mm, small enough to ignore the difference in cooling rate between the surface and the inside. The samples were cut to 20 mm × 15 mm × 3 mm and used in the experiment. The samples were mechanically ground with silicon carbide paper (from 80 grit down to 2000 grit), then buffed to a mirror surface and etched, using an etching solution of 20 g potassium ferricyanide, 20 g of NaOH, and 70 ml of de-ionized water.

Table 1 Chemical composition of super DSS F55 (mass%).
An anode polarization test was performed to investigate the effect of the σ phase on the corrosion properties. The electro-chemical cell was a conventional three-electrode cell comprising the sample, a reference electrode (silver/silver chloride, 3.33 M KCl), and a platinum counter electrode. A mixture of 2.5 M H2SO4 and 0.2 M NaCl was used as the test solution. A dynamic potential polarization test was performed by scanning from −700 mV to 1300 mV at a scan rate of 0.5 mV·s−1.
Next, an electricity damage corrosion test was conducted with a constant quantity of electricity using the sample with the highest amount of σ phase, which was heat-treated at 1173 K, to observe the form of corrosion of DSS. As pretreatment the sample was passivated to investigate the region where the passivation film is not stable. The treated sample was maintained at 0.4 V for 1 hour in a 0.5 M H2SO4 solution. After the passivation treatment, the potential was maintained at 0.6 V and 250 C/cm2 in a 2.0 M NaCl solution. The above experiment was performed using a computer-controlled potentiostat [BioLogic, SP-150]. The heat-treated sample was analyzed using XRD [RIGAKU RINT-2200] before and after an electricity damage test at a constant quantity. Elemental mapping of each sample before the constant quantity of electricity damage was measured using EPMA [JEOL, JXA-8230].
3. Results and Discussions
Figure 1 shows the microstructures of each sample. No σ phase was detected in the sample heat-treated at 1373 K. In the sample heat-treated at 1273 K, precipitation of the σ phase was observed at the interface between the α-ferrite phase and the γ-austenite phase. In the sample heat-treated at 1173 K, the precipitation of the σ phase was also observed inside the α phase. The volume fraction of the σ phase was calculated from the scanning electron microscope (SEM) image of each sample. The amount of σ phase precipitation decreased as the temperature increased. At the heat treatment temperature of 1173 K, the σ phase was 30.1%, at 1273 K, it was 7.8%, and at 1373 K, it was 0%. XRD and EPMA confirmed that the precipitates of the sample heat-treated at 1173 K and 1273 K were in the σ phase. Details of the XRD pattern and EPMA map results are described later. Figure 2 shows the anode polarization curves of the three types of F55 samples at different heat treatment temperatures. Although there is no significant difference in the shape of the polarization curve, the sample heat-treated at 1173 K showed a slightly higher current density. From the polarization curve, Ecorr of each sample was −0.32 V at 1173 K, −0.31 V at 1273 K, and −0.30 V at 1373 K. The corrosion current density Icorr of each sample, obtained by Tafel extrapolation was 1.12 A·m−2 at 1173 K, 1.04 A·m−2 at 1273 K, and 0.77 A·m−2 at 1373 K. The larger the amount of the σ phase, the lower Ecorr and the higher the corrosion rate, which confirmed that the σ phase precipitation promoted the anodic reaction and deteriorated the corrosion resistance.

Figure 3 shows the optical micrograph of F55, heat-treated at 1173 K, after a constant potential polarization test. It was observed that the α phase was preferentially dissolved, and the σ phase remained suspended.
Figure 4 shows the XRD pattern before and after the constant potential polarization test of a sample with a heat treatment temperature of 1173 K. After the polarization test, the amount of σ phase increased and the amount of α phase decreased, indicating that the α phase was preferentially dissolved and the σ phase remained.

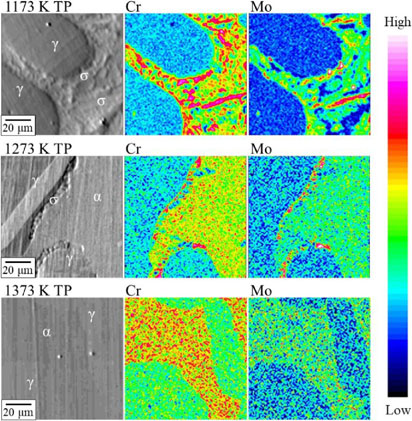
Figure 5 shows the EPMA maps when heat-treated at 1173 K, 1273 K, and 1373 K. It was confirmed that the α phase contained large amounts of Cr and Mo, and the σ phase was further enriched with Cr and Mo. The sample heat-treated at 1173 K had a Cr- and Mo-depleted zone in the α phase. Additionally, the σ phase contained more Cr and Mo than the average composition of the alloy. The preferential growth of the σ phase in the α phase direction is because the α phase contains more Cr atoms and the diffusion rate of Cr atoms is higher than that of the γ phase. The σ phase absorbs Cr and Mo in the α phase during precipitation, and a Cr- and Mo-depleted zone is formed around the σ phase. It is well known that Cr and Mo contribute to the improvement of corrosion resistance of stainless steel. However, the results suggested that the precipitation of the σ phase promotes the anodic reaction by forming a Cr- and Mo-depleted zone in the α phase.
4. Conclusion
In this study, the effect of the σ phase on the corrosion behavior of F55, a super DSS, was investigated using polarization tests and surface observations after corrosion. The following conclusions were drawn from our observations:
-
(1)
Corrosion resistance decreases because the anodic reaction is promoted by σ phase precipitation.
-
(2)
Cr- and Mo-depleted zones are formed around the σ phase because Cr and Mo are absorbed from the α phase during σ phase precipitation.
-
(3)
The α phase was preferentially corroded due to the Cr and Mo depletion zones, and the σ phase remained suspended.
REFERENCES
- 1) D.H. Kang and H.W. Lee: Corros. Sci. 74 (2013) 396–407. doi:10.1016/j.corsci.2013.04.033
- 2) A. Jacob and E. Povoden-Karadeniz: Calphad 71 (2020) 101810. doi:10.1016/j.calphad.2020.101810
- 3) L.F. Garfias-Mesias, J.M. Sykes and C.D.S. Tuck: Corros. Sci. 38 (1996) 2267. doi:10.1016/S0010-938X(97)83147-2
- 4) R.A. Perren, T.A. Suter, P.J. Uggowitzer, L. Weber, R. Magdowski, H. Böhni and M.O. Speidel: Corros. Sci. 43 (2001) 707–726. doi:10.1016/S0010-938X(00)00087-1
- 5) J.W. Elmer, T.A. Palme and E.D. Specht: Mater. Sci. Eng. A 459 (2007) 151–155. doi:10.1016/j.msea.2007.01.071
- 6) N. Sathirachinda, R. Pettersson and J. Pan: Corros. Sci. 51 (2009) 1850–1860. doi:10.1016/j.corsci.2009.05.012
- 7) L. Weber and P.J. Uggowitzer: Mater. Sci. Eng. A 242 (1998) 222–229. doi:10.1016/S0921-5093(97)00521-2
- 8) N. Lopez, M. Cid and M. Puiggali: Corros. Sci. 41 (1999) 1615–1631. doi:10.1016/S0010-938X(99)00009-8
- 9) D.D.S. Silva, T.A. Simoes, D.A. Maniel and A.H.S. Bueno: Mater. Chem. Phys. 259 (2021) 124056. doi:10.1016/j.matchemphys.2020.124056
- 10) J.L. del Abra-Arzola, M.A. García-Rentería, V.L. Cruz-Hernández, J. García-Guerra, V.H. Martínez-Landeros, L.A. Falcón-Franco and F.F. Curiel-López: Wear 400–401 (2018) 43–51. doi:10.1016/j.wear.2017.12.019


