Materials Physics
Development of a Suppression Technique of Potential-Induced Degradation by a Formation of Glass Layer in Si PV Modules
2023 年 64 巻 1 号 p. 165-170

詳細
2023 年 64 巻 1 号 p. 165-170
Shunt-type potential-induced degradation (PID) is one of the degradation phenomena of photovoltaic (PV) modules which degrade PV performance drastically in short time compared to other degradation modes. In this paper, a new suppression technique of the PID was developed by coating a glass layer (GL) on the top or bottom surface of cover glass using a chemical solution known as liquid glass. PID tests were conducted using PV modules prepared with and without GL. A clear suppression effects of the PID were observed by forming GL, and the occurrence of the PID was delayed about 4 times by the formation of GL on the bottom side of cover glass in PV modules.
Carbon neutral is an important target for many countries to be achieved to prevent further global worming by next a few decades. To realize the target, no combustion of carbon is required during the generation of electricity by using renewable energy. Among the renewable energy sources, solar photovoltaic (PV) power is now considered to be the main power source as well as the wind power, and has been increasingly installed in the world. However, further installations of the solar PV power systems are still required to achieve the carbon neutral target. Additionally, many solar PV power systems installed in the last a few decades will start to be disposed due to the lifetime of PV modules in the system. Therefore, recycling and extension of the lifetime of the PV modules have been the recent issues. As for the extension of the lifetime, which is normally ∼30 years, the degradation phenomena have been analyzed to understand their occurrence mechanisms and to develop their suppression techniques.
In the last decade, shunt-type potential-induced degradation (PID) has attracted much attention of scientists because of its significant change in the PV module performance in a short period. The PID was observed in mega-solar system consisting of p-type crystalline Si based PV modules with Al frame.1–8) In high temperature and humidity environments, the PID is known to occur on the solar cells in specific PV modules, in which the high negative bias is generated between the cell and grounded Al frame, due to the output voltage of the solar system itself. The high negative bias gives rise to the migration of metal ions such as Na+ in the soda-lime cover glass toward the solar cells in PV modules. Moreover, the metal ions migrate further into solar cells through silicon nitride (SiNx). The above process is considered to form shunt passes in pn-junctions and to result in PID.9–16)
To prevent the PID and to achieve the long-term operations of PV modules, anti-PID techniques have been increasingly required. Several ways to suppress the occurrence of PID have been reported as follows. The use of Na-free front cover glass can suppress the PID by diminishing migrations of Na ions.17,18) A thin TiO2 film deposited on the cell side surface of cover glass performed as a Na barrier to suppress the drifting of alkali ions.19) E. Jang et al., indicated that an ALD-grown Al2O3 layer of 30 nm also acts as an ion diffusion barrier and it could effectively suppress PID.20) In addition, high-electrical resistance ethyl-vinyl acetate (EVA) encapsulants21,22) and high cross-linking conditions23) can delay PID. To suppress Na migration, inserting ionomer14) or thin polyethylene films between the EVA and the cover glass or cells were also reported.24,25) Borosilicate glass,26) quartz glass3,4,27) and chemically strengthened glass28) are also able to prevent PID. However, the most of anti-PID techniques are not applicable in practical PV systems because of their high costs. In practice, the Si-rich SiNx film used as an anti-reflecting (AR) coating on the Si solar cell also functions to suppress PID.1,2,29–35) However, the optimum composition of SiNx for suppression of PID is different from that for AR coating. More Si rich is required for anti-PID. Such the modification of SiNx film results in increase of refractive index and light absorption which possibly reduce the conversion efficiency of solar cells.36) Solar PV technologies are still now developed not only on the conversion efficiency but also on the structure and shape adoptable to various locations such as at building walls and car roofs. Therefore, the alternative low-cost and simple technique for anti-PID applicable to various structures and shapes is now highly required for acceleration of the spread of the solar PV system.
In this research, we developed a new technique to delay the PID occurrence by coating a glass layer (GL) on a cover glass of PV module. The GL is almost the same material with the coating for car bodies, and easily formed by using a chemical solution containing poly-siloxane. The effects of GLs as anti-PID techniques are evaluated by conducting PID tests on the PV modules with and without GLs. PID occurrence was delayed by introducing GL. This technique is considered to be one of the powerful tools to suppress the occurrence of PID with low cost in the various PV modules.
The starting material of GLs is a chemical solution based on poly-siloxane and isopropanol called as liquid glass (Naruse Seijo). The solution of 100 µL was dropped by a pipette on a substrate and spread by using a tissue (Kim Wipe). Then, the liquid glass is solidified into a GL by keeping in air at room temperature (RT) for 24 h. The substrate coated here with GL is the cover glass in the PV modules. As will be discussed later, this cover glass has different morphologies between the top and bottom surfaces where the top side is defined as the light incident side. Since the thickness of GL on the cover glass was not estimated because of its surface morphology, the GL was formed on a flat slide glass (Asone, ASLAB) with the same way and the thickness was estimated approximately as 1 µm using an atomic force microscope (Hitachi, AFM 5400 Nano Navi Real, AFM 5400 L-trace WIDE-VS-P).
2.2 PV module fabricationsIn this research, three types of PV modules were prepared as shown in Figs. 1(a)–(c). The PV modules consist of layer structure as follows: a cover glass (180 × 180 × 3.3 mm3, AGC)/a sheet of EVA as the encapsulant/a p-type multi-crystalline Si cell (156 × 156 mm2)/a back sheet of polyvinyl fluoride (PVF)/polyethylene terephthalate (PET)/PVF. Note that the solar cells used in this research have a conventional structure which are covered by SiNx films as AR coating.16) The cover glass was coated by GL on the tope side (light incident side, Fig. 1(b)) or the bottom side (EVA side, Fig. 1(c)) prior to the laminations for the preparations of PV modules. Then, the PV modules were fabricated by using a laminator under vacuum at 135°C for 15 min. Note that any delamination or formations of bubbles between the cover glass and EVA in the PV modules were not observed by using the GL at the bottom side of cover glass in this research.

The schematic structures of PV modules (a) without GL, (b) with GL at top side and (c) with GL at bottom side of cover glass. Schematic diagrams of (d) PID test by using Al plate and (e) high resistance measurement setup.
Figure 1(d) shows the schematic image of a PID test setup. For the PID test, an Al plate was attached at the light incident side of PV module, and the output terminals of c-Si cell were shortened.16,37) The setup was placed in a furnace and the temperature was increased to 85°C. Using a voltage source of an insulation resistance measurement system (Kikusui, TOS7210s), a voltage of −1000 V was applied up to 12 h to the terminals of c-Si cell while the Al plate was grounded. The relative humidity in the furnace during the PID test was estimated as less than 2%. To investigate the effects of the GL insertions in PV module as the anti-PID technique, the resistance between the Al plate and the electrode of the solar cell was measured by using a function of the insulation resistance measurement system with a data logger during the PID tests. Photovoltaic characteristics were estimated from current-voltage (I-V) measurements before and after the PID tests using a solar simulator (AM 1.5, 100 mW/cm2). Additionally, a 1 h PID test and the photovoltaic characterizations were repeated up to 6 times to investigate the time dependence of PID occurrence phenomena.
2.4 GL characterizationsAccording to X-ray photoelectron spectroscopy measurements of GL, the atomic concentrations of metallic elements such as Na were below the detection limit (<0.1%) while the element of carbon was included about a few tens of % with elements of silicon and oxygen which is possibly the residual element of the organic solvent in the liquid glass. To investigate the influence of GL formations on the cover glass, the resistances were measured for cover glasses with and without GLs at RT. The setup of resistance measurements at RT is schematically shown in Fig. 1(e). Conductive rubber sheets (ρv = 1.2 × 10² Ω cm) with the thickness of 1 mm were inserted at the top and bottom side of cover glass because of the non-flat surface structure of the cover glass. A voltage of −100 V was applied from the bottom side of cover glasses for 3 h while the electrodes pressed the cover glass together with the rubber sheets by 3 kg weight to obtain better contacts between the electrodes of the resistivity chamber and cover glass for the homogeneous voltage applications. A high resistance measurement system (ADC Corp., 5450) was used with a resistivity chamber (ADC, 12702B) in a faraday cage. Additionally, morphologies of the cover glass with and without GL were measured using scanning electron microscope (SEM, Hitachi S-4300).
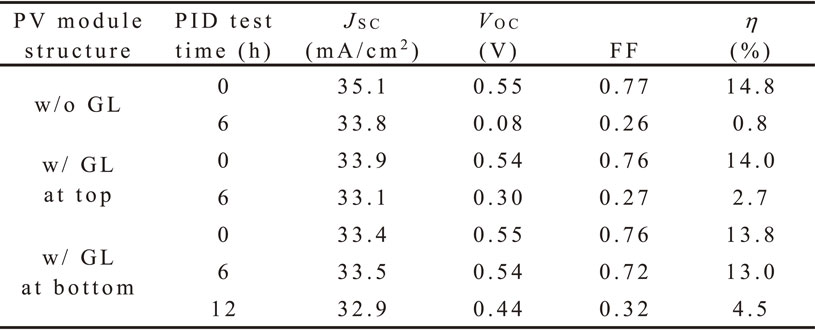
Photovoltaic characteristics of PV modules were analyzed to investigate the influences of GL insertions on PID. Figures 2(a)–(c) show the power generation characteristics of the PV modules prepared with and without the GL and before and after the PID tests. Additionally, the experimental values of the power generation characteristics of the PV modules obtained from these measurements are summarized in Table 1. Note that, in these experiments, the short circuit current (JSC) of PV modules prepared with GL before the PID tests appeared about 4 to 5% smaller than those of PV modules prepared without GL before PID. According to the light transmittance measurements (not shown here), difference in the transmittances of the quarts substrates with and without GL was less than 1%. Therefore, we considered that the differences in the JSC with and without GL were mainly originated from the individual properties of PV cells used in this research. For PV module without the GL (Fig. 2(a)), the open circuit voltage (VOC), JSC, the fill factor (FF), and the conversion efficiency (η) was decreased to about 18%, 89%, 36%, 6% of initial values, respectively, after the 6 h PID test. The drastic degradation of η was induced mainly by decreases in VOC and FF. This is the typical phenomenon reported previously as PID.16) On the other hand, for PV modules with GL (Figs. 2(b) and 2(c)), less degradations were observed after the PID tests. For the PV module with GL at the top side of cover glass (Fig. 2(b)), the VOC, JSC, FF and η were decreased to about 66%, 97%, 37% and 24% of initial values, respectively. For the PV module with GL at the bottom side of cover glass (Fig. 2(c)), the VOC, JSC, FF and η were decreased to 98%, 100%, 96% and 94%, respectively, after the 6 h PID test, and to 80%, 98%, 42% and 33% after the 12 h PID test, respectively. We see that the insertions of GL maintained better PV characteristics after the 6 h PID tests. In particular, the GL insertion at bottom side of cover glass is found to be much effective to suppress the PID.
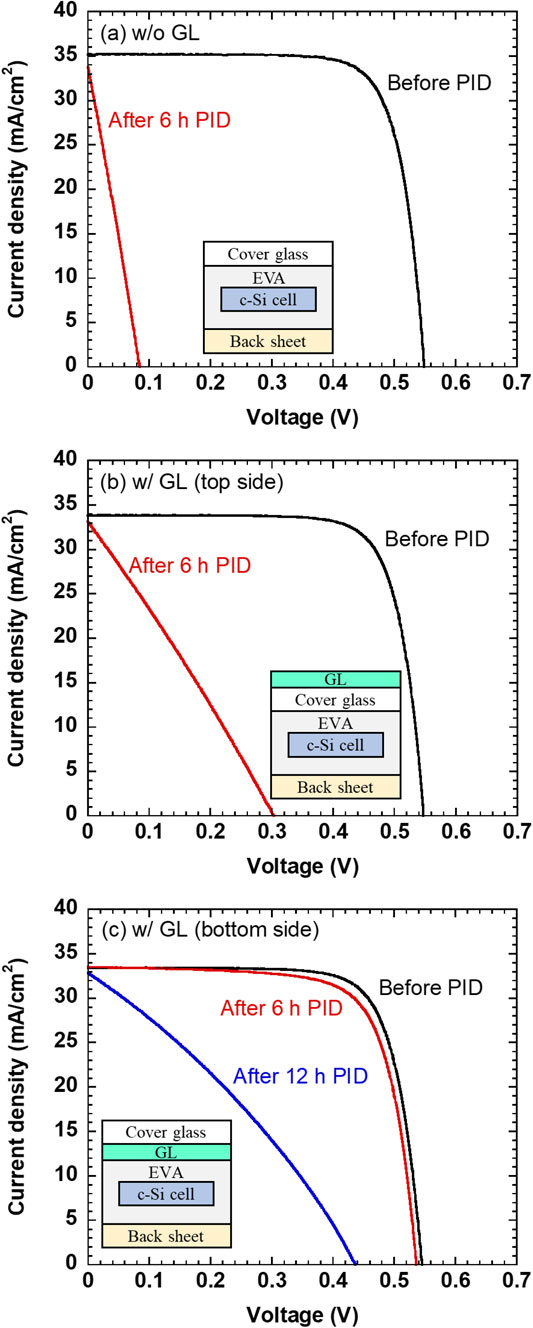
The I-V curves for PV modules before and after the PID test by applying −1000 V at 85°C for 6 h: (a) PV module without GL, (b) PV module with GL at top side of cover glass and (c) PV module with GL at bottom side of cover glass.
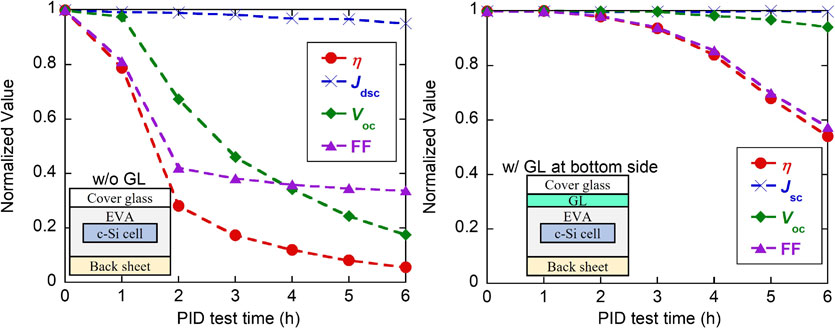
Figures 3(a) and 3(b) show the solar-cell parameters (VOC, JSC, FF and η) of PV modules without and with GL, respectively, as a function of PID test durations. All the factors were normalized by those of initial ones. Note that each PID test was conducted for 1 h, and the I-V character was measured at RT after each PID test. In the case of PV modules without GL (Fig. 2(d)), the η was decreased to about 80% of the initial values after 1 h PID test, and further degradation occurred by following the decreases of the VOC and FF. On the other hand, for PV module with GL at the bottom side of cover glass, the η was still maintained over 80% even after the 4 h PID test. These results demonstrate that the formation of the GL at the bottom side of cover glass of PV modules delays the occurrence of PID about 4 times.
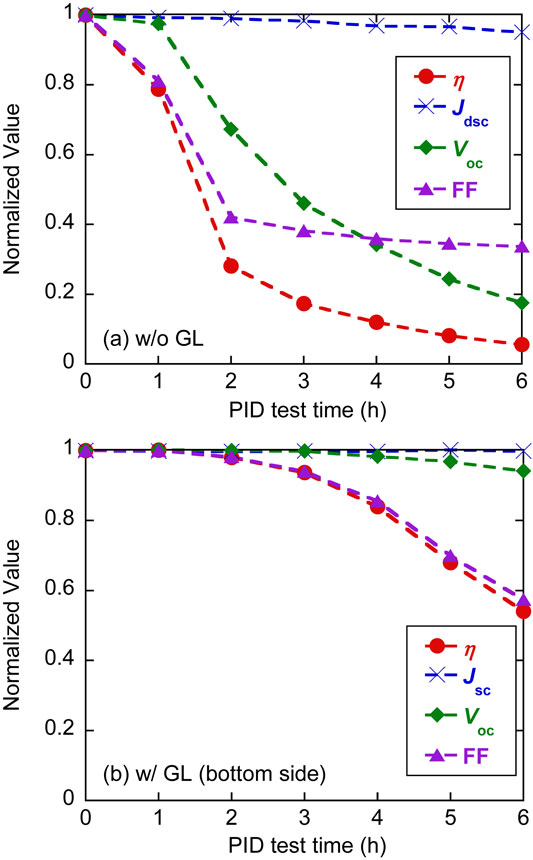
Normalized PV properties as a function of PID test duration for (a) without GL and (b) with GL at bottom side of cover glass. Each PV parameter before PID test was normalized by using the values obtained before PID tests.
To understand the PID suppression effects, the resistance and the surface morphology of the cover glass with and without GLs (top and bottom) were investigated. The resistances measurements were conducted for the cover glass itself by applying −100 V up to 3 h from bottom side of cover glass at RT. Compared to the PID test conditions, the less voltages were used to investigate the resistances of cover glasses with less ion migrations. Figure 4 shows the time dependence of resistances and surface morphologies of the cover glasses with and without GL. In Fig. 4(a), the resistances of all the samples were increased in the first 10 minutes, but there were no more significant changes after 10 minutes to 3 hours. The increases in resistances in the first 10 minutes possibly originates from the charge accumulations and/or polarizations by applying the voltage. Thus, the intrinsic resistances of the cover glasses with and without GLs were obtained after 10 minutes. It is noted here that the coating of GL makes the resistance about 10 times higher. Moreover, the coating on the bottom side leads to slightly higher resistance than the top side.
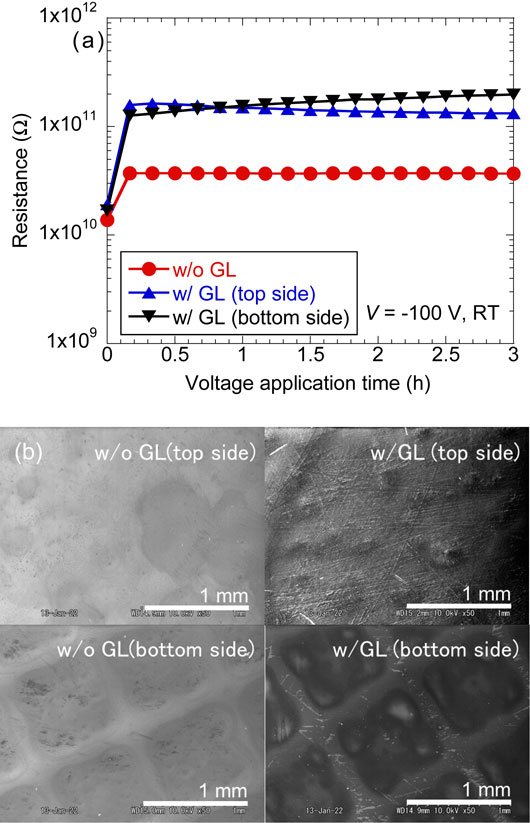
(a) Time dependence of resistance values of cover glass with and without GLs measured at room temperature and (b) SEM images of cover glasses with and without GLs.
Surface morphologies of cover glass with and without GL were observed using SEM as shown in Fig. 4(b). The cover glass without GL shows a clear difference in the surface morphology. The top side was relatively flat while the bottom side showed a grid structure that is visible with naked eyes. Note that the height of the grid structure was estimated about 0.3 mm from the cross-sectional SEM image (not shown here) and is enough large compared to the thickness of GL (∼1 µm). It is known that the grid is constructed in order to avoid forming of air bubbles in the PV modules on vacuum lamination. Thus, the surface morphology of GL is quite different between the top and bottom sides of the cover glass. In the case of GL formed on the top side, many scratch-like hair lines were observed all over the surface. These lines were probably formed during spreading the liquid glass by using tissues. On the other hand, in the case of bottom side, the GL had the hair lines only around the ridge of the grid. This means that there are bumps and dips on the GL surface. The tissue probably contacts only to the ridge of the grid. Since the component of GL (the liquid glass) is accumulated in the dent of the grid during spreading the liquid glass solutions, the averaged thickness is likely to be larger than that for the top side. The thicker GL might lead to slightly higher resistance for the case of the bottom side (Fig. 4(a)). Since, however, the resistance values are in the same order of magnitude, the thicknesses are not so different from each other.
3.3 Resistance measurements of PV modules with and without the GL during PID occurrencesTo analyze the influence of GL on anti-PID, we measured leakage currents flowing from the Al plate to the solar cell through the cover glass and EVA (Fig. 1(d)) under the conditions of −1000 V at 85°C. The resistance was estimated from the current and voltage. Figure 5 shows the time dependence of the resistances in the case of the cover glasses without and with coating of GL on the bottom side. We can see that the resistance values of the PV module prepared with GL were almost one order of magnitude larger than those without GL. This is well consistent with the resistance measurements on the cover glass at RT (Fig. 4(a)). Thus, the large difference in the resistance originates from the formation of GL on the cover glass. However, the resistance values were much less than those measured at RT. The reason why the resistance value is quite different between RT and 85°C originates from the temperature dependence of electrical conductivity of glasses (SiO2). Usually, the electrical conductivities of glasses vary one or two orders of magnitude in this temperature range.38)
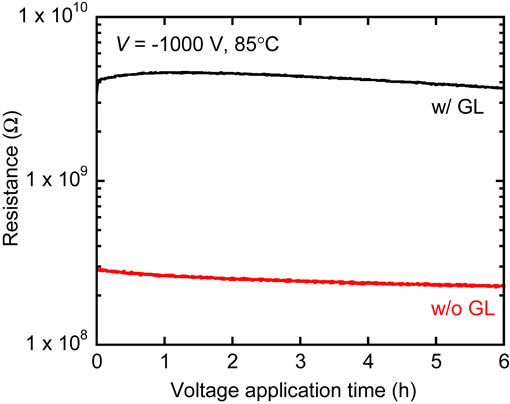
Time dependence of resistance values measured between Al plate and electrodes of PV module with and without GL.
One more thing we have to note is that the resistance value took a maximum around 1 h and then decreased. The changes in the resistances can be explained by the competition between the increase in resistivity of cover glass and the decrease in resistivity of SiNx films on the solar cell. Applying of the high voltage can migrate the metal ions outside from the cover glass, leading to the increase in the resistivity. At the same time, the metal ions migrate into the SiNx films of cell surface, giving rise to the decrease in resistivity, as reported previously using the conductive atomic force microscope.16) Thus, the behavior of the resistance depends on which factor is more dominant.
3.4 DiscussionsWe investigated the influence of GL coating on the PID phenomena of PV modules. The formation of GL at the bottom side of cover glass showed higher suppression effects. This is because the GL which is almost free from metal ions acts as a barrier to avoid the migration of metal ions from the cover glass. It is worthy of notice that the PID suppression effect appeared even if the GL was formed on the top side. According to the resistance and leakage current measurements (Figs. 4(a) and 5), the GLs were found to have higher resistance values than the cover glass. Inserting of such the high-resistivity GL is able to decrease the voltage distributed to the cover glass, giving rise to decrease in the electric field in it. This suppresses the drift of metal ions, leading to anti-PID.
Since the GL coating on the bottom side of cover glass leads to the best performance for the anti-PID, the cover glass should be coated before fabrication of PV modules. As mentioned above the anti-PID effects were observed even for the GL coating on the top side. Since the top side of cover glass can be coated even for the PV systems already installed, this technique is more easily introduced although the anti-PID effect is less. There would be materials which achieve better anti-PID effects by just coating them on the top side of cover glass. Such the materials might be realized by modifications of the liquid glass. Further optimization work of the anti-PID technique using GL will be reported elsewhere in near future.
In this study, anti-PID technique was developed by formations of GLs on the surface of cover glass using liquid glass. Conventional p-type multi-crystalline Si PV module prepared with the GLs at the bottom side of cover glass showed up to 4 times slower occurrence of PID compared with that of the PV module without GL. Additionally, anti-PID effects were observed even if the GL was formed at top side of cover glass. Thus, the following two factors were found to affect the anti-PID in our GL coating technique. The first is that GL acts as the barrier in order to prevent Na ion moving from the cover glass to the solar cell. The second is that the high resistivity of GL lowers the voltage distributed to the cover glass. The combination of these factors achieved the best performance for anti-PID.
This research work was supported by New Energy and Industrial Technology Development Organization (NEDO) and Bureau of Waterworks Tokyo Metropolitan Government.