Mechanics of Materials
Effect of Precipitation Size on Dislocation Density Change during Tensile Deformation in Al–Zn–Mg Alloy
2023 Volume 64 Issue 11 Pages 2584-2590

Details
2023 Volume 64 Issue 11 Pages 2584-2590
Al–Zn–Mg alloys with different precipitate sizes were investigated to determine the influence of the precipitate size on the flow stress and dislocation density change during tensile deformation. The dislocation density was measured using in-situ X-ray diffraction at the SPring-8 synchrotron radiation facility with a time resolution of about 2 s. In region II with rapid dislocation multiplication, from under-aging to peak aging, the dislocation density increased with increasing aging time. Under over-aging conditions, the amount of dislocation multiplication in region II decreased with increasing aging time. Even in region III, the increase in dislocation density with plastic deformation was the largest for the peak aging conditions. However, the amount of work hardening was small and the contribution of dislocation hardening to the strength of the material was minimal. For over-aging conditions, the increase in dislocation density in region III was smaller than for the other regions, but the amount of work hardening was relatively large. It is considered that the influence of the dislocation density on work hardening is determined by the effectiveness of precipitates as obstacles to dislocation motion.
This Paper was Originally Published in Japanese in J. JILM 71 (2021) 343–348.
Aluminum, which is widely used as a structural metal, can be imparted with high strength through strengthening mechanisms such as work hardening (dislocation strengthening),1) grain refinement strengthening,2,3) solid solution strengthening,4) and precipitation and dispersion strengthening.5–7) In particular, 7000 series aluminum alloys (Al–Zn–Mg alloys), as typified by superduralumin, exhibit the highest strength among aluminum alloys because precipitation strengthening acts as the main strengthening mechanism. The strength is increased by precipitates inhibiting dislocation movement during plastic deformation of metallic materials. As plastic deformation progresses, new dislocations are introduced and work hardening occurs owing to the increase in dislocation density, so the change in dislocation density during deformation is an important factor in determining the mechanical properties of 7000-series aluminum alloys.
Recently, in-situ X-ray diffraction (XRD) measurements of dislocation density changes during tensile deformation have been performed using synchrotron radiation.8–11) The authors’ research group has investigated the behavior of dislocation density change in fine-grained pure aluminum with a grain size of up to several micrometers subjected to severe plastic deformation8) and coarse-grained pure aluminum with a grain size of 10 µm or larger.9) The dislocation density changes have been investigated by in-situ XRD measurements during tensile deformation using synchrotron radiation at SPring-8. It was found that the dislocation density in pure aluminum changes through four regions. Region I is where the dislocation density hardly changes from its initial state and deformation progresses only by elastic deformation. When the stress reaches σI, the dislocation density begins to increase and we shift to region II. In this region, the dislocation density increases rapidly up to a certain dislocation density ρII, the stress increases significantly, though not as much as in region I, and deformation proceeds by plastic and elastic deformation. When the stress and dislocation density reach σII and ρII, respectively, the increase in dislocation density suddenly slows down and we enter region III, where deformation proceeds almost exclusively by plastic deformation. ρII is the dislocation density required for deformation to progress almost exclusively by plastic deformation. In region IV, the dislocation density decreases rapidly, the stress drop being associated with rupture. In addition to σI, σII can be regarded as a kind of yield stress, and the relationship between σII, ρII and grain size change was investigated. It was found that Bailey-Hirsch’s equation1) holds, indicating that grain refinement strengthening occurs through dislocation strengthening.
On the other hand, for precipitation strengthening, which is a typical strengthening mechanism in 7000-series aluminum alloys, Gerold-Harberkorn’s equation5) and Orowan’s equation6,7) are known to express the amount of strengthening. The former expresses the relationship between dislocation motion and precipitates from sub-aging to peak aging and the latter from over-aging. However, in both equations, the amount of precipitation strengthening is explained in terms of the precipitate radius, precipitate particle spacing, and volume fraction, while the effect of dislocation density increase during plastic deformation is not considered. It is necessary to consider dislocation strengthening in addition to precipitation strengthening to express strength during plastic deformation, but it is not yet clear whether the flow stress can be expressed by a simple addition of the contributions from each of these strengthening mechanisms when they work simultaneously.12,13)
Thus, the purpose of this study is to investigate the effect of precipitate particle size on the dislocation density change during deformation using Al–Zn–Mg alloys with different precipitate sizes, and to clarify the relationship between flow stress and dislocation density in precipitation-strengthened alloys.
The 7075 alloy was used in the experiments as-rolled with a thickness of 1 mm. Table 1 shows the chemical composition of this alloy, as determined by luminescence analysis. The specimens were solution-treated in an electric furnace at 733 K for 300 s, water-quenched, and isothermally aged in an oil bath at 383 K for 1.8 to 10800 ks. The same solution annealing and water quenching steps were followed by room-temperature aging at 36–3110.4 ks for various times. To investigate the grain size of these specimens, electron beam backscatter diffraction (EBSD) measurements were performed using a TSL OIM mounted on a JEOL JSM-6500F scanning electron microscope. The specimens were cut into 10 × 10 × 1 mm pieces using a diamond cutter to obtain samples for small-angle X-ray scattering (SAXS) measurements. Using an electric discharge machine, tensile specimens with a length of 20 mm and a width of 5 mm were cut so that the rolling and tensile directions were parallel, and the specimens were ground to a thickness of about 0.5 mm.

SAXS measurements14,15) were performed at SPring-8 BL19B2 to measure the precipitate size of each aged material. The incident X-ray energy was 25 keV and the exposure time was 60 s. A Dectris Pilatus-2M two-dimensional pixel detector was placed 3046 mm behind the sample to measure the scattering intensity. One-dimensional scattering profiles were obtained by integrating the obtained two-dimensional scattering intensity distribution around the center of rotation at the X-ray transmission position. After the background was removed from this profile, the inter-particle distance L [nm] was calculated from the scattering vector km [nm−1] at the peak position using the following formula:15,16)
| \begin{equation} \mathrm{L} = \frac{7.2}{\mathrm{k}_{\text{m}}}. \end{equation} | (1) |
The radius of the precipitated particles was then calculated using Guinier’s law,17,18) which can be represented by the equation
| \begin{equation} \ln I(k) = \ln I(0) - \frac{1}{5}r^{2}k^{2} \end{equation} | (2) |
where k is the scattering vector, I(k) is the scattering intensity, and r is the radius when the precipitate is considered spherical. ln I(k) is plotted against k2 and r is obtained from the initial slope, since Guinier’s law holds in the low scattering vector region. Both 383 K and room-temperature aging in the 7075 alloy have been reported for spherical precipitates. The precipitation of a near-spherical η′ phase and the formation of GP zones have been reported.19,20)
In-situ XRD measurements during tensile deformation were performed at SPring-8 BL19B2 to investigate the dislocation density change during deformation. The measurement system is shown in Fig. 1. The tensile tester was placed on a goniometer, and a 6-mount Mythen detector was placed about 22° above the direction of X-ray transmission. The camera length was 720.27 mm. XRD measurements were made with a time resolution of 2 s while tensile tests were performed at room temperature with an initial strain rate of 3.3 × 10⁻⁴ s−1. The half-widths and diffraction peak angles of the obtained (111), (200), (220), (311), (222), and (331) planes were determined, and the dislocation density was calculated using the Williamson-Hall method.8,9,21) The Williamson-Hall equation is
| \begin{equation} \frac{\Delta 2\theta \cos\theta}{\lambda} = 2\varepsilon\frac{\sin\theta}{\lambda} + \frac{0.9}{D} \end{equation} | (3) |
where θ is the diffraction angle, Δ2θ is the width at half maximum, λ is the wavelength of incident X-rays (= 0.491 Å), ε is the inhomogeneous strain, and D is the crystallite size. The horizontal and vertical axes represent 2 sin θ/λ and Δ2θ cos θ/λ, respectively, and the inhomogeneous strain can be obtained from the slope. In addition, the dislocation density ρ was calculated from the inhomogeneous strain using the equation22)
| \begin{equation} \rho = 16.1\left(\frac{\varepsilon}{b}\right)^{2} \end{equation} | (4) |
where 16.1 is the coefficient for the fcc metal and b is the magnitude of the Burgers vector.

Schematic diagram of in-situ XRD measurement during tensile test.
EBSD measurements of the ND-RD cross-sections of solution-annealed and aged samples are shown in Fig. 2. (a) The solution-annealed specimens show elongated grains in the RD direction, and the average grain size, d, is 15.3 µm, which is defined as the average spacing of large grain boundaries in the ND direction. (b) The 383 K, 36 ks aged specimen had elongated grains similar to those of the solution-annealed specimen, and d was 17.1 µm. The d values for the other aging conditions were also about 20 µm, and there was almost no growth of grain size as the aging time varied. Since the effect of grain size on dislocation density change in pure aluminum is very small for grain sizes larger than 5 µm, the effect of grain size on dislocation density change in the 7075 alloy can be considered negligible.9)

TD inverse pole figure (IPF) maps of ND-RD plane obtained by EBSD measurement of 7075 alloys, in the (a) solid solution and (b) the aged at 383 K for 10.8 ks.
Figure 3 shows the variation in precipitated particle radius and interparticle distance L with aging time at 383 K and room temperature, calculated from SAXS measurements. In the 383 K aged specimen, the particle radius increased monotonically from 1.2 to 5.6 nm and the interparticle distance increased from 8.0 to 25.1 nm. In room-temperature aging, the particle radius and interparticle distance increased monotonically with increasing aging time.

Aging time dependency of the (a) precipitates size and the (b) distance between precipitates in 7075 alloys aged at 383 K and RT.
Figure 4 shows the change in dislocation density results for 383 K, 10.8 ks, 180 ks, and 10800 ks aged specimens, calculated from in-situ XRD. As in the case of pure aluminum,8,9) region I shows almost no change in dislocation density from the initial state, region II shows a rapid increase in dislocation density, and region III shows a slower increase in dislocation density. The boundaries of regions I and II in the 10.8 ks, 180 ks and 10800 ks aged specimens are indicated by dashed lines, with strains of 2.13, 2.90 and 1.45%, respectively. It is difficult to determine the boundary between regions II and III from Fig. 4 because of the large variation in the measured dislocation density in region III. This is because in region III, where deformation proceeds only by plastic deformation, the XRD peaks broaden owing to the increase in heterogeneous strain, resulting in a decrease in strength, which reduces the accuracy of peak fitting. For example, the (220), (331), and (222) XRD peaks at the onset of plastic instability at 11.4% strain in the 180 ks aged material were about 1/10, 1/35, and 1/70, respectively, of the (111) peak, which is the most intense peak. Therefore, the boundary between regions II and III was determined using the logarithmic graph of dislocation density shown below.

Changes in dislocation density during tensile deformation in 7075 alloys aged at 383 K for 10.8, 180 and 10800 ks.
Figure 5 shows the stress-strain curve and dislocation density variation of a 383 K, 10.8 ks aged material with a precipitation particle radius of 1.67 nm, which is in the sub-aging range. The nominal strain is calculated from the change in stroke of the tensile tester, so the deformation of the tester is included. Dislocation density is expressed in logarithmic scale to facilitate understanding of the change trend. The boundary between regions II and III is 4.78% strain. The dislocation growth initiation stress at the boundary between regions I and II was σI = 351 MPa. The dislocation density increased rapidly in region II, and when the dislocation density ρII reached 1.20 × 10¹⁵ m−2, it shifted to region III, where the change was relatively slow. When the dislocation density reached ρII, the stress was σII = 423 MPa and the 0.2% proof stress was σ0.2 = 370 MPa. In region III, stress increased with a gradual increase in dislocation density, and plastic instability occurred at 16.2% strain, indicating the maximum stress. The stress was σTS = 502 MPa, and the dislocation density at that time was ρTS = 2.76 × 10¹⁵ m−2, which increased by 79 MPa and 1.56 × 10¹⁵ m−2 from the beginning of region III, respectively. The increases in these values were, respectively, 40 MPa and 5.87 × 10¹⁴ m−2 for pure aluminum with a similar grain size, indicating that these increases are very large for the sub-aged material. Hereafter, the increases in stress σII and dislocation density ρII to σTS and ρTS at the beginning of region III will be treated as the work hardening and dislocation density increases in region III.

Changes in stress and dislocation density by stroke change in 7075 alloy aged at 383 K for 10.8 ks.
Next, Fig. 6 shows the stress-strain curve and dislocation density change for the peak aging condition of 383 K and 180 ks. The radius of precipitated particles is 2.43 nm. As with the sub-aged material, 4.50% strain was used as the boundary between regions II and III based on the logarithmic change in dislocation density. The values of σI = 469 MPa, σ0.2 = 506 MPa, and σII = 533 MPa. In the sub-aged and peak-aged materials, the strength increased with increasing precipitate particle radius because of the particle shearing mechanism at work, in which dislocations move by shearing the precipitates, which act as obstacles.14) In region II, dislocation density ρII increased rapidly up to 1.63 × 10¹⁵ m−2, and then in region III, stress and dislocation density increased as in the sub-aged material. The maximum stress when plastic instability occurred at 11.4% strain was σTS = 567 MPa, and the maximum stress at which plastic instability occurred at 11.4% strain was ρTS = 567 MPa and the dislocation density was ρ = 3.20 × 10¹⁵ m−2. The work hardening and dislocation density increase in region III were 34 MPa and 1.57 × 10¹⁵ m−2, respectively. The dislocation density increase was about five times larger than that of pure aluminum, while the amount of work hardening was smaller than that of pure aluminum.

Changes in stress and dislocation density by stroke change in 7075 alloy aged at 383 K for 180 ks.
Figure 7 shows the stress-strain curve and dislocation density variation of the 383 K, 10800 ks aged (over-aged) material. The precipitation particle radius was 5.6 nm, and from the logarithmic change in dislocation density, the boundary between regions II and III was 2.30% strain, σI = 188 MPa, σ0.2 = 234 MPa, σII = 235 MPa. In the over-aged material, the dislocations were unable to shear the impaired precipitates and the Orowan mechanism, in which dislocations leave behind Orowan loops as they move, was at play, resulting in a significant reduction in strength compared to the sub-aged and peak-aged materials, where the particle shearing mechanism was observed.14,23) In region II, the dislocation density increased to ρII = 1.07 × 10¹⁵ m−2 and moved to region III. The maximum stress at the onset of plastic instability at 10.0% strain was σTS = 272 MPa, at which the dislocation density was ρTS = 2.10 × 10¹⁵ m−2, and the work hardening and dislocation density increases in region III were 37 MPa and 1.03 × 10¹⁵ m−2, respectively. Both the work hardening and dislocation density increases were smaller than those of the sub-aged and peak-aged materials, and these changes were different for the sub-aged, peak-aged, and over-aged materials.

Changes in stress and dislocation density by stroke change in 7075 alloy aged at 383 K for 10800 ks.
Dislocation growth initiation stresses for the 10.8 ks sub-aged, 180 ks peak-aged, and 10800 ks over-aged materials were σI = 351, 469, and 188 MPa, respectively, all very large compared to σI = 22 MPa for pure aluminum having a similar grain size. This may be because dislocation sources, such as the Frank-Read source, must overcome obstacles such as solid solution elements and precipitates in order to overhang and grow, thus increasing the stress required for dislocation growth. In addition, as seen in the stress-strain curves and dislocation density changes in Figs. 5–7, the work hardening rate immediately after the start of region II and the dislocation density increase rate increase as aging progresses, and σ0.2, which has been treated as the conventional yield stress, is close to the σI for the 10.8 ks sub-aged material, in between the σI and σII for the 180 ks peak-aged material and close to the σII for 10800 ks over-aged materials. The yield stress represented by σ0.2 changes from the stress at the start of dislocation multiplication to the stress after dislocation multiplication. Thus, although σ0.2 is a stress at different dislocation multiplication stages at different stages of aging, the absence of a dislocation density term in the equations for precipitation strengthening, such as the particle shear and Orowan mechanisms, suggests the need to consider the presence of dislocation multiplication when discussing these strengthening amounts.
Figure 8 shows the relationship between the 1/2 power of ρII and σII. In addition, the relationship between ρII and σII in A1200 alloys of different grain sizes is plotted as a dashed line.9) This line is considered to represent dislocation strengthening because in A1200 alloys, the obstacles to dislocation movement are other dislocations. All RT-aged materials, in which the GP zone forms, are under sub-aging conditions. In the 383 K aged specimen, sub-aging to peak-aging are in the particle shear mechanism region. In this region, as aging progresses, the Bailey-Hirsch relationship deviates significantly from σII = 6.30 × 10⁻⁶ ρII1/2 for A1200 alloys, which represents dislocation strengthening. On the other hand, for over-aged alloys in the Orowan region, the values approach the linear Bailey-Hirsch relationship for A1200 alloys with elapsed aging time. Figure 9 shows the relationship between dislocation density and stress in region III for the early sub-aged, peak-aged, and over-aged specimens. The relationship between dislocation density ρ and stress σ in the first half of region III is represented by a straight line whose slope varies greatly depending on the aging conditions. However, in the latter half of region III, many deviations from linearity were observed. This is because the intensities of the XRD peaks decrease as deformation progresses and the variation in calculated dislocation density increases as shown in Fig. 4. In the latter half of region III, where the dislocation density increases, dislocation rearrangement and cell formation are considered to occur, and the calculations of dislocation density by the Williamson-Hall method and eq. (4) are considered to be no longer valid. Therefore, the linear equation was calculated using the first half of the deformation where these effects are small. σ = 395 + 1.20 × 10⁻⁶ ρ1/2 for the 10.8 ks sub-aged material, σ = 522 + 6.11 × 10⁻⁷ ρ1/2 for the 180 ks peak-aged material, and σ = 98.0 + 4.26 × 10⁻⁶ ρ1/2 for the 10800 ks over-aged material. The variation in the slope k of the straight line with aging time is shown in Fig. 10. k decreased with aging time from 3.93 × 10⁻⁶ immediately after solution treatment to a minimum value of about 0.5 × 10⁻⁶ from 50 ks to 1080 ks, and then increased again in the over-aging region after 2520 ks. The value was significantly larger than that immediately after solution annealing in the material over-aged for 10800 ks. The effect of dislocation density increase on strength increase in region III varied greatly with the precipitated particle size.


Relationship between σ and ρ during the stage III in 7075 alloys aged at 383 K.
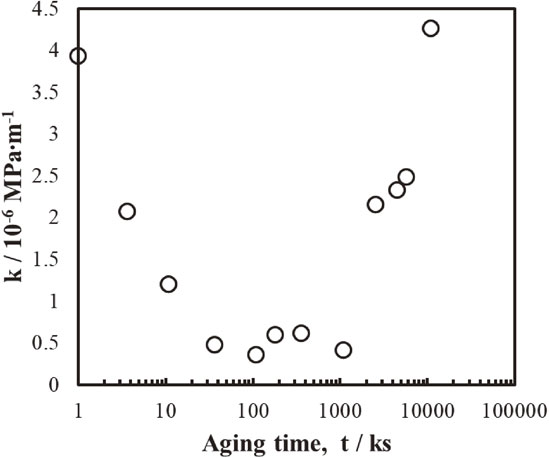
Aging time dependency of the slope of the Bailey-Hirsch relationship during the initial stage III.
In the peak-aged material, ρII is large and σII is also high. However, in region III, i.e., the plastic deformation region, the dislocation density increase is large, but the strength increase is minimal. In the plastic deformation region, the shear strain rate $\dot{\gamma }$ from the Orowan equation can expressed as24)
| \begin{equation} \dot{\gamma} = \rho_{m}b\bar{v} \end{equation} | (5) |
where ρm is the mobile dislocation density, b is the magnitude of the Burgers vector, and $\bar{v}$ is the average velocity of dislocation movement. Since the tensile velocity is constant, $\dot{\gamma }$ can be regarded as constant, and since b is also constant, ρm decreases or increases depending on the increase or decrease in $\bar{v}$.
The obstacles to dislocations in motion are other dislocations and precipitates. The strength of precipitates as obstacles is higher than that of dislocations, and as aging progresses from sub-aging to peak aging, the strength of precipitates as obstacles increases5) because it is harder for dislocations to cut through precipitates. The average velocity of dislocations decreases accordingly, and the dislocation density required to deform at a given shear strain rate, ρII, increases. Also, since σII is determined by the process whereby dislocations overcome precipitates, σII increases as the strength of precipitates as obstacles increases.
However, once over-aged and in the Orowan region, the average velocity of dislocations6,7) increases and ρII decreases as dislocations bypass precipitates owing to the coarsening of precipitates, and the strength of precipitates as obstacles decreases significantly. In addition, as the strength of precipitates as obstacles decreases, σII decreases. Therefore, ρII and σII are expected to approach the Bailey-Hirsch relationship of A1200 alloys due to over-aging, as shown in Fig. 8. This suggests that as precipitate coarsening progresses, the strength of precipitate obstructions approaches that of dislocation obstructions.
In region III, on the other hand, the dislocation density gradually increases owing to plastic deformation, and at the maximum stress, the dislocation density is about twice as large as at ρII. Therefore, in considering the strength in this region, the density of other dislocations, which can be obstacles, must be considered to a greater extent. Because the strength of dislocations as obstacles is relatively large in sub-aging and over-aging, the flow stress is determined by both the process of dislocations overcoming precipitates and other forest dislocations, and work hardening occurs because of the increase in dislocation density. On the other hand, in the peak-aged material, the obstructing strength of precipitates is much greater than that of dislocations, so the flow stress is mainly determined by the process of dislocations overcoming the precipitates, and the increase in flow stress, or work hardening, due to an increase in dislocation density is expected to be smaller.
In summary, the amount of work hardening in precipitation-strengthened alloys is not determined by dislocation density changes alone, but also by the relative obstructing strength of precipitates and dislocations to dislocation migration, making it difficult to express flow stress and maximum stress by a simple addition of precipitation and dislocation strengthening.
In-situ XRD measurements during tensile deformation using synchrotron radiation were used to investigate the effect of precipitate size on dislocation density changes in Al–Zn–Mg alloys, yielding the following findings:
The samples for this study were provided by UACJ, Inc. This study was financially supported by the Light Metal Education Foundation Inc., in partial and the support is gratefully appreciated. Synchrotron radiation experiments in this study were performed at BL19B2 of SPring-8 with the approval of the Japan Synchrotron Radiation Research Institute (JASRI), (project numbers: 2016A1728, 2017B1023, 2019A1744).