Abstract
In recent years, to reduce manufacturing costs and alleviate the rare-earth supply/demand imbalance in the Nd–Fe–B magnet market, researchers have actively pursued the development of (Nd,Ce)–Fe–B magnets, in which Nd is replaced by Ce. In the present study, we focused on magnetic powders treated by the hydrogenation–disproportionation–desorption–recombination (HDDR) process and explored the relationship between the hydrogen pressure and temperature (PH2–T curves) in the Ce–Fe–B system, which is essential for the development of (Nd,Ce)–Fe–B magnets. It was confirmed that the disproportionation and recombination reactions of both Ce2Fe14B and CeFe2 take place in the Ce–Fe–B system. Furthermore, compared with Nd2Fe14B, the PH2–T curve of Ce2Fe14B was found to be shifted to higher pressure and lower temperature, suggesting a corresponding shift in the HDDR conditions under which good magnetic properties can be obtained.
1. Introduction
Recent years have witnessed a growing trend to replace gasoline-powered vehicles with electric vehicles in an effort to reduce carbon dioxide emissions. This has increased the demand for Nd–Fe–B anisotropic sintered magnets for high-performance electric vehicle motors. However, there is concern about the growing supply risk of heavy rare-earth elements such as Dy and Tb, which are added to these magnets to realize good heat resistance, namely, high values of the coercivity HcJ and temperature coefficient β. Furthermore, because the applications of these anisotropic magnets are expanding into a variety of fields besides electric vehicles, there is also unease regarding the rising price of Nd metal. Therefore, the development of technologies to reduce the amounts of Dy, Tb, and Nd in Nd–Fe–B magnets is attracting substantial attention.
Effective approaches to maintain high HcJ at lower Tb and Dy contents include refinement of the powder particle size and crystal grain size,1) the formation of a smooth interface between the grain boundary phase and Nd2Fe14B phase,1) and the surface-selective introduction of Dy and Tb into the Nd2Fe14B grains.2,3) For example, a jet milling process using He gas4–6) was developed to refine the powder particle size for sintered magnets, hot deformation7,8) and hydrogenation–disproportionation–desorption–recombination (HDDR) processes9–15) were exploited to refine the crystal grain size, and a grain boundary diffusion process2,16) was used to selectively introduce heavy rare-earth elements near the surfaces of Nd2Fe14B crystals. These technologies have been applied in combination with each other in recent years.8,17–21) Meanwhile, reduction of the Nd content is often accomplished by partially replacing this element with Ce, which is generated in large quantities as a byproduct during the refinement of Nd from light rare-earth ores.22–24) Specifically, (Nd,Ce)–Fe–B sintered magnets22,23) and (Nd,Ce)–Fe–B hot-deformed magnets prepared by the grain boundary diffusion process using Nd–Cu eutectic alloys24) have been reported. In particular, the latter approach is expected to increase the Nd concentration near the grain surface and form a shell with high crystalline magnetic anisotropy, thereby suppressing the coercivity decrease associated with Ce substitution.24)
In addition, the research and development of electric vehicle drive systems has been actively conducted in line with the aforementioned trend toward vehicle electrification. One of the most important issues is the downsizing of motors to reduce vehicle weight and ensure sufficient passenger space. The torque generated by a motor depends on its dimensions, but because output is the product of torque and rotational speed, the motor size can be decreased while maintaining output by increasing the rotational speed.25) Practical technologies for the high-speed rotation of motors are mainly being developed in Europe,26,27) although reports of such technologies from Japan have also emerged in recent years.28) One of the problems with the high-speed rotation of motors is energy loss due to eddy currents in the magnets.29) Moreover, demagnetization can occur because of the heat generated by the magnet itself owing to these eddy currents.29) These problems become severe in magnets with low electrical resistance, such as sintered and hot-deformed magnets.30) By contrast, Nd–Fe–B bonded magnets consisting of resins and Nd–Fe–B magnetic powders are known to exhibit high electrical resistivity and suppressed eddy currents.30,31) Nd–Fe–B bonded magnets can be broadly classified into two types, namely, isotropic and anisotropic, depending on the characteristics of the magnetic powder used in their fabrication. In general, isotropic magnetic powders produced by the melt-spinning process32,33) are inexpensive, although the obtained (BH)max values are typically insufficient for high-speed rotation applications. On the contrary, anisotropic magnetic powders feature higher (BH)max values and are suitable for such purposes. Anisotropic Nd–Fe–B magnetic powders are typically prepared by the HDDR process.9) In this process, the Nd–Fe–B powder is subjected to heat treatment under H2 to mediate a disproportionation reaction that decomposes Nd2Fe14B into NdH2, α-Fe, and Fe2B phases, followed by dehydrogenation to induce a recombination reaction that recrystallizes fine grains of Nd2Fe14B to afford high HcJ. By precisely controlling the H2 pressure and temperature during the disproportionation and recombination reactions, anisotropic magnetic powders can be obtained.10–15)
To explore the anisotropic conditions in the HDDR process, Nakamura, Sugimoto, and co-workers examined the relationship between the H2 pressure and temperature (PH2–T curves).34,35) Analysis of the hydrogen desorption characteristics during the recombination reaction revealed that it is important for anisotropy that the disproportionation and recombination reactions occur in the region close to the PH2–T curve. Although various models of the induction mechanism of magnetic anisotropy during HDDR treatment have been proposed,36–38) the prevailing theory is as follows.39–42) First, it was observed that disproportionation treatment under conditions near the PH2–T curve led to orientation relationships of [110]α-Fe // [110]NdH2+x and (−110)α-Fe // (−220)NdH2+x between the α-Fe and NdH2+x grains. In addition, the recombined Nd2Fe14B grains were clearly aligned with orientation relationships of (001)Nd2Fe14B // (110)α-Fe and (001)Nd2Fe14B // (110)NdH2+x. By contrast, such relationships were not observed in samples after disproportionation treatment under conditions far from the PH2–T curve. Therefore, the induction mechanism of magnetic anisotropy is thought to be attributable to the maintenance of these specific crystallographic orientation relationships between α-Fe and NdH2+x during disproportionation and Nd2Fe14B after recombination. On the basis of this theory, new techniques for preparing raw powders for HDDR that lead to enhanced anisotropy have been reported.43,44) As described above, anisotropic magnetic powders obtained by the HDDR process are attracting attention as promising magnetic materials for high-speed motors. In addition, in response to the aforementioned demand for high-performance magnets with lower Tb and Dy contents, anisotropic magnetic powders with high coercivity prepared by the HDDR process without the use of heavy rare-earth elements have been reported.20,21) Finally, although it is desirable to reduce the content of Nd by replacing it with Ce, there have been very few reports45) on the HDDR behavior of the Ce–Fe–B system, which is crucial for understanding the (Nd,Ce)–Fe–B system, and the detailed reaction behavior and optimal treatment conditions for realizing high anisotropy remain unknown.
Therefore, in this work, we aimed to determine the optimal disproportionation conditions for achieving high anisotropy in Ce–Fe–B alloys by clarifying the temperature dependence of the recombination pressure in the HDDR reaction (PH2–T curve) and examining the hydrogen desorption characteristics during the recombination process.
2. Experimental Procedure
A Ce–Fe–B-based alloy with a composition of Ce12.5Febal.B6.5Nb0.2 was prepared using a strip-casting method and subsequent homogenization at 1030°C for 40 h under Ar atmosphere. For comparison, a Nd–Fe–B-based alloy with a composition of Nd12.5Febal.B6.5Nb0.2 was also prepared using strip casting and subsequent homogenization at 1140°C for 40 h under Ar atmosphere. The obtained alloy ingots were subjected to hydrogen decrepitation at 25°C under H2 at a pressure of 100 kPa for 3 h. The resulting materials were sieved and the obtained powders (<212 µm) were used as the starting materials, which are referred to as the “as-prepared samples”.
2.1 Confirmation of HDDR phenomena for the Ce–Fe–B alloy
Prior to investigating the hydrogen desorption characteristics, we examined whether HDDR phenomena occur in the Ce–Fe–B system. The heat treatment under H2 for the disproportionation reaction and the dehydrogenation treatment for the recombination reaction were performed in a computer-controlled furnace as depicted in Fig. 1(a). This furnace allows precise control over the treatment temperature and H2 atmosphere while simultaneously measuring the actual H2 flow rate Q, where a positive value reflects hydrogen desorption from the sample, and the H2 pressure PH2. Figure 1(b) shows a schematic diagram of the processing conditions for the heat treatment under H2 and the subsequent dehydrogenation treatment. For the heat treatment step, the as-prepared samples were heated to 820°C over 60 min and maintained at this temperature for 180 min under a PH2 of 100 kPa (H-treatment). After H-treatment, the powders were heated to 850°C over 5 min under a PH2 of 100 kPa and then maintained at this temperature under vacuum for 150 min (V-treatment). Finally, the powders were allowed to cool to room temperature under a vacuum of 10−2 Pa, and the resulting samples are referred to as “V-treat. samples”. Samples were also prepared in which the powders were allowed to cool to room temperature under a PH2 of 100 kPa immediately after H-treatment, and these are referred to as “H-treat. samples”.

The as-prepared, H-treat., and V-treat. samples were characterized by X-ray diffractometry (XRD; SmartLab 9 kW, Rigaku) with Cu-Kα radiation, scanning electron microscopy (SEM; JSM-7800F, JEOL) and energy-dispersive X-ray spectroscopy (EDS; X-Max 80, Oxford Instruments).
2.2 Hydrogen desorption characteristics of the Ce–Fe–B alloy during the recombination process
The hydrogen desorption characteristics were measured as depicted in Fig. 2(a). First, the H-treatment step was performed as described above. Next, the temperature was raised or lowered to the dehydrogenation treatment temperature Tdeh. and PH2 was gradually decreased toward vacuum under isothermal holding. Along with the evacuation of the furnace chamber, the hydrogen pressure gradually decreased until it reached the critical pressure of, for example, the recombination reaction. The samples then began to desorb hydrogen, leading to an increase in the Q value as shown in Fig. 2(b).

By means of this method, the pressure at which Q displayed a local minimum is herein defined as the starting pressure for hydrogen desorption Pdes., as indicated in Fig. 2(c). In addition, XRD was performed to identify the origin of the hydrogen desorption. Various Tdeh. values (760, 820, 850, and 880°C) were applied and the Pdes. value was determined in each case. Next, the standard enthalpy change of reaction ΔH0 and standard entropy change of reaction ΔS0 were calculated using the obtained Tdeh. and Pdes. values as follows. The van’t Hoff equation for recombination reactions, where P0 is standard pressure (100 kPa) and R is the gas constant, is shown below.
| \begin{equation}
\ln \frac{P_{\text{des.}}}{P_{0}} = -\frac{\Delta H_{0}}{\text{R}}\frac{1}{T_{\text{deh.}}} + \frac{\Delta S_{0}}{\text{R}}
\end{equation}
| (1) |
Because ln(Pdes./P0) and Tdeh. display a linear relationship, ΔH0 and ΔS0 can be calculated from the slope and intercept. Finally, the relationship between Pdes. and Tdeh. (PH2–T curve) was estimated by rearranging eq. (1) as follows and substituting the obtained ΔH0 and ΔS0 values:
| \begin{equation}
T_{\text{deh.}} = \cfrac{\Delta H_{0}}{\Delta S_{0} - \text{R} \cdot \ln \cfrac{P_{\text{des.}}}{P_{0}}}
\end{equation}
| (2) |
3. Results and Discussions
3.1 Confirmation of HDDR phenomena for the Ce–Fe–B system
Figure 3(a), (b), and (c) show the XRD patterns of the as-prepared, H-treat., and V-treat. samples, respectively, which were recorded to investigate whether the disproportionation and recombination reactions occurred in the Ce–Fe–B alloy. As shown in Fig. 3(a), most of the peaks observed for the as-prepared powder were identified as Ce2Fe14B46) (tetragonal, P42/mnm) or CeFe247) (cubic, Fd-3m). The former and latter phases are indicated by unmarked peaks and solid triangles, respectively. In this XRD pattern, a peak, which was not corresponding to Ce2Fe14B and CeFe2 phases was detected at 30.3°, as indicated by the open circle. Although it was difficult to determine the phase from this single peak, Ce-rich phase was considered a possible candidate on account of the detection of Ce-rich phase in addition to Ce2Fe14B and CeFe2 phases in SEM images, as described later. Moreover, β-Ce48) (hexagonal, P63/mmc) and γ-Ce49) (cubic, Fm-3m) were possible, because they show diffraction peaks at 31.9° (β-Ce(102) plane) and 30.0° (γ-Ce(111) plane), respectively, which were close to that of observed one (30.3°). However, there is not enough evidence to determine the phase, therefore, it is referred to as “Ce-rich” in this manuscript. As shown in Fig. 3(b), upon H-treatment, all of the peaks corresponding to the three phases (Ce2Fe14B, CeFe2, and Ce-rich) identified in the as-prepared sample completely disappeared, and peaks corresponding to CeH2+x50) (cubic, Fm-3m), α-Fe51) (cubic, Im-3m), and Fe2B52) (tetragonal, I4/mcm) appeared. This result indicates that the H-treatment induced complete disproportionation to CeH2+x, α-Fe, and Fe2B phases. Then, as shown in Fig. 3(c), the CeH2+x, α-Fe, and Fe2B peaks entirely disappeared and the Ce2Fe14B, CeFe2, and Ce-rich peaks reappeared by V-treatment. Therefore, it is clear that the disproportionation and recombination reactions occur in the Ce–Fe–B system.

Because it was not possible to confirm whether refinement of the crystal grains had occurred after recombination solely from the XRD results, we also examined the sample microstructures. Figure 4(a), (b), and (c) present low- and high-magnification SEM images of the as-prepared, H-treat., and V-treat. samples, respectively. The yellow rectangles in the low-magnification images indicate the areas corresponding to high-magnification images. EDS analysis was performed from the points indicated by the plus symbols (“+”). The average composition analyzed by EDS are summarized in Table 1 (Here, it should be noted that numbers in Fig. 4 corresponds to the measuring point numbers in Table 1). In the as-prepared sample (Fig. 4(a)), three regions with different contrasts (dark gray, light gray, and white) were observed. From the EDS analysis, it was concluded that the dark gray phase was Ce2Fe14B because the composition ratio of Ce, Fe, and B was close to 2:14:1. Similarly, the light gray phase was determined to be CeFe2 because the composition ratio of Ce and Fe was close to 1:2. Furthermore, the white phase in Fig. 4 was considered to be Ce-rich because of high Ce content shown in Table 1. Although some amounts of Fe and B was detected from the Ce-rich phase, it can be originated from the surrounding phases because of limited spatial resolution of the SEM. The grain size of Ce2Fe14B was found to be several tens of micrometers, however the exact value could not be measured owing to induced cracks during polishing process for SEM observation. As shown in Fig. 4(b), two regions with different contrasts were observed in the H-treat. sample. From the EDS analysis of the H-treat. sample in Table 1, it can be concluded that the white phase was CeH2+x because of the high Ce content. Similar to the case of Ce-rich phase in the as-prepared sample, the inclusion of Fe and B can be originated from the surrounding phases. The dark gray phase in Fig. 4(b) was ascribed to α-Fe or Fe2B because the composition ratio of Fe and B was close to 1:0 or 2:1. Finally, after V-treatment, three phases were observed, namely, dark gray, light gray, and white, as shown in Fig. 4(c). Comparison analysis of the as-prepared and V-treat. samples in Table 1 revealed that the composition ratio of the phases, which have same contrasts, were almost identical, indicating that the dark gray, light gray, and white regions were Ce2Fe14B, CeFe2, and Ce-rich phases, respectively. These results confirm that a recombination reaction had occurred from the disproportionated state. The average grain size of Ce2Fe14B after the recombination reaction was found to be approximately 0.4–0.6 µm from the high-magnification image. Thus, it was confirmed that in the Ce–Fe–B system, as in the Nd–Fe–B system, the recombination reaction led to refinement of the crystal grains.

In the preceding subsection, we confirmed that the disproportionation and recombination reactions occur in the Ce–Fe–B system, but the detailed characteristics of these reactions should also be clarified. Therefore, this subsection discusses the temperature dependence of the recombination pressure in the HDDR reaction (PH2–T curve) to provide insights into the reaction behavior and determine the optimal disproportionation treatment conditions for obtaining highly anisotropic powders.
Figure 5 presents the hydrogen desorption characteristics of the Ce–Fe–B system during the dehydrogenation treatment, which were measured as described in Section 2. Figure 5(a) shows the dependence of the hydrogen flow rate Q on the dehydrogenation time tdeh. at 850°C. Figure 5(b) presents an enlarged view of the low-Q region in Fig. 5(a), and Fig. 5(c) shows the dependence of the hydrogen pressure PH2 on tdeh.. From Fig. 5(a) and (b), three peaks of Q corresponding to hydrogen desorption from the sample were observed over the course of the experiment. Considering Fig. 5(c), these peaks indicate that three reactions with different critical pressures for hydrogen desorption occurred in the Ce–Fe–B system during the dehydrogenation treatment. These peaks are denoted “peak 1”, “peak 2”, and “peak 3” in ascending order of appearance over time from the high-pressure side, and the starting pressures for hydrogen desorption were determined to be P(1)des. = 14.6 kPa, P(2)des. = 2.8 kPa, and P(3)des. = 0.8 kPa by the method and equations given in Section 2.

Next, XRD measurements were performed to examine the origin of each hydrogen desorption peak. From Fig. 5(a) and (b), it can be seen that the desorption process was almost complete at 60 min for peak 1, 110 min for peak 2, and 150 min for peak 3. Therefore, the XRD patterns were recorded for samples quenched at tdeh. values of 60, 110, and 150 min during the dehydrogenation treatment, and the results are presented in Fig. 6. At tdeh. = 60 min, the CeH2+x and α-Fe peaks had become smaller than those observed for the H-treat. sample (Fig. 3(b)), the Fe2B peak had disappeared completely, and the Ce2Fe14B peak had appeared. Next, at tdeh. = 110 min, the CeH2+x peak had become even smaller than that at tdeh. = 60 min and the α-Fe peak had disappeared completely, while the CeFe2 peak had appeared. Finally, at tdeh. = 150 min, the CeH2+x peak had completely disappeared and the Ce-rich peak had appeared. These results indicate that peak 1 and peak 2 correspond to the recombination reactions to Ce2Fe14B and CeFe2, respectively, while peak 3 is attributable to the hydrogen desorption reaction to Ce-rich.

The van’t Hoff plots were obtained by performing the dehydrogenation treatment at Tdeh. values of 760, 820, and 880°C then determining P(1)des., P(2)des., and P(3)des. at each temperature. The obtained results are summarized in Table 2(a). The same procedure was also performed for the Nd–Fe–B system, and the obtained results are summarized in Table 2(b). In the Nd–Fe–B system, only two types of hydrogen desorption behavior were observed, namely, the recombination reaction to Nd2Fe14B and hydrogen desorption to Nd-rich.

Table 2 Temperature dependence of the recombination pressure in the HDDR reactions of (a) Ce–Fe–B and (b) Nd–Fe–B alloys.
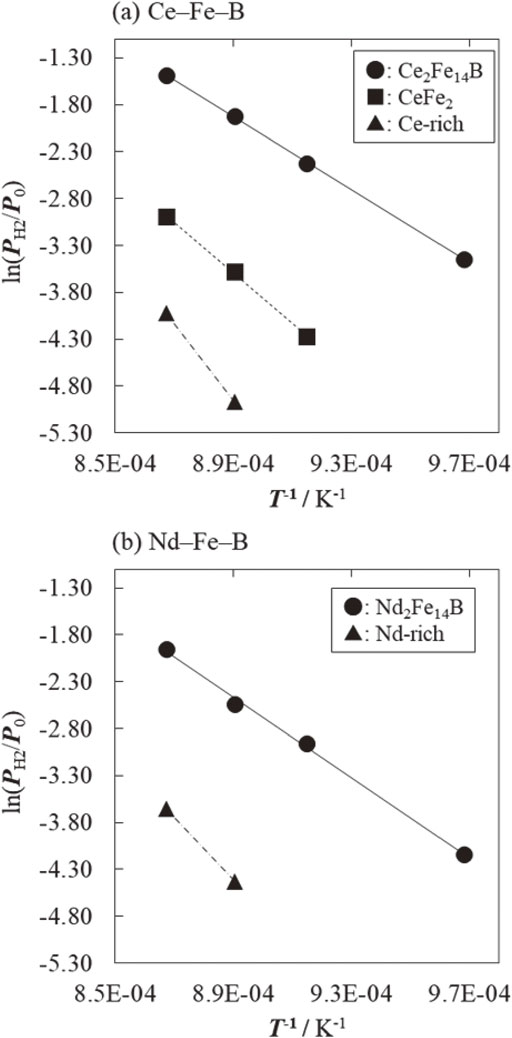
Figure 7(a) presents the van’t Hoff plots for the Tdeh. and Pdes. values of the recombination reactions to Ce2Fe14B and CeFe2 and the dehydrogenation reaction to Ce-rich for the Ce–Fe–B system. The corresponding plots for Nd2Fe14B and Nd-rich are shown in Fig. 7(b). The van’t Hoff equation was then used to obtain the ΔH0 and ΔS0 values for each reaction from the slope and intercept of each approximately straight line, and the results are summarized in Table 3(a) and (b) for the Ce–Fe–B and Nd–Fe–B systems. As shown in Table 3(b), the ΔH0 and ΔS0 values for the recombination reaction to Nd2Fe14B obtained in the present study are mostly consistent with those reported in a previous study,35) thus demonstrating the validity of our method. It can also be seen that the |ΔH0| and |ΔS0| values for Ce2Fe14B were smaller than those for both CeFe2 and Nd2Fe14B.

Table 3 Standard enthalpy and entropy changes in the recombination reactions of the (a) Ce–Fe–B and (b) Nd–Fe–B alloys.
Figure 8(a) and (b) show the obtained PH2–T curves for the Ce–Fe–B and Nd–Fe–B systems, respectively, which were plotted using the ΔH0 and ΔS0 values listed in Table 3 and the van’t Hoff equation. Figure 8(a) indicates that the recombination of Ce2Fe14B occurs at a higher pressure and lower temperature than that of CeFe2 across the entire temperature range investigated in this study. This means that, except for Ce-rich, which originates from simple hydrogen desorption, the recombination reaction in the Ce–Fe–B system is a two-step process that starts with Ce2Fe14B followed by CeFe2. In addition, comparison with Fig. 8(b) shows that the PH2–T curve for Ce2Fe14B is shifted to a higher pressure and lower temperature than that for Nd2Fe14B. In previous studies of the Nd–Fe–B system, it was found that disproportionation treatment in the vicinity of the PH2–T curve is important for achieving high anisotropy after the recombination reaction.34,35) Therefore, the results shown in Fig. 8 suggest that the optimal disproportionation conditions for realizing high anisotropy in the Ce–Fe–B system are shifted to a higher pressure and lower temperature compared with the Nd–Fe–B system.

4. Conclusion
The relationship between the hydrogen pressure and temperature (PH2–T curves) in the HDDR process was investigated to clarify the HDDR behavior of the Ce–Fe–B system and predict the optimal conditions for achieving high anisotropy. First, we confirmed that the disproportionation and recombination reactions of both Ce2Fe14B and CeFe2 occur in Ce–Fe–B alloys by XRD and SEM analysis. Second, the PH2–T curves for the Ce–Fe–B system were determined by investigating the hydrogen desorption characteristics associated with the recombination reaction, and it was found that the PH2–T curves for Ce2Fe14B and CeFe2 were clearly separated, with the latter curve located at a lower pressure and higher temperature than the former one. This suggests that for the Ce–Fe–B system disproportionation treatment under higher pressure and lower temperature than those used for the Nd–Fe–B system should be effective for obtaining highly anisotropic magnetic powders.
Acknowledgments
This work was partially supported by the Advanced Material Engineering Division of Toyota Motor Corporation, Japan.
REFERENCES
- 1) S. Sugimoto: J. Phys. D 44 (2011) 064001. doi:10.1088/0022-3727/44/6/064001
- 2) H. Nakamura, K. Hirota, M. Shimao, T. Minowa and M. Honshima: IEEE Trans. Magn. 41 (2005) 3844–3846. doi:10.1109/TMAG.2005.854874
- 3) H. Nakamura, K. Hirota, T. Minowa and M. Honshima: J. Magn. Soc. Jpn. 31 (2007) 6–11. doi:10.3379/jmsjmag.31.6
- 4) M. Sagawa and Y. Une: Proc. 20th Int. Workshop on Rare Earth Permanent Magnets and Their Applications, Crete, (2008) pp. 103–105.
- 5) H. Sepehri-Amin, Y. Une, T. Ohkubo, K. Hono and M. Sagawa: Scr. Mater. 65 (2011) 396–399. doi:10.1016/j.scriptamat.2011.05.006
- 6) Y. Une and M. Sagawa: J. Japan Inst. Metals 76 (2012) 12–16. doi:10.2320/jinstmet.76.12
- 7) R.W. Lee: Appl. Phys. Lett. 46 (1985) 790–791. doi:10.1063/1.95884
- 8) K. Hioki: J. Jpn. Soc. Powder Powder Metallurgy 69 (2022) S3–S13. doi:10.2497/jjspm.69.S3
- 9) T. Takeshita and R. Nakayama: Proc. 10th Int. Workshop on Rare-Earth Magnets and Their Applications, (1989) pp. 551–557.
- 10) H. Nakamura, R. Suefuji, S. Sugimoto, M. Okada and M. Homma: J. Appl. Phys. 76 (1994) 6828–6830. doi:10.1063/1.358144
- 11) H. Nakamura, K. Kato, D. Book, S. Sugimoto, M. Okada and M. Homma: Proc. 15th Int. Workshop on Rare Earth Magnets and their Applications, Dresden, (1998) pp. 507–516.
- 12) H. Nakamura, K. Kato, D. Book, S. Sugimoto, M. Okada and M. Homma: IEEE Trans. Magn. 35 (1999) 3274–3276. doi:10.1109/20.800496
- 13) K. Morimoto, Y. Ishii, R. Nakayama, M. Itakura, N. Kuwano and K. Oki: J. Jpn. Soc. Powder Powder Metallurgy 46 (1999) 51–56. doi:10.2497/jjspm.46.51
- 14) R. Nakayama, Y. Ishii and K. Morimoto: J. Magn. Soc. Jpn. 22 (1998) 361–364. doi:10.3379/jmsjmag.22.361
- 15) C. Mishima, N. Hamada, H. Mitarai and Y. Honkura: J. Magn. Soc. Jpn. 24 (2000) 407–410. doi:10.3379/jmsjmag.24.407
- 16) K. Hirota, H. Nakamura, T. Minowa and M. Honshima: IEEE Trans. Magn. 42 (2006) 2909–2911. doi:10.1109/TMAG.2006.879906
- 17) M. Nakamura, M. Matsuura, N. Tezuka, S. Sugimoto, Y. Une, H. Kubo and M. Sagawa: Appl. Phys. Lett. 103 (2013) 022404. doi:10.1063/1.4813399
- 18) M. Nakamura, M. Nakamura, M. Matsuura, N. Tezuka, S. Sugimoto, Y. Une, H. Kubo and M. Sagawa: Mater. Trans. 55 (2014) 1582–1586. doi:10.2320/matertrans.MAW201402
- 19) M. Nakamura, M. Matsuura, N. Tezuka, S. Sugimoto, Y. Une, H. Kubo and M. Sagawa: Mater. Trans. 56 (2015) 129–134. doi:10.2320/matertrans.M2014273
- 20) C. Mishima, K. Noguchi, M. Yamazaki, H. Mitarai and Y. Honkura: Proc. 21th Workshop on Rare Earth Permanent Magnets and Their Applications, Bled, Slovenia, (2010) pp. 253–256.
- 21) H. Sepehri Amin, T. Ohkubo, T. Nishiuchi, S. Hirosawa and K. Hono: Scr. Mater. 63 (2010) 1124–1127. doi:10.1016/j.scriptamat.2010.08.021
- 22) M. Okada and S. Sugimoto: J. Appl. Phys. 57 (1985) 4146–4148. doi:10.1063/1.334647
- 23) M. Zhu, W. Li, J. Wang, L. Zheng, Y. Li, K. Zhang, H. Feng and T. Liu: IEEE Trans. Magn. 50 (2014) 1000104. doi:10.1109/TMAG.2013.2278018
- 24) M. Ito, M. Yano, N. Sakuma, H. Kishimoto, A. Manabe and T. Shoji: AIP Adv. 6 (2016) 056029. doi:10.1063/1.4945040
- 25) T. Fukao and A. Chiba: IEEJ Trans. Ind. Appl. 118 (1998) 145–149. doi:10.1541/ieejias.118.145
- 26) M. Flink, M. Burghardt and R. Bittner: CTI SYMPOSIUM 2019, (2019) pp. 103–115.
- 27) M. Mileti, D. Schweigert, H. Pflaum and K. Stahl: CTI Symposium USA, (2019).
- 28) T. Fujimaki, M. Yamazaki, T. Horikawa and C. Mishima: J. Jpn. Soc. Powder Powder Metallurgy 69 (2022) 3–10. doi:10.2497/jjspm.69.3
- 29) K. Ito, Y. Hashiba, K. Sakai and T. Yagisawa: T. IEE Japan 118 (1998) 182–187. doi:10.1541/ieejfms1990.118.2_182
- 30) M. Shimada and Y. Kato: Denki Seiko 76 (2005) 195–202. doi:10.4262/denkiseiko.76.195
- 31) Y. Fukasaku: Japan Association of Bonded Magnetic Materials, 64th Technical Meeting, 5 (2003).
- 32) J.J. Croat, J.F. Herbst and R.W. Lee: J. Appl. Phys. 55 (1984) 2078–2082. doi:10.1063/1.333571
- 33) J.J. Croat, Z. Chen, P.C. Guschl and D.J. Miller: Proc. 19th International Workshop on Rare Earth Permanent Magnets & their Applications, Beijing (China), (2006).
- 34) H. Nakamura, S. Sugimoto, T. Tanaka, M. Okada and M. Homma: J. Alloy. Compd. 222 (1995) 136–140. doi:10.1016/0925-8388(94)04935-1
- 35) H. Nakamura, K. Kato, D. Book, S. Sugimoto, M. Okada and M. Homma: J. Magn. Soc. Japan 23 (1999) 300–305. doi:10.3379/jmsjmag.23.300
- 36) T. Tomida, P. Choi, Y. Maehara, M. Uehara, H. Tomizawa and S. Hirosawa: J. Alloy. Compd. 242 (1996) 129–135. doi:10.1016/0925-8388(96)02378-X
- 37) O. Gutfleisch, B. Gebel and N. Mattern: J. Magn. Magn. Mater. 210 (2000) 5–9. doi:10.1016/S0304-8853(99)00702-7
- 38) R. Takizawa, M. Itakura, N. Katayama and K. Morimoto: J. Magn. Magn. Mater. 433 (2017) 187–194. doi:10.1016/j.jmmm.2017.03.014
- 39) S. Sugimoto, S. Ohga, K. Inomata, K. Suzuki, T. Konno and K. Hiraga: IEEE Trans. Magn. 38 (2002) 2961–2963. doi:10.1109/TMAG.2002.803079
- 40) T. Horikawa, M. Matsuura, S. Sugimoto, M. Yamazaki and C. Mishima: AIP Adv. 6 (2016) 056017. doi:10.1063/1.4944073
- 41) M. Yamazaki, T. Horikawa and C. Mishima: AIP Adv. 7 (2017) 056220. doi:10.1063/1.4975697
- 42) T. Horikawa, M. Yamazaki, C. Mishima, M. Matsuura and S. Sugimoto: AIP Adv. 9 (2019) 035244. doi:10.1063/1.5079953
- 43) M. Yamazaki and S. Sugimoto: Patent WO 2020/017529 A1 (2020).
- 44) M. Yamazaki, T. Horikawa, C. Mishima, M. Matsuura and S. Sugimoto: Presented at 2021 Annual Spring (168th) Meeting of The Japan Institute of Metals and Materials, (2021) S1.11.
- 45) M. Xing, J. Han, Z. Lin, F.M. Wan, C. Li, S. Liu, C. Wang, J. Yang and Y. Yang: J. Magn. Magn. Mater. 331 (2013) 140–143. doi:10.1016/j.jmmm.2012.11.035
- 46) C.D. Fuerst, T.W. Capehart, F.E. Pinkerton and J.F. Herbst: J. Magn. Magn. Mater. 139 (1995) 359–363. doi:10.1016/0304-8853(95)90015-2
- 47) N.H. Duc and T.D. Hien: J. Magn. Magn. Mater. 140–144 (1995) 1113–1114. doi:10.1016/0304-8853(94)01284-9
- 48) I.R. Harris and J.D. Speight: J. Less-Common Met. 114 (1985) 183–197. doi:10.1016/0022-5088(85)90401-1
- 49) G. Oomi: J. Phys. Soc. Jpn. 48 (1980) 857–864. doi:10.1143/JPSJ.48.857
- 50) S.P. Shilkin, L.S. Volkova and V.N. Fokin: Russ. J. Inorg. Chem. 39 (1994) 183–186.
- 51) E.P. Yelsukov, E.V. Voronina and V.A. Barinov: J. Magn. Magn. Mater. 115 (1992) 271–280. doi:10.1016/0304-8853(92)90069-Z
- 52) C. Gianoglio and C. Badini: J. Mater. Sci. 21 (1986) 4331–4334. doi:10.1007/BF01106551