3. Experimental Results and Discussion
3.1 Microstructural observation of initial material
Figure 1 shows the results of observation using a polarizing microscope on the L-ST sections (sections parallel to the extrusion direction and the thickness direction) of the specimen No. 1B, 2B and 3B before long-time aging. This figure also shows previously reported B-free alloys (the specimen No. 1, No. 2 and No. 3) with approximately the same amount of Mg addition for comparison. First, fiber microstructure was observed in the B-added alloys (the specimen No. 1B, 2B and 3B) as well as in the B-free alloys, and the grain size was similar regardless of the Mg concentration. The grain size was determined by the intercept method for the optical micrographs in Fig. 1. The results are shown in Table 2. Although this method is not suitable for the accurate evaluation of grain size because it evaluates grains with a three-dimensional shape by cutting out a certain section, it was used as an index for the relative evaluation of the effect of B addition on grain size in this study. From Fig. 1 and Table 2, it can be seen that the grain size of the B-added alloys is smaller than that of the B-free alloys. This is considered to be the refinement effect due to AlB2 particles8) present in the Al–4 mass%B master alloy9) used for the composition adjustment in this study.


Table 2 Average intercept length of each specimen by the intercept method. The values of row (a) and (b) were evaluated using these optical micrographs (OM) and TEM micrographs, respectively.
Figure 2 shows the SEM microstructure obtained in the L-ST sections of the specimen No. 1B, No. 2B and No. 3B before long-time aging. This figure also shows the observation results of B-free alloys. The black dispersed particles found only in B-added alloys correspond to AlB2. White dispersed particles found in both B-added and B-free alloys correspond to crystallized particles or coarsely grown precipitates such as Al6Mn. The size and distribution of these dispersed particles were not affected by the amount of Mg addition.

Figure 3 shows the TEM microstructure obtained in the L-ST section of B-added alloys before aging treatment. This figure also shows the observation results of B-free alloys. In the TEM microstructure of the specimen No. 1, granular precipitates are indicated by dashed lines and plate-like precipitates are indicated by arrows, and similar precipitates are observed in the subgrains of all specimens. There is little effect of Mg addition or B addition on the size and dispersion state of these precipitates. The mean section length of the subcrystal structure was determined using the intercept method for the TEM microstructures in Fig. 3. The results are shown in Table 2. The table shows that the effect of the amount of Mg addition on the average section length of subgrain structure is small. When examined in detail, the average section length tends to increase slightly as the amount of Mg addition decreases. The subgrain structure is formed by the recovery during hot extrusion, and an increase in the solid solution Mg may have affected the refinement of the microstructure because it inhibits the movement of the subgrain boundaries. Moreover, the effect of B addition is hardly observed. This is considered to be because the size of the B compounds is about 5 µm, which is larger than that of the subgrain structure, and thus has less pinning effect on the subgrain boundary and does not affect the recovery. Figure 4 shows the results of TEM-EDX analysis for plate-like and granular precipitates. The samples to be analyzed were taken from the threaded area of the specimen after tensile test of the specimen No. 1B which had been aged at 200°C for 1.00 × 10⁴ h. Dislocations were densely introduced into the threaded area due to loading during the tensile test. Therefore, the TEM image of Fig. 4 was taken by tilting the thin film so that the dislocation structure was not conspicuous. TEM-EDX results showed that Al and Mn were mainly detected in the plate-like precipitates, whereas Al, Mn and trace amounts of Si were detected in the granular precipitates. Nakayasu et al. reported that precipitates in Al–0.99 Mn–1.01 Mg–0.26Fe–0.15Si alloy (mass%) after homogenization were plate-like: Al6(Mn, Fe) and granular: α-Al (Mn, Fe) Si,10) and it is considered that the same tendency was confirmed in this study. Since the dispersed particles of AlB2 are relatively large (about 5 microns in diameter) and are more suitable for observation by SEM, they were not used for TEM observation. The AlB2 of the Al–B master alloy used in this study is produced by crystallization, therefore it is difficult to obtain a fine size of less than 1 µm like precipitated particles. In addition, the molten metal temperature in the atmospheric melting of the specimen is controlled in the range of 800°C or less, which is sufficiently low compared with the transformation temperature of AlB2 of 980°C,5) and it is considered that the re-dissolution of AlB2 hardly occurs in the manufacturing process of the specimen.

Figure 5 shows the results of EPMA area analysis on No. 1B and No. 3B specimens before and after aging treatment. First, the specimen No. 1B (1.02 mass%Mg) before aging shown in Fig. 5(a) is explained. The intermetallic compounds corresponding to the black contrast shown in the COMPO image are judged to be AlB2, as described above, because the Al concentration decreases and B is enriched compared with the matrix. In this AlB2, the presence of Mg is observed. When solid AlB2 is dispersed in molten aluminum containing Mg, it is known that Mg penetrates into AlB2 and dissolves in solid solution by substitution with Al atoms,11) and it is considered that a similar phenomenon occurred during the atmospheric melting of this alloy. Figure 5(b) shows the observation results that there is little change observed in B compounds after holding the specimen No. 1B at 200°C for 1.00 × 10⁴ h. Additional microstructural changes such as precipitation were not observed in the aluminum matrix. Next, Fig. 5(c) shows the observation results of No. 3B (2.99 mass%Mg) before aging treatment. First, the elemental mapping image of Mg shows an increase in the Mg concentration in the aluminum matrix compared with the specimen No. 1B. On the other hand, for B compounds, little change in the Mg concentration was observed. Figure 5(d) shows the observation results after holding the specimen No. 3B at 125°C for 1.00 × 10⁴ h, and little change is observed in B compounds compared with before aging treatment. In the COMPO image and the elemental mapping image of Mg, precipitates that had not been observed before the aging treatment were produced, which are indicated by arrows and dashed lines. This precipitate is considered to be the β phase (Al3Mg2), the reason for which is explained later. Although not shown here, with regard to specimen No. 1B, no precipitation of the β phase could be confirmed, although the microstructural observation by EPMA was carried out for all aged specimens at four temperature conditions (Hold at 125, 150, 175 and 200°C for up to 1.00 × 10⁴ h). This is considered to be because the amount of Mg addition to the specimen No. 1B was low and the supersaturation was too small, which resulted in little precipitation of the β phase. The supersaturation increases with decreasing temperature for the same amount of Mg addition, but it is less than 0 even at 125°C, the lowest aging temperature in this study, when the supersaturation of the specimen No. 1B is evaluated using the solid solution limit curve of Al–Mg alloy.12) Also in Fig. 5, B compounds are about 5 µm in size. From the viewpoint of criticality prevention in a cask system containing spent fuels, it is qualitatively advantageous that the number density increases as the B compounds become finer if the volume fraction is the same. In the authors’ cask design example, the critical analysis code KENO-V.a13) of the SCALE code system confirms that even when the size of the B compounds are more coarse (40 µm), it is not much different from the most ideal homogenization model. Therefore, it is considered that there is no problem at all from the viewpoint of critical analysis as long as the amount of the B compound satisfies the size level in Fig. 5.

Based on the presence of Mg in AlB2 by EPMA area analysis, identification analysis of B compounds by XRD analysis were carried out using the specimen No. 1B and No. 3B. In this study, B compounds were not detected in the analysis for bulk materials. This may be due to the small amount of B addition about 1 mass%. Therefore, we dissolved the matrix with thermal phenol and performed XRD analysis on the extracted residue collected by filtration. Figure 6(a) shows the analytical results of the initial and aged specimen before and after aging at 125, 150, 175 and 200°C for 1.00 × 10⁴ h of the specimen No. 1B. B compounds were identified as (Al0.72Mg0.2)B2 (ICDD card number: 01-081-9252) in all extraction residues. The red arrow in the figure indicates the diffraction peak used to identify B compounds in this analysis. This peak position is thought to vary depending on the amount of Mg in the B compounds, but the peaks indicated by red arrows tend to be almost identical among the compared specimens. Therefore, it is considered that there is little interaction between the B compounds and Mg dissolved in the aluminum matrix during aging of the specimen No. 1B. Figure 6(b) shows the analytical results for the extraction residue of the initial material and aged material (sample kept at 125 and 200°C for 1.00 × 10⁴ h) of the specimen No. 3B. B compounds were detected as (Al0.9Mg0.1)B2 (ICDD card number: 04-017-6849) in all samples. In the specimen No. 3B, the position of the diffraction peak by aging treatment hardly changed. Therefore, it is considered that the amount of Mg in B compounds of the specimen No. 3B hardly changes by aging treatment.

Although the specimen No. 3B contained more Mg than the specimen No. 1B, the amount of Mg dissolved in the B compounds decreased. As mentioned above, the phenomenon of substitution and dissolution of Mg into the B compound is considered to occur in atmospheric melting, but the process conditions during casting, such as molten metal temperature and holding time, were almost the same for the specimen No. 1B and No. 3B. Therefore, it is not clear what affected the amount of Mg in B compounds. This point was not included in the scope of this study. Although not shown here, XRD analysis of an extruded shape fabricated in the same manner by molding an actual scale billet (φ395 mm) of Al–1.36Mn–1.20Mg–1.10B–0.17Si–0.16Fe alloy (mass%) revealed that B compounds were detected as (Al0.72Mg0.2)B2, similar to the specimen No. 1B. Furthermore, the recycled ingots were prepared by remelting the alloy and XRD analysis was performed, then B compounds were again detected as (Al0.72Mg0.2)B2. Therefore, under our casting conditions, it is considered that (Al0.72Mg0.2)B2 is almost the equilibrium composition of B compounds at Mg addition of about 1 mass%.
3.3 Model of precipitation phenomena
3.3.1 Assumptions for model
As in the previous paper, the specimens in this study were extruded through homogenization heat treatment and then O-temper treatment, additionally because the solid solution limit of Mn in the aluminum matrix was very small, it is considered that the precipitation of Mn-based compounds such as Al6Mn is almost complete before the long-time aging treatment. B is added in the chemical form of AlB2 during atmospheric melting as described above, but the limit of B solubility in the solid phase is extremely small,5) so solute B is thought to be almost absent in the aluminum matrix. As for Mg, the solid solution limit at the O-temper treatment temperature (345°C) of the present study is very large (about 10 mass%14)), and it is considered that there are almost no Mg compounds in the aluminum matrix. Although the above EPMA and XRD analyses confirmed that some of the Mg was substituted solid solution in the B compounds, the amount of Mg in the B compounds did not change during the long-time aging treatment in this study. Therefore, the aluminum matrix in the initial state of the sample was considered to be a solid solution of only Mg, and the only precipitate produced by long-time aging treatment was the β phase.
Other microstructural changes that should be assumed under the usage environment of casks include a decrease in the number density associated with the coarsening of precipitates of Mn compounds. This phenomenon is thought to be caused by the diffusion control of Mn atoms in the aluminum matrix. Using the diffusion distance of Mn atoms as an index, we set 300°C for 1,000 h as an accelerated test condition to cover the 60 years thermal history in the cask. Tensile tests and TEM observations were carried out before and after this accelerated test, and it was confirmed that little change was observed in the strength of the alloy and the dispersion state (particle size and density) of the Mn compounds before and after this accelerated test.
In the previous article, the total amount of Mg addition to each sample was treated as existing in the aluminum matrix, but in this paper, the amount of Mg absorbed by the B compounds was considered. Based on the above assumptions, it was concluded that although the sample in this study is a multi-component alloy containing Mg, Mn, B, etc., the precipitation phenomenon of the β phase can be treated by assuming that it follows the solid solution limit curve12) of the Al–Mg alloy as in the previous article. In addition, various nucleation sites assumed for the precipitation of the β phase were treated comprehensively without distinction as in the previous article. It is also assumed that nucleation and growth of the β phase are controlled by the diffusion process of Mg in the aluminum matrix.
3.3.2 Nucleation and growth
The nucleation of the precipitation was analyzed using the following eq. (1) as in the previous article, and the TTP diagram was described,
| \begin{equation}
t^{*} = \frac{k_{1}}{I_{0}}\exp \left(\frac{Q_{d}}{RT}\right)\exp \left(\cfrac{k_{2}}{R}\cfrac{1}{T^{3}\biggl\{ (1 - C_{\textit{Mg}}^{\beta}) \ln \cfrac{1 - C_{\textit{eq}}}{1 - C} + C_{\textit{Mg}}^{\beta} \ln \cfrac{C_{\textit{eq}}}{C} \biggr\}^{2}} \right),
\end{equation}
| (1) |
t*: onset time of precipitation, I0: number of nucleation sites in unit volume, Qd: activation energy of diffusion in aluminum matrix (121 kJ/mol),15) R: gas constant (8.314 J/mol K), T: temperature (K), $ C_{\textit{Mg}}^{\beta }$: Mg concentration in the precipitated phase (0.385),12,14) Ceq: Mg solid solubility limit in aluminum (at%), C: Mg content in solid solution (at%), k1 and k2: constants.
The growth behavior of the produced nuclei was analyzed using so-called Avrami plots. Specifically, the dependence of the precipitation reaction rate f (0 ≦ f ≦ 1) on time t was analyzed by the modified eq. (3) derived from eq. (2) of the Johnson-Mehl-Avrami equation, and the reaction rate constant K and the time exponent n were obtained,
| \begin{equation}
f = 1 - \exp (-Kt^{n}),
\end{equation}
| (2) |
| \begin{equation}
\ln\ln \frac{1}{1 - f} = \ln K + n\ln t.
\end{equation}
| (3) |
Specific evaluation results using the data of this study is discussed later.
3.4 Resistance change during aging process
Figure 7 shows the variations of the resistivity during the long-time aging treatment at 150°C. The figure also shows data for B-free alloys for comparison. No significant change was observed for the specimen No. 1B and No. 2B after aging for 1.00 × 10⁴ h. This tendency is the same as that of the specimen No. 1 and No. 2 which contain almost the same amount of Mg. A slight downward trend was observed for the specimen No. 3B after 2,500 h. This degree was equivalent to that of the specimen No. 3 which contained almost the same amount of Mg. Although not shown here, a decreasing trend of specific resistance was also observed in the long-time aging at holding temperatures of 125, 175 and 200°C. These variations in resistivity are considered to reflect the precipitation of supersaturated solid solution Mg as β phase and the decrease in solid solution Mg concentration in the matrix.

Figure 8 shows the Avrami plot obtained by analyzing the variation of the resistivity of the specimen No. 3B at 150°C using the eq. (3). The assumptions used in this analysis are described below. The reaction rate at the onset of precipitation was defined as f = 0.10, as in the previous article. The reaction rate f is the ratio of the amount of precipitated Mg to the amount of supersaturated Mg in the aluminum matrix in the initial state. The amount of solid solution Mg in the supersaturated state can be obtained as the difference between the amount of solid solution Mg in the aluminum matrix in the initial state and the limit of solution at each holding temperature.12) As mentioned above, a part of Mg is infiltrated and dissolved in AlB2 dispersed in the aluminum matrix in the specimens of this study. Since B compounds contained in the specimen No. 3B were identified as (Al0.9Mg0.1)B2 by XRD analysis, the amount of Mg incorporated into B compounds was estimated to be 0.13 at%, based on the fact that the amount of Mg incorporated into B compounds was 5% of the amount of B added (at%) by the composition ratio. This value was subtracted from the amount of Mg added (at%), and the amount of solid solution Mg in the initial state was estimated to be 3.47 at%. This value was used to analyze the Avrami plot. For the specimen No. 3, which has the same amount of Mg addition, the amount of solid solution Mg in the initial state is estimated to be 3.49 at%. The total amount of Mn addition to the sample was assumed to exist as Al6Mn because the amount of Si addition was very small. The amount of solid solution Mg mentioned above was evaluated by considering the amount of Al that decreases due to this assumption. The Al content was estimated to be 4.52 at% for the specimen No. 3B and 4.44 at% for the specimen No. 3, using the stoichiometric composition of Al6Mn and the amount of Mn addition in each specimen. Similarly, the amount of Al decreased by the formation of (Al0.9Mg0.1)B2 was estimated to be 1.16 at% using the composition of the compounds and the amount of B addition. In the above calculation, the chemical composition of each specimen as shown in Table 1(b) was converted to atomic fractions. In this calculation, the presence of very small amounts of Si and Fe addition was ignored. In order to evaluate the amount of precipitated Mg from the change in resistivity, Willey’s specific resistivity contribution of solid solution Mg and Mg-based precipitates16) was used.

For comparison, Fig. 8 also shows the analytical results of the specimen No. 3 which does not contain B and has the same amount of Mg addition as that of the specimen No. 3B. From this figure, the two Avrami plots show almost equivalent trends. Although not shown here, this tendency was also observed at the holding temperatures of 125 and 175°C. Even at the holding temperature of 200°C, the tendency of change in the resistivity was observed, but the degree of change was too small to be analyzed by the Avrami plot as with the specimen No. 3 in the previous paper.
From the above Avrami plots, the time exponent n and the reaction rate constant K were obtained, and the precipitation start time t* corresponding to f = 0.10 was evaluated using eq. (2).
3.5 Effect of B addition on TTP diagram
The results of plotting the onset time of precipitation for the specimen No. 3B are shown in Fig. 9. This onset time of precipitation was curve-fitted by regression analysis using eq. (1). The resulting TTP diagram is also shown in Fig. 9. Regression analysis yielded the following constants:
| \begin{equation}
\text{TTP (No. 3B):}\ \frac{k_{1}}{I_{0}} = 1.29 \times 10^{-9},\ k_{2} = 7.90 \times 10^{7}.
\end{equation}
| (4) |
Figure 9 also shows the TTP diagrams of the specimen No. 3, No. 4 and No. 5 for comparison. From this figure, it can be seen that the TTP diagrams of the specimen No. 3B and No. 3, which have almost the same amount of Mg addition, tend to be almost identical.
As mentioned above, it is clear that the addition of B caused the following three microstructural changes in the specimens in this study. The first is the grain refinement shown in Fig. 1, the second is the dispersion of B compounds shown in Fig. 2, and the third is the penetration solid solution of Mg into B compounds shown in Fig. 5. The first and second microstructural changes are in the direction of increasing the heterogeneous nucleation sites of the β phase, i.e., in the direction of increasing the precipitation rate. The third microstructural change is the direction in which the amount of solid solution Mg in the aluminum matrix decreases, i.e., the precipitation rate decreases. However, as mentioned above, the amount of solid solution Mg in the initial state was almost the same between the specimen No. 3B and No. 3. Therefore, the third microstructural change may have had little effect on the precipitation rate of the β phase as a result. As for the first and second microstructural changes, the TTP diagrams of the specimen No. 3B and No. 3 shown in Fig. 9 almost coincided with each other, suggesting that they had little effect on the precipitation rate of the β phase. Therefore, the grain boundary and the interface of the B compounds are judged to have very small contributions as nucleation sites of the β phase.
In order to examine this point in more detail, we evaluated the interfacial area of these specimens focusing on various nucleation sites. Figure 10 shows the TEM microstructure of the specimen No. 5 aged at 175°C for up to 1.01 × 10³ h. The irregularly shaped precipitates shown by both the dashed lines and arrows in the photographs are presumed to be the β phase. The precipitates of the Mn compounds in this study are relatively granular or plate-like as seen in Fig. 3, and the longitudinal direction of the plate-like precipitates tends to roughly coincide with the extrusion direction (the left and right direction of the paper). Since the irregularly shaped precipitates shown in Fig. 10 are hardly observed in Fig. 3, which shows the TEM microstructure of the initial specimen, it is considered to be a newly generated phase due to aging treatment. As mentioned above, only the β phase can occur as a new phase in this specimen. These precipitates appear to have nucleation sites mainly at subgrain boundaries and at the interface of Mn compounds. However, since grain boundaries and B compound interfaces can also contribute as nucleation sites, we performed image analysis on these four microstructural factors in this study. Dislocations are found in the dark subgrains located in the lower part of Fig. 10. Multiple precipitates were also observed on these dislocations, and even these may contain the β phase, but were not included in the microstructural analysis in this study. This is because, as mentioned above, all the specimens in this study underwent O-temper treatment, and it is considered that there is little difference in dislocation densities among the specimens, and therefore, the precipitation rate of the β phase is not affected.

Interfacial area SV of grains and subgrains was evaluated by eq. (5)17) using the average section length $\bar{l}$ shown in Table 2.
| \begin{equation}
S_{V} = 2/\bar{l}
\end{equation}
| (5) |
Although this formula can be used basically regardless of the shape of the grains, it should be noted that the interfacial area of the grain is overestimated when it is applied to fiber microstructures such as these specimens. The interfacial area of dispersed particles was evaluated by image analysis for SEM and TEM images. Mn and B compounds are dispersed in the specimen No. 3B. In Fig. 2, two SEM images of No. 3B were shown, and the intermetallic compounds shown by white contrast in the upper normal magnification image were evaluated as Mn compounds, and the intermetallic compounds shown by black contrast in the lower low magnification image were evaluated as B compounds. The intermetallic compounds identified in the TEM image of No. 3B shown in Fig. 3 were evaluated as Mn compounds. Since Mn compounds are evaluated using both SEM and TEM images, in order to avoid double counting, Mn compounds with circle equivalent diameters of equal or larger than than 1 µm in the SEM image and less than 1 µm in the TEM image were evaluated, respectively. For the interfacial area of dispersed particles, the surface area of a sphere corresponding to the circle equivalent diameter of individual dispersed particles was first obtained, and the average value was evaluated for each image. The average surface area of dispersed particles thus obtained was multiplied by the number density to obtain the interfacial area per unit volume. The number density was obtained for SEM images by assuming that the dispersed particles displayed in each image were similarly distributed in the depth direction of the image. That is, the number density of surfaces evaluated in each image was raised to a power of 3/2 to obtain the number density of solids. For TEM images, the number density of dispersed particles was evaluated with the thickness of the thin film as 100 nm. The interfacial area of each microstructural factor thus obtained is shown in Table 3.

Table 3 Evaluation results of interfacial area of grain and dispersed particle in unit volume.
First, the interfacial area of grains in the specimen No. 3B increased by about 74% compared with that of No. 3 due to the effect of grain refinement by the B compounds. Next, the subgrain structure had almost the same interfacial area between No. 3B and No. 3. The value is about one order of magnitude larger than that of the grain. It is thought that the β phase precipitates densely at subgrain boundaries, while it precipitates discontinuously and sparsely at grain boundaries.18) Therefore, the reason why the difference in the grain boundary area with respect to the grain structure was not reflected in the TTP diagram is that the interfacial area of the grain was smaller than that of the subgrain and that the β phase was less likely to precipitate at the grain boundary than at the subgrain boundary.
For the third Mn compounds, the results show that the interfacial area of fine precipitates smaller than 1 µm is larger by more than two orders of magnitude compared with coarse precipitates equal or larger than 1 µm. In general, in Al–Mg alloys, Al6Mn is known to function as a heterogeneous nucleation site for the β phase.19) Therefore, it is considered that most of the β phase precipitating at the interface of Mn compounds as a nucleation site occurs in this fine precipitate. The interfacial area of Mn compounds in the specimen No. 3B was about 34% larger than that in the specimen No. 3. From Fig. 10, it is considered that the Mn compounds are one of the main nucleation sites of the β phase, therefore, if the interfacial area of the Mn compounds as a whole material is so large, the effect is likely to be reflected in the TTP diagram. Therefore, the difference in the interfacial area is considered to be the effect of the wide dispersing variation by the observation point. According to the results of image analysis for TEM images, the average diameter of equivalent circle of Mn compounds less than 1 µm was about 0.24 µm for both samples, but the number density was about 10.9 µm−3 for the specimen No. 3B and about 8.5 µm−3 for the specimen No. 3. As is well known, the field of view of the TEM image is very narrow, which is probably affected by small differences in the number density of Mn compounds depending on the observation point. Therefore, if the number of TEM images obtained is increased, the effect of variation by observation site may decrease and the results may be consistent with the comparison of the C curves, however the evaluation by image analysis in this study was carried out for the purpose of semi-quantitative evaluation of the effect of each microstructural factor on the nucleation site of the β phase, and therefore, the measurement of the accurate number density of Mn compounds, etc. was not the subject of this study. The grain boundary area of the subgrain structure described above was also evaluated based on image analysis of TEM photographs, however the variation among the specimens is relatively small. This may be because the subgrain structure had a more uniform structure compared to the precipitated structure of the Mn compounds.
For the fourth, the interfacial area of B compounds resulted in about three orders of magnitude smaller compared to that of the subgrain structure and Mn compounds less than 1 µm. If the easiness of precipitation of the β phase at the interface between the B compounds and the Mn compounds is similar, the amount of the β phase that precipitates at the interface of the B compounds is extremely small, and thus the precipitation rate of the β phase is probably little affected.
The results of the above image analysis are summarized into the following three points. First, it was confirmed from the viewpoint of the microstructure that the grain refinement and the dispersion of B compounds by B addition hardly contributed to the precipitation of the β phase, as estimated from the comparison of C curves for the specimen No. 3B and No. 3, and second, the interfacial area of the subgrain structure was not affected by B addition. Third, it was confirmed that the subgrain boundary and the interface of the Mn compounds are the main nucleation sites of the β phase. Since the alloy is treated with O temper as described above, the recovery is almost completed and the change in subgrain structure due to the thermal history in the cask is unlikely to occur. If subgrains were grown by this thermal history, the grain boundary area would decrease, but such a microstructural change would not be a problem because it would decrease the precipitation rate of solid solution Mg, i.e., it would maintain solid solution strengthening.
3.6 Effect of Mn addition on TTP diagram
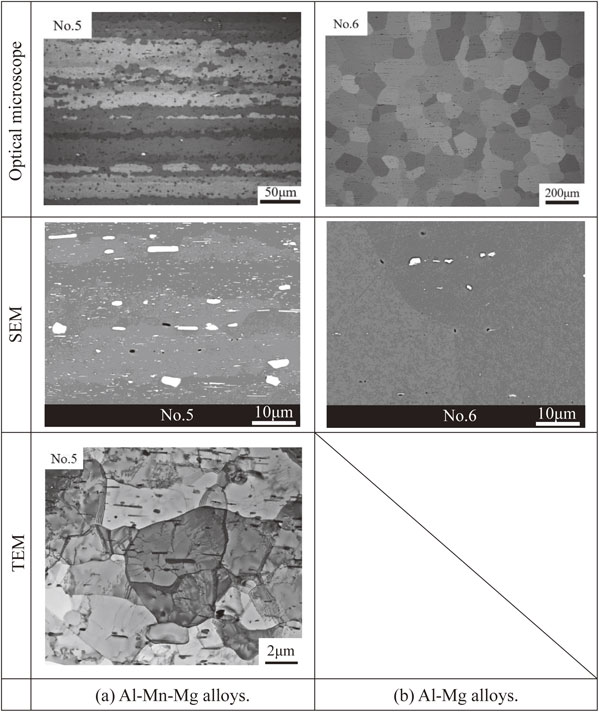
Figure 9 also shows the C curves of the specimen No. 5 and No. 6 reported in the previous article. The C curve of the specimen No. 6 deviated to the area for a considerably longer time side compared with that of the specimen No. 5. This reason was evaluated in the same way as the effect of B addition described above. As shown in Table 1, both of these specimens contain about 5 mass% of Mg, but the specimen No. 6 differs in that it does not contain Mn which is about 1.5 mass% in No. 5.
The optical micrographs and SEM images obtained for these specimens are shown in Fig. 11. TEM observation was performed only for the specimen No. 5 to which Mn was added. Image analysis was performed on these images as in the previous section. The interfacial area of the grain of specimen No. 6 can be accurately evaluated by eq. (5), because the specimen No. 6 has an equiaxed grain structure while the specimen No. 5 has a fiber structure like the specimen No. 3, etc. In addition, it was assumed that there were no fine dispersoids or subgrains to be observed by TEM because Mn was not added to the specimen No. 6 and the specimen had a recrystallized microstructure. The compounds shown in white contrast in the SEM image of the specimen No. 6 were considered to be Fe compounds from the chemical composition and the manufacturing process, and these dispersed particles were analyzed in this image.
The results of image analysis are shown in Table 3. First, regarding the grain structure, the interfacial area of the specimen No. 5 is about 77% larger than that of the specimen No. 6. This difference is comparable to the difference between the specimen No. 3B and No. 3 studied in the previous section. In the previous section, it was explained that the effect of the difference in interfacial area of grain structure on the precipitation of β phase is considered to be very small. In this point of view, it is considered that the difference in the interfacial area has little effect on the difference in the C curves for the specimen No. 5 and No. 6. Next, regarding the subgrain structure, the interfacial area of the specimen No. 5 was almost equal to that of the specimen No. 3B and No. 3. As described above, the subgrain structure of the specimen No. 6 is thought to be almost nonexistent, and this difference seems to have a very large effect on the precipitation behavior of the β phase. For the Mn compounds, the interfacial area of the specimen No. 5 was about 16% smaller than that of the specimen No. 3, which is considered to be due to the effect of the variation due to the observation points as described above. The interfacial area of the Fe compounds dispersed in the specimen No. 6 is about three orders of magnitude smaller than that of the Mn compounds in the specimen No. 5. The difference in the interfacial area of the dispersed phase may also have had a significant effect on the precipitation rate, assuming that the easiness of precipitation of the β phase at the interface between the Mn and Fe compounds is comparable.
3.7 Effect of B addition on SLP diagrams
The TTP diagrams described above can not be directly used to assess microstructure after 60 years of cask service. This is because, in the basket material of the cask, the amount of Mg addition is about 1 mass%, and in this study, the specimen No. 1B, which is equivalent to an actual equipment material, was prepared and subjected to heat treatment for a long time, but no change in resistivity was observed at any holding temperature, and the TTP diagram could not be evaluated. Therefore, it is necessary that an evaluation method that directly compares the conditions under which the TTP diagram could be evaluated with the conditions under which the actual equipment material was used, that is the SLP diagram described in the previous article. In this SLP diagram, the amount of solid solution Mg in the aluminum matrix in the initial state is replaced by the supersaturation shown in eq. (6). Note that the supersaturation varies with temperature because the Mg solubility limit is included in the equation.
| \begin{equation}
S = \frac{C - C_{\textit{eq}}}{C_{\textit{eq}}}.
\end{equation}
| (6) |
The precipitation start time of the TTP diagram is applied to the diffusion distance shown in eq. (7),
| \begin{equation}
L^{*} = \sqrt{2Dt^{*}},
\end{equation}
| (7) |
where, D is the diffusion coefficient of the solid solution Mg atom and is expressed by eq. (8),
| \begin{equation}
D = D_{0}\exp \left( -\frac{Q_{d}}{RT} \right),
\end{equation}
| (8) |
D0: Frequency factor (0.1 cm2/s),15) Qd: activation energy of diffusion in aluminum matrix (121 kJ/mol).15)
The diffusion distance obtained by eq. (7) is corrected by the third root of the amount of solid solution Mg by eq. (9) and used in the SLP diagram,
| \begin{equation}
L^{*\prime} = L^{*} \times \root 3 \of {C(\textit{at}\%)/1.0(\textit{at}\%)}.
\end{equation}
| (9) |
The SLP diagram thus evaluated is shown in Fig. 12. The figure also shows the results for the specimen No. 3, No. 4 and No. 5, which do not contain boron for comparison. In Fig. 12, the SLP diagram obtained by this study tends to almost match that in the previous report. In the SLP diagram, since precipitation does not occur in the region on the origin side of the precipitation start line, it can be judged that the strength decrease does not occur due to the decrease in the amount of solid solution Mg if the actual equipment condition exists in that region. In Fig. 12, the condition of an Al–1.5Mn–1.0Mg–1.0B alloy (mass%) with the Mg addition content of 1.0 mass%, maintained at a constant temperature for 60 years, which is assumed the material for practical use, is shown by a double-dotted red line. As representative points, the conditions for holding at 50, 75 and 100°C for 60 years are plotted on this line. Equation (7) and (9) were used to calculate the diffusion distance, and t* in eq. (7) was substituted with the value of 60 years in seconds. This curve, called the 60-year-reference line, represents the actual equipment conditions in the SLP diagram. In Fig. 12, for comparison, the 60-year-reference line for the Al–1.5Mn–1.0Mg alloy (mass%) without B addition is shown as a double dotted black line. As mentioned above, it has been confirmed that the B compounds exist as (Al0.72Mg0.2)B2 in the specimen No. 1B, which has the amount of Mg addition equivalent to the actual equipment material. Because of this, the amount of solid solution Mg in the aluminum matrix at the early stage of storage decreases and the supersaturation of Mg decreases accordingly, the 60-year-reference line of the B-added alloy slides to the origin side compared to the Al–1.5Mn–1.0Mg alloy (mass%). Therefore, it is considered that the addition of B makes the microstructural condition of materials for practical use more difficult to precipitate the β phase. Since this 60-year-reference line is located on the origin side of the SLP diagram, it can be judged that if the amount of Mg added is 1.0 mass%, the precipitation of the β phase will not occur after 60 years, and therefore, the strength reduction due to the decrease in the amount of solid solution Mg will not occur.

In order for the comparative evaluation of the relative positional relationship between the precipitation start line and the 60-year-reference lines to be valid, the mechanism of the β phase precipitation in the actual equipment material (corresponds to the specimen No. 1B and No. 1 in this study) must not change from that of the specimen No. 3B and No. 3∼5 for which the precipitation start line was evaluated. First, as mentioned above, the average section length of the subgrain structure tends to increase slightly as the amount of Mg addition decreases. This is a microstructural change in the direction that reduces its interfacial area, i.e., the number of nucleation sites in the β phase. In this point of view, the precipitation start line of this study results in a safety side evaluation against the 60-year-reference lines. The precipitation microstructure of Mn compounds is unlikely to change significantly within the range of the amount of Mg addition used in this study. In addition, since the barrier energy of heterogeneous nucleation occurring at grain boundaries, precipitate interfaces, etc. is small compared to that of homogeneous nucleation, heterogeneous precipitation is always likely to take precedence over homogeneous precipitation.20) Therefore, it is unlikely that the rate of homogeneous nucleation of the β phase, i.e., the rate of spatially random nucleation in the aluminum matrix, varies greatly. Based on the above, it is considered that the precipitation mechanism of the β phase does not change under the condition that the amount of Mg addition is about 1 mass%, which is equivalent to the actual equipment material. Therefore, the evaluation method based on the relative position relationship between the precipitation start line and the 60-year-references in this study is judged to be valid.
As described above, TTP diagrams and SLP diagrams were newly evaluated using B-added alloys, and the results were comparable to those in the previous report. The authors believe that this indicates that the experimental method and series of analysis in this study have a certain degree of reproducibility, and in this sense the results are significant.


