Materials Chemistry
Preparation of Titanium–Calcium Alloy Films and Evaluation of Hydroxyapatite Formation Ability
2023 Volume 64 Issue 12 Pages 2801-2807
Details
2023 Volume 64 Issue 12 Pages 2801-2807
Ti implants used for the treatment of bones and teeth damaged by diseases and accidents must exhibit excellent bone-bonding ability. To develop novel Ti alloys with bone-bonding ability superior to that of conventional Ti alloys, we prepared alloy films of Ti and Ca, especially Ca is an essential element in the human body and the inorganic components of bones, via radio-frequency magnetron sputtering. Ti–Ca alloy films with various Ca concentrations were fabricated using different arrangements of Ti and Ca sources. The crystal and surface structures as well as in vitro bone-bonding ability of Ti–Ca alloy films with Ca concentrations of 6, 27, and 38 mass% were investigated. X-ray diffraction patterns revealed that the abovementioned Ti–Ca alloy films exhibit an amorphous structure. Results of X-ray photoelectron spectroscopy revealed that oxides and hydroxides of Ti and Ca were present on the surfaces of the Ti–Ca alloy films. In a simulated body fluid (SBF) immersion test, hydroxyapatite precipitated first on the surface of the Ti–27 mass%Ca alloy film, whereas the Ti–38 mass%Ca alloy film peeled off during immersion in the SBF solution.

Ti and Ti alloys have been used in implants for bones and teeth damaged by diseases, accidents, or aging.1–3) These materials require excellent bone-bonding ability for early treatment and adequate adhesion to living bones. However, bonding implants to living bones requires several months. Therefore, shortening the healing period by improving the bone-bonding ability of Ti and Ti alloys is desired. The surface treatments of Ti and Ti alloys have been studied to achieve rapid bonding between bones and implants.3,4) For example, hydroxyapatite (HAp; Ca10(PO4)6(OH)2), an inorganic component of bone, is mainly coated onto Ti and Ti alloys; however, adhesion in a living body for a long period is problematic.3)
On the surfaces of Ti and Ti alloys containing elements existing in the body, such as Ca, Mg, and Na, the presence of surface metal oxides and dissolution of these elements promote bonding with the bone.4) In particular, Ca is an essential element in living organisms and is one of the main inorganic elements in bones. A past study reported that Ca-incorporated Ti exhibited superior cell adhesion than that exhibited by non-Ca-incorporated Ti using an ion implantation method.5) Ti surfaces incorporated with Ca ions by soaking in NaOH and CaCl2 solutions exhibited excellent HAp formation ability.6) Ca ions were incorporated into the surface of the Ti–6Al–4V alloy by hydrothermal treatment using NaOH and CaO solutions to form CaTiO3.7) This Ca-incorporated Ti–6Al–4V alloy formed HAp on the surface in Hanks’ solution and exhibited excellent adhesion between the bone and implant.
Because Ti, Ca, and Mg do not have a solid solution phase on the phase diagram8) and the melting point of Ti is higher than the boiling points of Ca and Mg, Ti alloys with Ca and Mg cannot be prepared by conventional melting. Therefore, Ti–Mg alloy films have been manufactured by electron beam deposition and sputtering and Ti–Mg bulk alloys by mechanical alloying.9–16) On the other hand, very few studies have been conducted on Ti–Ca alloys. Vlcak et al. investigated the microstructure and mechanical properties of Ca-doped (concentration: 1–5 at%) Ti films with oxygen prepared by dual electron beam deposition with an oxygen ion beam.17)
In this study, we prepared Ti–Ca alloy films with various Ca concentrations by radio-frequency (RF) magnetron sputtering using various types of target configurations without a Ca metal target. Calcium hydroxide (CaH2) was used as a Ca source for the preparation of Ti–Ca alloys. Whereas Ca easily reacts with oxygen and moisture in air and must be stored in oil or inert gases, CaH2 is easier to handle. The crystal and surface structures of the Ti–Ca alloy films with various Ca concentrations were investigated. Since the alloying of Ti and Ca mainly affects the precipitation of inorganic components, HAp formation ability was evaluated in this study. To evaluate the HAp formation ability, an immersion test was conducted on the Ti–Ca alloy films using simulated body fluid (SBF).
Ti and Ti–Ca alloy films with various Ca concentrations were prepared via RF magnetron sputtering. N-type Si (100) (10 mm × 10 mm × 0.7 mm) cut from a Si wafer (SUMCO Corporation), instead of a Ti substrate, was used as a substrate to investigate the compositions and crystal structures of the Ti–Ca alloy films.
Ultrasonic cleaning was performed in the order of acetone, ethanol, and distilled water for 10 min each. The base pressure of the chamber was approximately 3 × 10⁻⁴ Pa. Ar gas (99.998%, Chubu Air Water Inc.) was used to generate the plasma at a flow rate of 35 mL/min. The operating pressure was 0.5 Pa. A high-frequency power supply (CESAR133, Advanced Energy Industries, Inc.) was used as the power source. The sputtering power for preparing the film was 100 W. The distance between the substrate and target was approximately 85 mm. The pre-sputtering and film formation times were 30 s and 30 min, respectively. The films were prepared at room temperature (approximately 20°C).
To investigate the optimum composition of Ti–Ca alloys with adequate bone-bonding ability, we prepared Ti–Ca alloy films of various compositions using various target configurations. A magnetron sputter cathode (Gencoa Ltd) was used. Additionally, a Ti plate (dimensions: ϕ50.8 mm × thickness: 2 mm; purity: 99.9%; High Purity Chemical Co., Ltd.) was used as the Ti target, and CaH2 (purity: >95.0%; Kanto Chemical Co., Inc.) was used as the Ca source. Figure 1 shows the target configurations, i.e., A, B, and C, tested in this study. CaH2 powder was directly filled into holes with ϕ10 mm and depth 0.5 mm in the Ti plates. Because CaH2 is deliquescent, it cannot be compressed easily into tablets. In particular, configuration B had the same hole arrangement as configuration C and was covered with a Ti mesh (ϕ0.1 mm, 100 mesh/in, Nilaco Corporation) to limit the excessive sputtering of CaH2.

Schematic of target configurations (a) A, (b) B, and (c) C.
The compositions of the Ti–Ca alloy films were measured using energy dispersive X-ray spectroscopy (EDS) combined with scanning electron microscopy (SEM; JSM-6610A, JEOL Ltd.). The acceleration voltage was set to 20 kV. The thicknesses of the Ti and Ti–Ca alloy films were measured using a stylus profiler (Dektak 150, ULVAC, Inc.). The stylus radius and pressure were set to 12.5 µm and 10 mg, respectively. The crystal structures of the prepared films were evaluated via X-ray diffraction (XRD) (SmartLab, Rigaku Corporation) using an X-ray diffractometer with Cu Kα (λ = 1.54 nm) radiation. The tube voltage and current were set to 40 kV and 30 mA, respectively. The measurement step and speed were 0.02° and 1.00°/min, respectively. The cross-sectional and crystal structures of the films were observed using a transmission electron microscope (TEM) (JEM-2100plus, JEOL Ltd.). The acceleration voltage was 200 kV. The chemical states of the prepared films were characterized using X-ray photoelectron spectroscopy (XPS; ESCALAB250Xi, Thermo Fisher Scientific). The X-ray source was Al Kα, and the spot size was 850 µm. The XPS data were acquired from the surfaces without Ar sputter etching. Charge correction was performed using the energy of the C 1s peak (284.8 eV). The Shirley background and Gaussian–Lorentz function were used for waveform separation using the Thermo Avantage software (Thermo Fisher Scientific).
2.2 Immersion in the SBF solutionTo investigate the HAp formation ability, an SBF immersion test was performed on the prepared alloy films. In this study, an SBF solution with an ion concentration 1.5 times that of conventional SBF18,19) was used in the immersion test to shorten the immersion period. This supersaturated SBF solution was also used for the in vitro evaluation of the HAp formation ability.20,21) NaCl, NaHCO3, KCl, MgCl2·6H2O, HCl, CaCl2, Na2SO4, and TRIS (FUJIFILM Wako Pure Chemical Corporation) as well as K2HPO4·3H2O (Nacalai Tesque, Inc.) were used to prepare the SBF solution. NaCl (12.054 g/L), NaHCO3 (0.528 g/L), KCl (0.3375 g/L), K2HPO4·3H2O (0.345 g/L), MgCl2·6H2O (0.4618 g/L), 1.0 M HCl (60 mL/L), CaCl2 (0.4395 g/L), Na2SO4 (0.108 g/L), and TRIS (9.177 g/L) were dissolved in order in deionized water at 36.5°C. Thereafter, 1.0 M HCl was added to the SBF solution to adjust pH to 7.40. The Ti and Ti–Ca alloy films were immersed in 20 mL of the SBF solution in perfluoroalkoxy alkane vessels for 3, 7, and 21 days in an incubator at 37°C. The SBF solution was replaced once every few days because its ion concentration changed during immersion. The Ti and Ti–Ca alloy films were immersed in the SBF solution and then rinsed with distilled water and air-dried. After immersion, surface observations by SEM and elemental analysis by EDS were performed. In addition, the crystal structures of the precipitates on the surfaces of the Ti and Ti–Ca alloy films were investigated using XRD.
The Ca concentrations in the Ti–Ca alloy films obtained by SEM-EDS were 5.9, 27.4, and 37.5 mass%, prepared using target configurations A, B, and C, respectively. Hereinafter, these Ti–Ca alloy films are denoted as Ti–6Ca, Ti–27Ca, and Ti–38Ca, respectively. The Ca concentrations in the Ti–Ca alloy films prepared using configurations B and C were higher than that of the film prepared using configuration A; this is because configurations B and C featured larger areas of CaH2 regions than those featured by configuration A. Although the CaH2 regions were placed in the same area in the Ti plate in both configurations B and C, the concentration of the Ti–Ca alloy film prepared using configuration B was lower than that of the film prepared using configuration C. By covering the CaH2 regions with a Ti mesh, as shown in Fig. 1(b), the sputtering of CaH2 and the subsequent generation of Ca atoms were limited; thus, the Ca concentration decreased in the Ti–Ca alloy prepared using configuration B. The thicknesses of Ti, Ti–6Ca, Ti–27Ca, and Ti–38Ca were approximately 190, 190, 260, and 250 nm, respectively.
Figure 2(a) shows the XRD patterns of Ti, Ti–6Ca, Ti–27Ca, and Ti–38Ca. The diffraction peak at approximately 38° in the Ti XRD pattern corresponded to Ti (002) [ICDD:00-044-1294]. The XRD patterns of Ti–6Ca and Ti–27Ca corresponded to amorphous Ti (002), indicating that the addition of Ca reduced the crystallinity of the Ti–Ca alloy films. No peaks were observed in the XRD pattern of Ti–38Ca, and the absence of diffraction peaks derived from Ti, Ca, CaH2, and Ti–Ca suggests that the obtained Ti–38Ca was amorphous. The cross-sectional TEM images and SAED patterns of Ti and Ti–Ca alloy films are shown in Fig. 2(b) and (c). These data indicate that the Ti film was crystalline and the Ti–Ca alloy films were amorphous. The structures of the crystalline Ti and amorphous Ti–Ca alloy films appear to be homogeneous in the depth direction.

(a) XRD patterns of Ti and Ti–Ca alloy films with various Ca concentrations. (b) Cross-sectional TEM images of Ti and Ti–Ca alloy films with various Ca concentrations. (c) SAED patterns of Ti and Ti–Ca alloy films with various Ca concentrations.
The atomic concentration of the topmost surfaces obtained by XPS is shown in Table 1. The topmost surfaces of the Ti–Ca alloy films are considered to contain the surface oxide films and adsorbed water. On the topmost surface of Ti–6Ca, the concentration of Ca was higher than those of the inside of the film. Figure 3 shows the XPS profiles of Ti 2p in Ti, Ti–6Ca, Ti–27Ca, and Ti–38Ca. The Ti 2p XPS profiles included Ti 2p3/2 and Ti 2p1/2 peaks. The electron states of each peak obtained via deconvolution were assigned based on the NIST database and literature.22–24) The spectra of Ti, Ti–6Ca, Ti–27Ca and Ti–38Ca showed component peaks corresponding to Ti0, Ti2+, Ti3+, and Ti4+, respectively. The Ti results were consistent with the presence of a surface oxide film comprising TiO2, Ti2O3, and TiO on Ti. Similarly, the presence of Ti and Ca oxides on Ti–6Ca, Ti–27Ca, and Ti–38Ca was assumed. The intensities of the Ti0 component peaks decreased as the Ca concentration increased. The decrease in metallic Ti suggests that the surface oxide films became thicker in the Ti–Ca alloy films. The Ti4+ component peaks of Ti, Ti–6Ca, Ti–27Ca, and Ti–38Ca were 458.6, 458.4, 458.2, and 458.1 eV, respectively. The Ti4+ component peaks shifted to lower binding energies as the Ca concentration increased. The addition of Ca formed a Ti–O–Ca bond and changed the number of oxygen atoms around Ti4+. The decrease in oxygen atoms that strongly attracted electrons increased the electron density of the valence electrons of Ti4+, thus shifting the peak of 2p3/2 of Ti4+ to the lower energy side.


Ti 2p XPS profiles of (a) Ti, (b) Ti–6Ca, (c) Ti–27Ca, and (d) Ti–38Ca surfaces.
Figure 4 shows the Ca 2p XPS profiles of Ti, Ti–6Ca, Ti–27Ca, and Ti–38Ca. The Ca 2p XPS profiles included Ca 2p3/2 and Ca 2p1/2 peaks. Component peaks were present at 346.7 and 347.3 eV in the Ca 2p3/2 peak in the spectra of Ti–6Ca, Ti–27Ca, and Ti–38Ca. These peaks corresponded to Ca2+ in CaO and Ca(OH)2, respectively.25) Meanwhile, a peak corresponding to Ca2+ in CaTiO3 was present at 346.7 eV.26) Ohtsu et al. reported similar component peaks for CaTiO3 prepared via RF magnetron sputtering.27) Surface oxide films in Ti–Ca alloys are speculated to be composed of Ti and Ca oxides and hydroxides. The surfaces of the Ti–Ca alloy films reacted with the moisture in air, which resulted in the formation of hydroxides after deposition and exposure to air outside the chamber.

Ca 2p XPS profiles of (a) Ti, (b) Ti–6Ca, (c) Ti–27Ca, and (d) Ti–38Ca surfaces.
Figure 5 shows the XPS profiles of O 1s in Ti, Ti–6Ca, Ti–27Ca, and Ti–38Ca. The component peaks at 530.1, 529.8, 529.7, and 529.5 eV in Ti, Ti–6Ca, Ti–27Ca, and Ti–38Ca, respectively, were attributed to the O2− of lattice oxygen.26,28–30) The O2− component peak at 530.1 eV in Ti was consistent with the binding energy of TiO2.22,25) The binding energy of O2− decreased slightly as the Ca concentration increased. The binding energy of O2− in CaO was lower than that in TiO2.25) Thus, the binding energy of O2− in the Ti–Ca alloy oxides decreased as the Ca concentration increased. The component peaks at approximately 531.5 eV were attributed to OH− 23,30) and defective oxygen.24,29) These peak area increased with the Ca concentration, which is attributable to the increase in the amount of hydroxide on the surface oxide of the Ti–Ca alloy film as the Ca concentration increased. The component peaks at approximately 532.5 eV were attributed to adsorbed H2O.23,25,29,30) These results indicate that the Ti–Ca alloy film, similar to other metal films, comprised a Ti–Ca alloy layer, a Ti–Ca alloy oxide layer, a Ti–Ca alloy hydroxide layer, and adsorbed water, in the order from the substrate to the film surface.

O 1s XPS profiles of (a) Ti, (b) Ti–6Ca, (c) Ti–27Ca, and (d) Ti–38Ca surfaces.
Figures 6–8 show the SEM images of the surfaces of Ti, Ti–6Ca, and Ti–27Ca after immersion for 3, 7, and 21 days, respectively. Ti–38Ca could not be evaluated because the film peeled off after immersion for one day. In the films immersed for 3 days, a layered precipitate was observed only on Ti–27Ca. In the films immersed for 7 days, granular precipitates were observed on Ti, whereas layered precipitates were observed on Ti–6Ca and Ti–27Ca. Granular non-layered precipitates were observed on Ti immersed for 21 days. In the films immersed for 21 days, layered precipitates were observed on Ti–6Ca and Ti–27Ca, and cracks formed during drying prior to the SEM measurements.

SEM images of (a) Ti, (b) Ti–6Ca, and (c) Ti–27Ca surfaces after immersion in SBF solutions for 3 days.

SEM images of (a) Ti, (b) Ti–6Ca, and (c) Ti–27Ca surfaces after immersion in SBF solutions for 7 days.

SEM images of (a) Ti, (b) Ti–6Ca, and (c) Ti–27Ca surfaces after immersion in SBF solutions for 21 days.
Figure 9 shows the elemental spectra and mappings of Ti, Ca, P, and O on Ti–27Ca surfaces after immersion for 21 days, as measured via EDS. Peaks of Ca, O, and P were present in the elemental spectra, and the result of elemental mapping revealed that the layered and granular precipitates contained Ca, O, and P. Therefore, the precipitates in Fig. 8 were assumed to be calcium phosphate. The Ca/P molar ratio in the precipitates obtained from the elemental spectra of Ti–27Ca was 1.63, which is similar to the stoichiometric value of the Ca/P molar ratio of HAp, i.e., 1.67.
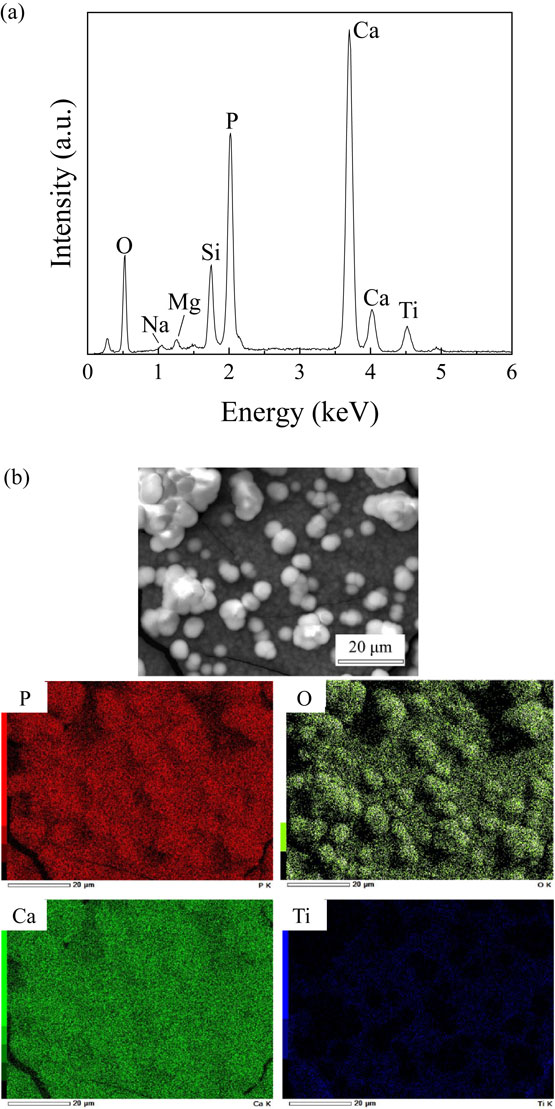
(a) Elemental spectra and (b) mappings of precipitates on Ti–27Ca surface after immersion in SBF solution for 21 days.
Figure 10 shows the XRD patterns of Ti–27Ca immersed in the SBF solution for 21 days. Diffraction peaks of HAp were observed in the film after immersion. The diffraction peaks at approximately 26° corresponded to HAp (002), whereas those at approximately 32° corresponded to HAp (211), (112), and (300) [ICDD:01-079-5683]. Therefore, the precipitates obtained on the surfaces of Ti–27Ca immersed in the SBF solution for 21 days were HAp.

XRD pattern of precipitates on Ti–27Ca surface after immersion in SBF solution for 21 days.
HAp precipitation was more likely to occur on the Ti–Ca alloy surfaces than on Ti. On the Ti–Ca alloy films, HAp precipitated earlier when the Ca concentration was higher; however, Ti–38Ca peeled off during immersion in the SBF solution. After immersion in the SBF solution for 21 days, the HAp precipitated on the Ti and Ti–Ca alloy films was granular and layered, respectively. The XPS results revealed that Ti oxides and hydroxides were present on the Ti film, whereas Ti–Ca alloy oxides and hydroxides were present on the Ti–Ca alloy films. The surface oxides and hydroxides on the Ti–Ca alloy films interacted more strongly with ions in the SBF solution, thus causing HAp to precipitate faster and form layers. In the Ca-incorporated Ti surfaces, the positively charged surfaces attracted HPO42−, and the release of Ca ions from the surfaces caused the supersaturation of Ca ions in the SBF solution, thus accelerating the precipitation of HAp.5,7) A similar phenomenon was assumed to have occurred on the Ti–Ca alloy surfaces. Specifically, when the Ca concentration increased, the precipitation ability of HAp improved; however, the film adhesion decreased. In heterogeneous nucleation, strong interaction between the film surface and the ions decreases the free energy of nucleation, and nucleation is more likely to occur. In addition, supersaturated Ca ions near the surfaces cause precipitation of HAp. The surfaces of Ti–Ca alloy films with higher Ca concentrations interacted more strongly with ions in the SBF solution, reducing the free energy for HAp nucleation. Furthermore, more Ca ions were released from the surfaces of Ti–Ca alloy films with higher Ca concentration and became supersaturated near the film surfaces. It is assumed that these factors promoted the HAp precipitation. Because HAp precipitated earliest on Ti–27Ca without peeling off from the Si substrate, Ti–27Ca was assumed to exhibit the best HAp-forming ability in this study.
In this study, Ti–Ca alloy films with various Ca concentrations were fabricated via RF magnetron sputtering using different arrangements of Ti and Ca sources. Ti–6, 27Ca, and 38Ca exhibited amorphous structures. Oxides and hydroxides of Ti and Ca were present on the Ti–Ca alloy films. Results of SBF immersion test revealed that Ti–27Ca exhibited the best HAp-formation ability in this study. Ti–38Ca showed film deterioration after immersion in the SBF solution for one day. Biological tests, such as cell proliferation tests and measurement of alkaline phosphatase levels, should be conducted in the future.
This work was supported by Grants-in-Aid for Scientific Research (No. 20K05130, 23K04415) from the Japan Society for the Promotion of Science. TEM, SAED, SEM, and EDS data in this study were obtained using the equipment in the High-Voltage Electron Microscope Laboratory, Institute of Materials and Systems for Sustainability of Nagoya University. We received tremendous supports from Mr. Higuchi and Dr. Yamamoto, technical staff of the High-Voltage Electron Microscope Laboratory, in the preparation and observation of TEM samples.