Materials Physics
Band Effective Masses of Cubic (GeTe)10Sb2Te3 and Its Anisotropy
2023 Volume 64 Issue 2 Pages 522-526
Details
2023 Volume 64 Issue 2 Pages 522-526
Recent progress observed in the band engineering of thermoelectric GeTe-based materials is significantly dependent on the enhancement of its electronic band degeneracy and anisotropic effective mass. Here, we evaluated the anisotropic effective mass of cubic (GeTe)10Sb2Te3 according to first-principles calculation, based on the Korringa-Kohn-Rostoker coherent-potential-approximation method, by comparing it with cubic GeTe. We found alloying with Sb2Te3 decreased the band gap energy and shifted the valence band maxima closer to the Fermi level, indicating straightforward convergence of the multiple Σ, L, and Δ valence bands. The obtained band structure suggested that the Δ band is expected to contribute electronic transport properties at the experimental carrier concentration which was reported previously. The Δ band had unique characteristics with a heavier density-of-states effective mass and higher band anisotropy than the conventional Σ and L bands, possibly leading to enhancement in Seebeck coefficient of (GeTe)10Sb2Te3. The alloying with Sb2Te3 did not significantly change band anisotropies while it increased overall band effective masses of Σ, L, Δ valence bands. Therefore, it is suggested that alloying GeTe with Sb2Te3 enhances its band degeneracy and band effective masses while keeping its anisotropy.
This Paper was Originally Published in Japanese in J. Thermoelec. Soc. Jpn. 18 (2021) 73–78.
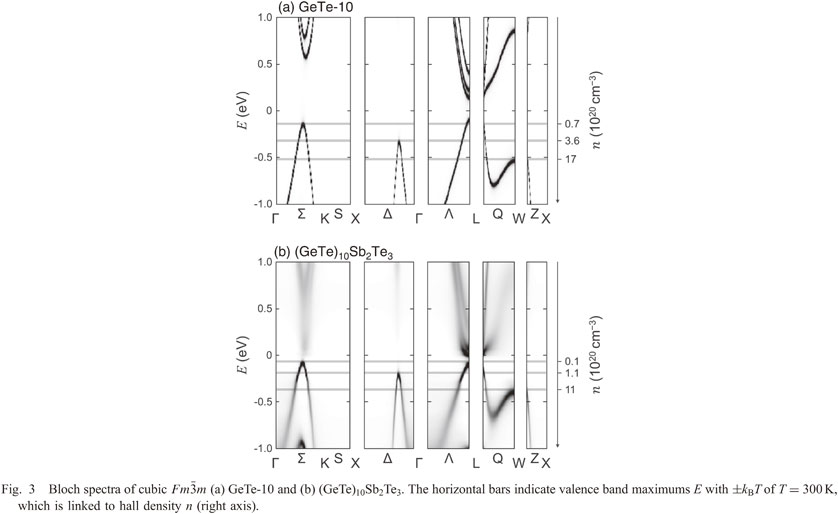
Fig. 3 Bloch spectra of cubic $Fm\bar{3}m$ (a) GeTe-10 and (b) (GeTe)10Sb2Te3. The horizontal bars indicate valence band maximums E with ±kBT of T = 300 K, which is linked to hall density n (right axis).
The performance of thermoelectric materials is expressed by the dimensionless figure of merit zT = S2σTκ−1. Here, S is the Seebeck coefficient, σ is the electrical conductivity, κ is the thermal conductivity, T is the absolute temperature, and κ is mainly composed of the lattice contribution κlat and the electron contribution κel. Larger the zT value, better is the performance of the thermoelectric material. In recent years, improvements to the thermoelectric properties have been proposed by band convergence, in which the relative energy positions of multiple band edges (valleys) are manipulated by various techniques, such as element substitution, and aligned within the range of several kBT (kB: Boltzmann constant).1) In general, when the valley is located at k point away from the Γ point in the Brillouin zone, degeneracy becomes larger because multiple carrier pockets are duplicated, which is caused by the symmetry of the crystal structure. Meanwhile, at these k points, the effect of the anisotropic effective mass of the band on the thermoelectric properties may not be negligible.
In metals or degenerate semiconductors, S is expressed by eq. (1)2) and σ is expressed by eq. (2).3)
| \begin{equation} S = \frac{2k_{\text{B}}T}{3e\hbar^{2}}m_{\text{DOS}}^{*}\left(\frac{\pi}{3n}\right)^{2/3} \end{equation} | (1) |
| \begin{equation} \sigma = \frac{ne^{2}\tau}{m_{\text{c}}^{*}} \end{equation} | (2) |
Here, e is the elementary charge, ħ is the Dirac constant, n is the carrier density, and τ is the relaxation time. The density-of-state effective mass $m_{\text{DOS}}^{*} = N_{\text{v}}^{2/3}m_{\text{b}}^{*}$ is represented by valley degeneracy Nv and band effective mass $m_{\text{b}}^{*}$. Moreover, $m_{\text{c}}^{*}$ is the conductivity mass. In eqs. (1)–(2), larger $m_{\text{DOS}}^{*}m_{\text{c}}^{* - 1}$ is advantageous for the values of S and σ from the viewpoint of effective mass. In the isotropic single-band structure, $m_{\text{DOS}}^{*}m_{\text{c}}^{* - 1} = 1$, but in the anisotropic multi-band structure, the value deviates from 1. $m_{\text{b}}^{*}$ considering anisotropy is defined by eq. (3).4)
| \begin{equation} m_{\text{b}}^{*} = (m_{\|}m_{\bot}^{2})^{1/3} \end{equation} | (3) |
Furthermore, $m_{\text{c}}^{*}$ is defined by eq. (4).4)
| \begin{equation} m_{\text{c}}^{*} = 3(m_{\|}^{-1} + 2m_{\bot}^{-1})^{-1} \end{equation} | (4) |
Here, m|| represents the vertical effective mass and m⊥ represents the horizontal effective mass. The anisotropic effective mass is evaluated by the anisotropy parameter $K = m_{ \bot }m_{\| }^{ - 1}$, and the farther K is from 1, the higher the anisotropy. Furthermore, $m_{\text{DOS}}^{*}m_{\text{c}}^{* - 1}$ is expressed as eq. (5) using K.5)
| \begin{equation} m_{\text{DOS}}^{*}/m_{\text{c}}^{*} = (2/3)K^{1/3} + (1/3)K^{-2/3} \end{equation} | (5) |
In eq. (5), Nv = 1 is set to simplify the equation. According to this equation, $m_{\text{DOS}}^{*}m_{\text{c}}^{* - 1}$ becomes larger as K is farther from 1, that is, S2σ becomes larger. Therefore, the anisotropic effective mass is an important thermoelectric parameter for designing thermoelectric materials.
As an effective example of band convergence, it has been reported that zT in the mid-temperature range is improved by increasing Nv in p-type GeTe-based bulk materials.6–8) It is known that the L and Σ valence bands are involved in the electrical conduction of this material, and its anisotropic effective mass has been clarified by theoretical calculations.7,9,10) Reportedly, high anisotropy of L band in the same material contributes to the improvement of S2σ.11) Therefore, it is presumed that the Nv and anisotropy of $m_{\text{b}}^{*}$ have a great influence on the thermoelectric properties of GeTe-based materials. In our previous study,12,13) we focused on GeTe–Sb2Te3, which is a pseudo-binary alloy of GeTe and Sb2Te3, and experimentally obtained high S2σ near room temperature. In addition, we clarified that the high S2σ of this system is caused by the increase in Nv by band convergence of the Δ band, which is originally in a relatively deep level, together with the conventional L and Σ bands in a very narrow energy region. Previous studies focused on Nv and did not evaluate the anisotropy of $ m_{\text{b}}^{*}$ in each band. Therefore, in this study, we evaluated the effective mass of cubic (GeTe)10Sb2Te3, which has the simplest structure among the samples prepared in the previous research, and its anisotropy by first-principles band calculation. We discuss these aspects from the viewpoint of comparison with cubic GeTe. In the previous research on GeTe,7,9,10) the anisotropy was evaluated by two components, the longitudinal effective mass and the transverse effective mass, but the directionality indicated by the transverse effective mass is arbitrary. Considering this, in this study, we calculated the effective mass of three components including one longitudinal effective mass and two different transverse effective masses, and explained the anisotropy in detail. This study mainly evaluates effective mass and its anisotropy, but it is necessary to explain the band structure because previous studies have not described the detailed band structure of this material. In addition, although there are reports on the L and Σ bands of GeTe, there is no description of the Δ band yet. Therefore, after explaining the band structures of (GeTe)10Sb2Te3 and GeTe in Sections 3.1 and 3.2 of this paper, the effective mass of both materials was discussed in Section 3.3.
In this study, we performed first-principles electronic state calculations based on the Korringa-Kohn-Rostoker within Coherent-Potential Approximation (KKR-CPA) method.14) The calculation code used was AkaiKKR (Machikaneyama).15) For detailed calculation conditions, refer to Ref. 12). In the calculation, two structural models were created and named (GeTe)10Sb2Te3 and GeTe-10. All models have a cubic (face-centered cubic: fcc) structure belonging to the space group $Fm\bar{3}m$. Of these, the crystal structure parameters of (GeTe)10Sb2Te3 that were used were those of the samples prepared by us in the previous study12) (Fig. 1). GeTe-10 has the same crystal structure parameters as (GeTe)10Sb2Te3, except that the composition is GeTe. It was assumed that only the effect of the composition of the two band structure models could be extracted through comparison.

Crystal structure of cubic (GeTe)10Sb2Te3 with the space group $Fm\bar{3}m$ and the cubic lattice parameter a = 4.23343(5) Å; 4a site is occupied by Te, while 4b site is the mixed occupancy of Ge:Sb:Vacancy (Vc) = 10:2:1.
The Brillouin zone settings used in the band structure calculation are as shown in Fig. 2. From each spectrum data obtained by calculation, the effective mass near the valley of the valence band maximum (VBM) was obtained by parabolic approximation. In this study, to evaluate the anisotropy of $m_{\text{b}}^{*}$ three-dimensionally, the component m|| parallel to the axis passing through the Γ point and the component m⊥ orthogonal to this axis were obtained in the Brillouin zone. Here, as the method of taking m⊥ is arbitrary, the major axis component m⊥1 and the minor axis component m⊥2 were obtained by the least squares method using an elliptic function. Therefore, eqs. (3) and (4) have been amended as follows.
| \begin{equation} m_{\text{b}}^{*} = (m_{\|}m_{\bot 1}m_{\bot 2})^{1/3} \end{equation} | (6) |
| \begin{equation} m_{\text{c}}^{*} = 3(m_{\|}^{-1} + m_{\bot 1}^{-1} + m_{\bot 2}^{-1})^{-1} \end{equation} | (7) |

First Brillouin zone of face-centered cubic (fcc). The symmetry points and axes are referred according to Ref. 16).
The band structure near the Fermi level of GeTe-10 is shown in Fig. 3(a). The band structure of GeTe-10 significantly agreed with the outline of Ref. 8) calculated by another calculation method. Thereby, GeTe-10 is a direct transition semiconductor having a band gap Eg at the L point. Its Eg = 0.18 eV, which relatively agrees with the experimental value17,18) (Eg = 0.1–0.2 eV), suggesting that it is a valid representation of the actual Eg value of GeTe. In addition, the calculated values by first-principles calculation of other methods7,9,19–24) (Eg = 0.11–0.31 eV) showed similar values. The VBM existing near the Fermi level are L point (4), Σ axis (12), Δ axis (6), and W point (6) (Nv in parentheses), in descending order of energy. The energy difference ΔE of each band edge is summarized in Table 1 together with Eg. Defining the energy of the valley of the X band as EX, then from Table 1, the difference between EL and EΣ, ΔEL-Σ, was 0.05 eV, which was similar to the values of J. Li et al. (Eg = 0.064 eV9)) and M. Hong et al. (Eg = 0.041 eV23)). Moreover, this value is smaller than ΔEΣ-Δ = 0.19 eV and ΔEΔ-W = 0.20 eV, and it was likely that band convergence would occur between the Σ band and the L band.

Bloch spectra of cubic $Fm\bar{3}m$ (a) GeTe-10 and (b) (GeTe)10Sb2Te3. The horizontal bars indicate valence band maximums E with ±kBT of T = 300 K, which is linked to hall density n (right axis).

The right axis of Fig. 3 shows the hole concentration when the Fermi level shifts under the rigid band model. GeTe tends to generate intrinsic Ge defects25) and be doped with holes. Experimentally, it eventually become a p-type semiconductor of n ∼ 1020 cm−3.26) According to Fig. 3(a), in GeTe-10, the L point contributes to electrical conduction with hole doping of n = 2 × 1019 cm−3, after which the Σ point contributes to electrical conduction when n = 7 × 1019 cm−3; Δ point contributes to electrical conduction when n = 3.6 × 1020 cm−3; and W point contributes to electrical conduction when n = 1.7 × 1021 cm−3 or more. Experimentally, a hole concentration of n = (0.47–12.6) × 1020 cm−3 has been reported,27–31) and if the band structure of the reported sample can be represented by the rigid band model, then in most samples reported so far, L to Σ points contribute to electrical conduction, and in heavy-doped samples, up to Δ points are considered to contribute to electrical conduction.
3.2 (GeTe)10Sb2Te3 band structureThe band structure near the Fermi level of (GeTe)10Sb2Te3 is shown in Fig. 3(b). The outline of the band structure is almost the same as that of GeTe-10, but the spectrum is blurred because of the influence of mixed crystal sites (Ge, Sb, Vc). Notable differences from GeTe-10 are the size of Eg, the energy position of VBM in each band, and their relative relationship. Unlike GeTe-10, (GeTe)10Sb2Te3 was an indirect transition semiconductor with a gap between the Σ point in the valence band and the L point in the conduction band. The band gap was Eg = 0.07 eV, which was smaller than that of GeTe-10. Moreover, unlike GeTe, the VBM with the highest energy was on the Σ axis, with ΔEL-Σ = −0.02 eV. ΔEΣ-Δ and ΔEΔ-W are smaller than GeTe-10, and the Δ band and W band also approach the Fermi level and are easily reduced. From Fig. 3(b), the hole concentration at points Σ, Δ, and W is n = 1 × 1019 cm−3, n = 1.1 × 1020 cm−3, and n = 1.1 × 1021 cm−3, respectively. Although the hole concentration of (GeTe)10Sb2Te3 has not been measured, n = 2.5 × 1020 cm−3 has been experimentally obtained for (GeTe)12Sb2Te3.12) Therefore, it is considered that the Δ band is more likely to contribute to the electrical transport properties in (GeTe)10Sb2Te3 than in GeTe-10, and an increase in S is expected. However, as Eg decreases from 0.18 to 0.07 eV, it is expected that S will decrease because of the bipolar effect over a wide temperature range. Therefore, depending on the operating temperature range, it is possible that the increase in S caused by the contribution of the Δ band and the decrease in S caused by the bipolar effect cancel each other out.
Although detailed results are not included in this paper, it has been confirmed that there is almost no difference in the band structure between GeTe-10 in this study and GeTe using the lattice constant in Ref. 32). Therefore, it can be concluded that the difference in band structure between (GeTe)10Sb2Te3 and GeTe-10 reported so far was caused not by the difference in lattice constant but by the solid solution formation with Sb2Te3.
3.3 Effective mass of GeTe-10 and (GeTe)10Sb2Te3Table 2 summarizes the effective mass and related parameters of GeTe-10 and (GeTe)10Sb2Te3. In the Appendix, the m⊥ component of each band is illustrated on a two-dimensional plane. In GeTe-10, the vertical effective mass and horizontal effective mass of L point (m|| = 0.336 m0, m⊥ = 0.026 m0), and the vertical effective mass and horizontal effective mass of Σ axis (m|| = 0.157 m0, m⊥ = 1.383 m0) took a value close to the literature value.7,9,10) Focusing on the $m_{\text{DOS}}^{*}$, $m_{\text{b}}^{*}$ and Nv, the results showed that the L band was a light band (= 0.06 m0) with low degeneracy (Nv = 4), and the Σ band was a heavy band (= 0.28 m0) with high degeneracy (Nv = 12), as previously reported. The Δ band, which has not been discussed in the literature so far, has a degeneracy (Nv = 6) that is half of that of the Σ band, but is heavier than the Σ band (= 0.59 m0). Therefore, paying attention to $m_{\text{DOS}}^{*}$, the Δ band (= 1.9 m0) was the largest, followed by the Σ band (= 1.5 m0), and the L band (= 0.16 m0) had an order of magnitude smaller than the Δ and Σ bands. For $m_{\text{c}}^{*}$, the Δ and Σ bands (= 0.18 m0) were relatively similar, and the L band (= 0.040 m0) was 20% smaller. To compare the anisotropy of each band, if K < 1, the reciprocal is taken and compared, and the results showed that the anisotropy is higher in the order of Δ band (K = 22, 35), L band (K−1 = 12, 13), and Σ band (K = 1.5, 8.8). In summary, our calculations confirm that the L and Σ bands have the characteristics as previously reported; that is, the L band is a light band and has high anisotropy, and the Σ band is a heavy band and has high degeneracy. In this study, it was clarified for the first time that the Δ band has $m_{\text{DOS}}^{*}$ larger than the Σ band because of (1) heavy $m_{\text{b}}^{*}$ and (2) higher anisotropy than the L band.

The m|| and m⊥ of each band of (GeTe)10Sb2Te3 increased around 20–30% in the Σ and Δ bands, and around 50–70% in the L band, when compared with GeTe-10. For example, for the Σ band, (GeTe)10Sb2Te3 is m|| = 0.21 m0, which is 30% larger than GeTe-10 (m|| = 0.157 m0). As a result, $m_{\text{b}}^{*}$, $m_{\text{c}}^{*}$, and $m_{\text{DOS}}^{*}$ increased around 20–30% in the Σ and Δ bands and around 60–70% in the L band. On the other hand, the magnitude of effective mass between different bands of (GeTe)10Sb2Te3 was similar to that of GeTe-10. Next, when the K value of (GeTe)10Sb2Te3 was compared with that of GeTe-10, almost all K values tended to decrease by 10% (e.g., K = 0.68 → 0.61 in the Σ band). Notably, anisotropy increases as K moves away from 1, with the value of K in the Σ band greater than 1 on one side and less than 1 on the other. The decrease in the value of K seen in (GeTe)10Sb2Te3 represents an increase, and subsequently, a decrease in the anisotropy of the band. As for the value of $m_{\text{DOS}}^{*}m_{\text{c}}^{* - 1}$, these effects were canceled out, and the values of (GeTe)10Sb2Te3 (= 8.2) and GeTe-10 (= 8.1) were similar. In the L band, both models had K < 1, and in (GeTe)10Sb2Te3, one decreased and the other increased, so it is considered that the change in anisotropy was canceled out. In fact, the values of $m_{\text{DOS}}^{*}m_{\text{c}}^{* - 1}$ were similar between (GeTe)10Sb2Te3 (= 4.0) and GeTe-10 (= 3.8). In all Δ bands, K > 1, and in (GeTe)10Sb2Te3, the value of K decreased, so the anisotropy decreased. Comparing the values of $m_{\text{DOS}}^{*}m_{\text{c}}^{* - 1}$, (GeTe)10Sb2Te3 (= 10) and GeTe-10 (= 11) did not show a significant decrease. To summarize the characteristics of the effective mass of (GeTe)10Sb2Te3, the effective mass of all bands increases compared to GeTe, but changes in anisotropy are not expected to have a significant effect on $m_{\text{DOS}}^{*}m_{\text{c}}^{* - 1}$.
As for the effect on the electrical properties, the effect on the power factor is considered to be small because the change in anisotropy is small. However, the effect of increasing the effective mass differs, depending on the scattering mechanism. Considering the weighted mobility $\mu_{w} = \mu_{0}m_{\text{DOS}}^{*}{}^{3/2}$ ($\mu_{0} = e\tau m_{\text{c}}^{* - 1}$: mobility), when ionization impurity scattering $\tau \propto m_{\text{b}}^{*1/2}$, $\mu_{w} \propto m_{\text{b}}^{*}(m_{\text{DOS}}^{*}m_{\text{c}}^{* - 1})$; so it is presumed that the power factor is improved by the contribution of $m_{\text{b}}^{*}$. However, assuming acoustic phonon scattering $\tau \propto m_{\text{b}}^{* - 3/2}$, as $\mu_{w} \propto m_{\text{c}}^{* - 1}$, it is considered that the power factor decreases because of the contribution of $m_{\text{c}}^{*}$.
We discussed the band structure and the anisotropy of effective mass of cubic (GeTe)10Sb2Te3 in comparison with cubic GeTe using first-principles calculations. It was expected that the solid solution of GeTe and Sb2Te3 would bring the valence bands of the L, Σ, and Δ bands closer to the Fermi level, making band convergence easier in the experimental carrier density range (n ∼ 1020 cm−3). As a result, it is expected that the L, Σ band and Δ band will contribute to the electron transport properties. Since the Δ band has a higher anisotropy than the L band and is heavier than the Σ band, it is considered to be particularly effective in increasing the Seebeck coefficient due to band convergence. We revealed for the first time that the Δ band has a density-of-state effective mass $m_{\text{DOS}}^{*}$ larger than the Σ band due to (1) heavy band effective mass $m_{\text{b}}^{*}$, and (2) higher anisotropy than the L band. To summarize the characteristics of the effective mass of (GeTe)10Sb2Te3, the effective mass of all bands increases compared to GeTe, but changes in anisotropy are not expected to have a significant effect on $m_{\text{DOS}}^{*}m_{\text{c}}^{* - 1}$. Therefore, although the effect of the anisotropy of the effective mass on the power factor is small, it is expected that an increase in the effective mass affects the increase or decrease of the power factor depending on the scattering mechanism.
This research was greatly supported by JST-PRESTO (grant number: JPMJPR17R4), KAKENHI/Challenge Research (Pioneering/Exploratory) (grant number: 16K14425), Thermal & Electric Energy Technology Foundation, and Tanigawa Thermal Technology Promotion Fund. Dr. Hiroki Funashima (Kindai University Technical College Department of Comprehensive Engineering) provided advice on some of the band structure calculations.

Polar plot of transverse effective mass m⊥/m0 for (GeTe)10Sb2Te3 on (a) L band, (b) Σ band, and (c) Δ band.