Abstract
Characterization of triple junctions has been performed by considering the disorientation angles among grains around triple junctions. The disorientation angles for each triple junction are called θmin, θmid and θmax, which satisfy θmin ≤ θmid ≤ θmax. Disorientation-angle diagrams that relates θmin and Σθi = θmin + θmid + θmax were constructed for the triple junctions in deformed and annealed aluminum. By comparing the disorientation-angle diagrams before and after grain growth, we found self-similarity of the distribution of the disorientation angles around the triple junctions during the grain growth.
1. Introduction
In polycrystalline materials composed of many grains, there are many triple junctions of grain boundaries. Although the triple junctions are assumed to play important roles in various phenomena in polycrystals,1–4) they have still not been sufficiently characterized. One of the reasons for this situation is that many (eleven) independent parameters are needed to fully describe the orientations of grains and grain boundaries around a triple junction.5) However, if extraction of the characteristics of triple junctions is possible by using only some of these parameters, an intuitive understanding of the structures of polycrystals will become possible. This was attempted in this study.
Considering the disorientation angles among grains around triple junctions, a disorientation-angle diagram was proposed in a recent study.6) Here, using the concept of this disorientation-angle diagram, we considered the distribution of disorientation angles around the triple junctions in deformed and annealed aluminum. By comparing the disorientation-angle diagrams before and after grain growth, the characteristics of the triple junctions during the grain growth are discussed.
2. Experimental Procedure
Using severely deformed and annealed aluminum, we observed microstructural evolution to discuss characteristics of disorientation angles among grains around triple junctions. The experimental procedure is described below.
2.1 Severe plastic deformation and annealing of aluminum
A 2N purity aluminum (A1100) rod (10 mm in diameter, 65 mm in length) was washed with nitric acid and annealed at 400°C for 2 h to produce homogeneously recrystallized microstructures. Severe plastic deformation was applied to the rod by the equal-channel angular pressing (ECAP) process.7) Eight ECAP passes using route BC7) were made, and a refined microstructure with an average grain size of approximately 0.6 µm was obtained after the ECAP process. Plate-like specimens with thickness of 1.2 mm were cut from the center of the as-prepared specimens. The specimens were then cut into small pieces and annealed for 30 min at various temperatures from 50°C to 250°C. Because the as-prepared specimens were kept at room temperature (RT) for a few hours during the preparation for subsequent microstructure observation, these specimens were treated as specimens annealed at RT.
2.2 Microstructure observation and hardness test
The microstructures of the specimens after ECAP and annealing were observed with field-emission scanning electron microscopy (FE-SEM, JSM-7001F, JEOL) and electron backscatter diffraction (EBSD) analysis technique. SEM observation was performed at 15 kV, and the step size of the EBSD measurements was 0.05 µm. Using the results of EBSD measurements, variations of crystal orientations on observed planes of the specimens were determined using OIM Data Collection ver. 7.1.0. and the OIM Analysis ver. 7.3.0. (TSL Solutions). Grain boundaries are defined to exist when the disorientation angles between neighboring pixels are larger than 2°. A computer program developed by the present authors was used to search for triple junctions on observation planes of the specimens. An outline of the method to detect triple junctions will be explained later.
The hardness of the specimens was measured by using a conventional Vickers hardness tester. The applied force was 2.94 N. The average results after five measurements were adopted.
3. Results for Microstructural Evolution
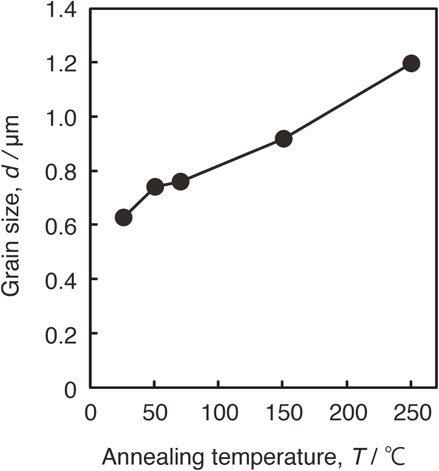
Microstructure evolution of deformed and annealed aluminum is shown in Figs. 1, where (a) to (e) show the inverse pole figure (IPF) maps of the specimens annealed at various temperatures: (a) RT, (b) 50°C, (c) 70°C, (d) 150°C and (e) 250°C. These are the results observed on the ND-TD plane of the specimens, where ND and TD are the normal and transverse directions of the final pass of ECAP, and the crystallographic orientations of the grains along the extrusion direction (ED) of the final pass of ECAP are shown using the color code at the bottom right of Fig. 1. The black regions in the IPF maps are regions with confidence index (CI) values of less than 0.1, and these orientations were not determined. Because of severe plastic deformation by the ECAP process, the black regions exist to a certain extent in Fig. 1(a) for the specimen without heat treatment. The black regions decrease with increasing the annealing temperature T. As shown in Figs. 1(a) to (e), the grain size d of the specimens seems to increase with increasing the annealing temperature T. Figure 2 shows this relationship between T and d, where the grain size d was determined with the linear intercept method.

Grain shapes in Fig. 1(a) are almost equiaxial. Such equiaxial shapes of grains are maintained during annealing up to 250°C. Color gradation of IPF maps corresponding to small variations of crystal orientations are observed in Fig. 1 and we can find the variations in grains even in Fig. 1(e) for the specimen annealed at 250°C. It seems that the microstructural evolution observed in the present study is caused by recovery and grain growth without nucleation of new grains. Equiaxial shapes of grains maintained during grain growth have been discussed as the self-similarity of grain shapes in Ref. 8).
Figure 3 shows the relationship between the annealing temperature T and the Vickers hardness h. The hardness h decreases with increasing T, and this is caused by the grain growth and recovery in grains.
4. Disorientation-Angle Diagram of the Triple Junctions
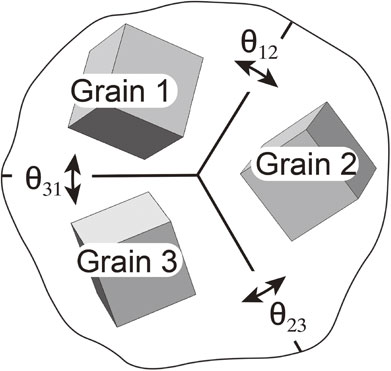
Before considering the triple junctions in deformed and annealed aluminum, we will first explain the disorientation-angle diagram6) that will be used to discuss the disorientation angles among three grains around the triple junctions. The three disorientations angles θ12, θ23 and θ31 among Grains 1, 2 and 3 for each triple junction, as shown in Fig. 4, are called θmin, θmid or θmax, which satisfy the condition
| \begin{equation}
\theta_{\text{min}} \leq \theta_{\text{mid}} \leq \theta_{\text{max}}.
\end{equation}
| (1) |
To evaluate the orientation relationship among grains around the triple junctions, the disorientation diagram that relates θ
min to Σθ
i is proposed:
6)
| \begin{equation}
\Sigma\theta_{i} = \theta_{\text{min}} + \theta_{\text{mid}} + \theta_{\text{max}}.
\end{equation}
| (2) |
An example disorientation-angle diagram is shown in
Fig. 5. One thousand triple junctions composed of randomly oriented grains were computationally generated and the dots in the triangle connecting points O, P and Q show the results of the sets of three disorientation angles around the triple junctions.
6) Point O is the origin with the coordinate (θ
min, Σθ
i) = (0°, 0°). The coordinates of points P and Q are (θ
MD, 3θ
MD) and (0°, 2θ
MD), respectively, where θ
MD = 62.80° is the maximum disorientation angle for cubic grains.
6,9–11)

Using points of V and W in Fig. 5 with the coordinates (15°, 45°) and (0°, 30°), respectively, the disorientation-angle diagram is divided into three regions. The first region is region T in Fig. 5 located at the right-hand-side of the vertical line through point V. This is the region of well-defined triple junctions with three high-angle boundaries with θmin > 15°. The second region is region B with θmin < 15° and above the line connecting points V and W. This is the region of triple junctions with two high-angle boundaries and one low-angle boundary; θmin < 15° and 15° < θmid. The third region is region S with θmin < 15° and below the line connecting points V and W. This is the region of triple junctions with three low-angle boundaries; θmax < 15°. Triple junctions with one high-angle boundary and two low-angle boundaries are described by θmax > 15° and θmin ≤ θmid < 15°. For such triple junctions, θmid + θmax = 30° is the criterion to determine their regions. Triple junctions with θmid + θmax > 30° belong to region T and those with θmid + θmax < 30° belong to region S.
Considering one million sets of three randomly oriented grains, the probabilities of belonging to each region are 93.33% for region T, 6.63% for region B and 0.04% for region S.6) Because the probability of belonging to region S is less than 0.1%, it is reasonable that there are no dots in region S in Fig. 5 for 1000 triple junctions. If we consider the probability of triple junctions with three low-angle boundaries instead of that of region S, the value is 0.02%, which is about a half of that for region S.
For two randomly oriented cubic grains, the probability Plow that the disorientation angle between them is less than 15° and the boundary between them is a low-angle one is Plow ≈ 2.28%.10) The above probability of 0.02% for the triple junctions with three low-angle boundaries is close to Plow2 ≈ 0.052%6) but much higher than Plow3 ≈ 0.001%.12) This is understood from the constrained condition among the three disorientation angles θmin, θmid and θmax:6)
| \begin{equation}
\theta_{\text{max}} \leq \theta_{\text{min}} + \theta_{\text{mid}}.
\end{equation}
| (3) |
5. Triple Junctions in Deformed and Annealed Aluminum
5.1 Detection of triple junctions and disorientation angles among grains
Figure 6(a) shows an enlarged IPF map of the specimen annealed at 70°C which is shown in Fig. 1(c). Figure 6(b) is a schematic illustration of the local region in Fig. 6(a) showing the pixels around a triple junction. The black pixels in Figs. 6(a) and (b) are those with CI values of less than 0.1. Using the results of EBSD measurements, we can obtain variations of crystal orientations as a function of position. Comparing the orientations in a region with a radius of about 0.15 µm, we searched for triple junctions composed of three grains as shown in Fig. 6(b) by using an originally developed computer program.

The step size of the EBSD measurements was 0.05 µm and about 36 pixels existed in the region shown in Fig. 6(b). Considering variations of orientations for neighboring in-grain pixels within 2°, the disorientation angles among grains around the triple junction were obtained as the average values of the disorientation angles between various combinations of in-grain pixels in the grains. The disorientation angles among three grains were thus determined, and the disorientation angles around 1000 triple junctions were measured for each annealed specimen.
5.2 Disorientation-angle diagrams of deformed and annealed aluminum
Figures 7(a) and (b) are the disorientation-angle diagrams of aluminum annealed at RT and 250°C, respectively. Using the results of SEM/EBSD analysis, the disorientation angles among three grains around 1000 triple junctions are shown in the figures. The distribution of data points in Fig. 7(a) for the specimen annealed at RT is very similar to that shown in Fig. 7(b) for the specimen annealed at 250°C. Although these are the results before and after the grain growth (Fig. 2) and the softening (Fig. 3), these changes are not related to the distribution of data points in the disorientation-angle diagrams.
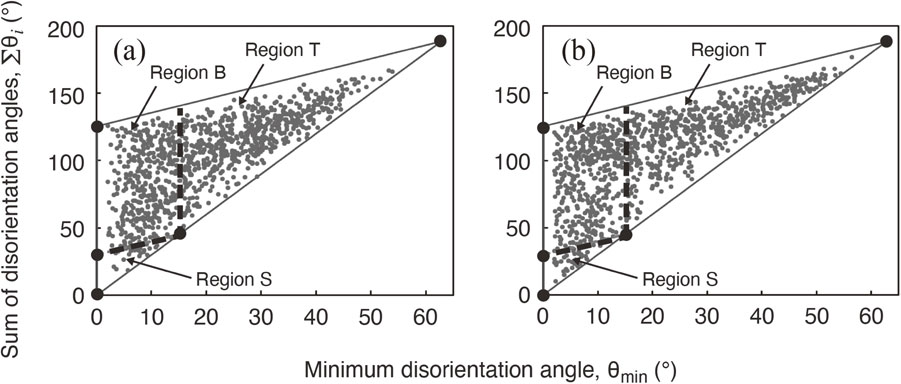
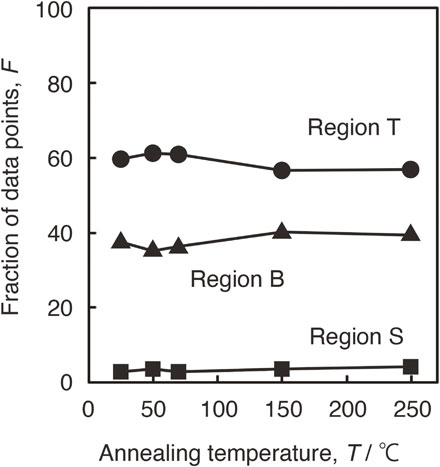
Comparing the results in Figs. 7(a) and (b) with those in Fig. 5 for randomly oriented grains around the same number of triple junctions, we found that the frequencies of the data points in regions T and S were much higher than those for randomly oriented grains. Including the results shown in Figs. 7(a) and (b), Fig. 8 show the fractions of data points in regions T, B and S as a function of annealing temperature T. The fractions of data points in regions T, B and S were almost independent of the annealing temperature T. The averages of the fractions for regions T, B and S ($F_{\text{T}}^{\text{ave}}$, $F_{\text{B}}^{\text{ave}}$ and $F_{\text{S}}^{\text{ave}}$, respectively) were
| \begin{equation*}
F_{\text{T}}^{\text{ave}} = 59.1\%,\ F_{\text{B}}^{\text{ave}} = 37.6\%\ \text{and}\ F_{\text{S}}^{\text{ave}} = 3.3\%.
\end{equation*}
|
The above experimental values of
$F_{\text{B}}^{\text{ave}}$ and
$F_{\text{S}}^{\text{ave}}$ for deformed and annealed aluminum are much higher than the values for triple junctions composed of randomly oriented grains (6.63% for region B and 0.04% for region S).
6) The value of
$F_{\text{T}}^{\text{ave}}$ is hence lower than 93.33%, which is the value of region T for randomly orientated grains.
6)
6. Self-Similarity of Triple Junctions
As shown in Fig. 2, the grain size d of deformed aluminum increased with increasing the annealing temperature T from 0.63 µm at RT to 1.20 µm at 250°C. The specimen annealed at RT was that after severe plastic deformation, which was used for SEM/EBSD observation at RT. Severe plastic deformation causes generation of sub-boundaries and subdivision of initial coarse grains.13) In the present aluminum specimens, heat treatment after the severe plastic deformation caused grain growth by motion of grain boundaries without nucleation of new grains.
The grain growth from Fig. 1(a) to (e) is the decrease in the density of triple junctions. There are two possibilities for the grain growth. The first is the motion of high-angle boundaries with elimination of low-angle boundaries. The second is that grain growth maintains a similar structure of triple junctions composed of high- or low-grain boundaries. The disorientation-angle diagrams at RT and 250°C shown in Figs. 7(a) and (b) were similar. The fractions of regions T, B and S were independent of the annealing temperature (Fig. 8). As shown in Fig. 1, equiaxial shapes of grains were maintained during the grain growth. In addition to the self-similarity of the grain shapes,12) we also found self-similarity of the distribution of disorientation angles around the triple junctions during the grain growth.
7. Conclusions
To understand the structures of triple junctions in polycrystals intuitively, characterization of triple junctions has been performed by considering the disorientation angles among grains around the triple junctions. Disorientation-angle diagrams that relate θmin and Σθi = θmin + θmid + θmax were constructed for the triple junctions in deformed and annealed aluminum specimens, where θmin, θmid and θmax are three disorientation angles for each triple junction, which satisfy θmin ≤ θmid ≤ θmax. The disorientation-angle diagrams of aluminum before and after grain growth were very similar. This means self-similarity of the distribution of disorientation angles around the triple junctions during the grain growth.
Acknowledgment
This work was supported by JSPS KAKENHI Grant Number 22K04668.
REFERENCES
- 1) S. Onaka, F. Tajima, S. Hashimoto and S. Miura: Acta Metall. Mater. 43 (1995) 307–311. doi:10.1016/0956-7151(95)90286-4
- 2) S. Kobayashi, S. Tsurekawa and T. Watanabe: Acta Mater. 53 (2005) 1051–1057. doi:10.1016/j.actamat.2004.11.002
- 3) G.L. Wu and D. Juul Jensen: Acta Mater. 55 (2007) 4955–4964. doi:10.1016/j.actamat.2007.05.019
- 4) T. Okada, H. Hisazawa, A. Iwasaki, S. Amimoto, J. Miyaji, S. Shisawa and T. Ueki: Mater. Trans. 60 (2019) 86–92. doi:10.2320/matertrans.M2018296
- 5) G.B. Hardy and D.P. Field: Metall. Mater. Trans. A 46 (2015) 2273–2284. doi:10.1007/s11661-015-2800-0
- 6) F. Yoshimasu, N. Miyazawa, N. Nakada and S. Onaka: J. Mater. Sci. 57 (2022) 3010–3017. doi:10.1007/s10853-021-06729-w
- 7) Y. Iwahashi, Z. Horita, M. Nemoto and T.G. Langdon: Acta Mater. 46 (1998) 3317–3331. doi:10.1016/S1359-6454(97)00494-1
- 8) P.R. Rios and D. Zöllner: Mater. Sci. Technol. 34 (2018) 629–638. doi:10.1080/02670836.2018.1434863
- 9) J.K. Mackenzie and M.J. Thomson: Biometrika 44 (1957) 205–210. doi:10.1093/biomet/44.1-2.205
- 10) J.K. Mackenzie: Biometrika 45 (1958) 229–240. doi:10.1093/biomet/45.1-2.229
- 11) S. Onaka: Philos. Mag. 100 (2020) 1703–1715. doi:10.1080/14786435.2020.1733695
- 12) M. Frary and C.A. Schuh: Phys. Rev. B 69 (2004) 134115. doi:10.1103/PhysRevB.69.134115
- 13) N. Hansen: Metall. Mater. Trans. A 32 (2001) 2917–2935. doi:10.1007/s11661-001-0167-x