Abstract
This study aims to establish fundamental knowledge for online non-destructive inspection in the laser quenching process utilizing acoustic emission. Acoustic emission is the transient elastic wave phenomenon due to release of strain energy in a solid material. And it is well known that the martensitic transformation can induce the acoustic emission. In this study, the acoustic emission monitoring of martensitic transformation during laser quenching experiment was conducted with the chromium molybdenum carbon steel (SCM440 in Japanese Industrial Standards) as the specimen. The experiment was carried out with seven kinds of laser irradiation power for different volume generation of heat-affected zone. After experiment, the martensite structure was confirmed at the heat-affected zone and the volume of the martensite structure within the zone was estimated. Only the specimen irradiated by the lowest laser power had no martensite structure. The acoustic emission waves were analyzed using parameters that showed the generation time duration and scale of source phenomenon. As a result, the relationship between the volume of martensite structure and information of acoustic emission was positive. It was suggested that the acoustic emission monitoring have application for the online non-destructive inspection for the laser quenching process.
This Paper was Originally Published in Japanese in J. Japan Inst. Met. Mater. 84 (2020) 335–343.
1. Introduction
In recent years, industrial applications of laser technology have been attracting attention, and its practical use is diverse, including material removal processing, melt processing, and surface modification.1,2) In surface modification, there is laser quenching, in which surface quenching is obtained from local heating of carbon steel by laser irradiation and rapid cooling by the self-cooling capability of carbon steel. This has the advantage that the surface hardening can be performed by irradiating only the necessary portion of the product, even if the shape of the product is complex. The quenched product must be inspected in the process to ensure that it meets the specified standards. In the inspection of hardened products, a cut cross-section of the hardened part of sampled product is polished and etched, and then the martensitic structure in the heat-affected zone (HAZ) after quenching is confirmed by cross-sectional observation with a microscope, and the quality of the hardened layer is guaranteed by conducting hardness tests. Therefore, the production process is time-consuming and labor-intensive, and it is difficult to inspect all of the products. There are non-destructive inspection methods for surface hardened products that check the depth of the hardened layer using ultrasonic, magnetic, eddy current, and potential difference methods.3) However, these methods may be difficult to inspect products with complex shapes, such as those used for laser quenching, due to limitations in the probe method and shape.
In this study, we focused on the use of acoustic emission (AE),4) a phenomenon in which elastic energy stored in a solid material is released as the transient elastic waves when the solid material is deformed or fractured by an external force. The hardening of carbon steel by quenching is caused by the martensitic transformation from rapid cooling start with the austenitic state and since this martensitic transformation is a non-diffusive lattice transformation with lattice distortion, it is well known that AE is also generated during the martensitic transformation.5) AE is an elastic wave that propagates inside a solid material from its source and eventually reaches the surface of the solid, making it possible to non-destructively and in-situ observe the phenomenon that generated the AE. The purpose of this study is to investigate a non-destructive in-situ inspection method for laser quenching of carbon steel by detecting AE generated by martensitic transformation during laser quenching and comparing it with the volume of HAZ or martensitic structure generated in the specimen. If this non-destructive in-situ inspection method can be studied, it will lead to a reduction in the number of conventional sampling inspections in the production process, a reduction in the time and labor required for destructive inspection, and the possibility of total inspection by the non-destructive in-situ inspection method for laser quenched products, which are considered to have relatively high product unit costs.
As a related previous study, a study on surface quenching of carbon steel by YAG laser and application of AE observation to evaluation of the quenching state was published. The conclusion was stated as “AE is effective as a non-destructive method to inspect the hardness of the quenched area”.6,7) However, the relationship between the volume of martensitic structure obtained after laser quenching and the behavior of AE has not been clearly stated. Therefore, the purpose of this study was to investigate the relationship between the volume of martensitic structure generated by laser quenching and the observed AE. If the obtained findings can be added to previous studies, a more valuable non-destructive in-situ inspection method for laser quenching using AE can be proposed. In addition to this, AE observation of martensitic structure formation in spot welds of carbon steel has been published in the past.8) Since the formation of martensitic structure in welded joints of carbon steel after welding may cause a decrease in ductility of the welded joint. It is considered useful to observe the formation of martensitic structure using AE. Although laser welding technology has been developed in recent years, there have been few cases in which AE observation was used for the formation of martensitic structure in laser welded joints. Depending on the results of this research, a non-destructive in-situ inspection method for martensitic transformation during laser welding also can be proposed.
In this study, circular laser quenching experiments on chromium molybdenum steel using a fiber laser were conducted under several laser power conditions, and AE associated with martensitic transformation was observed in each condition. The formation of HAZ, or martensitic structure, in the specimens was confirmed. And its estimated volume was calculated and compared with the AE data compiled using selected parameters.
2. Experiment
2.1 Specimen
The chromium molybdenum carbon steel in the Japanese Industrial Standards, JIS G 40539) SCM440 (corresponding to 42CrMo4) which has good hardenability, was prepared as the specimen. The initial structure was the ferrite-pearlite due to the normalization that has been air-cooled after being held at 830°C for 1 h. Table 1 shows the chemical composition of SCM440 (standard values),9) the Ac3, Ac1, and Ms transformation temperature10) and the upper critical cooling rate10) read from the CCT diagram of SCM440 published in the Ref. 10). For example, quenching within 5 s from Ac3 to Ms temperature, only the martensitic transformation occurs. For the laser quenching and AE detection experiments, the specimens were machined to dimensions of 20 mm (length), 20 mm (width), and 12 mm (thickness) as shown in Fig. 1. To ensure that the AE sensor adheres closely to the specimen, the side surface on which the AE sensor is mounted was polished to a mirror finish by emery paper and buffing.

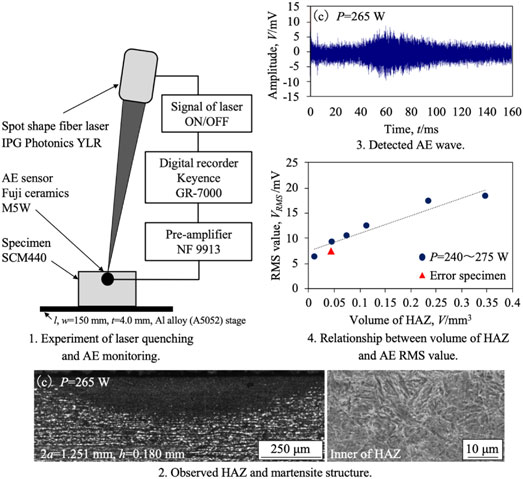
Figure 2 shows a schematic diagram of the laser quenching and AE detection experiments. In this experiment, local heating was applied to the specimen using a circular fiber laser, and quenching was performed by rapid cooling due to the specimen’s self-cooling capability after the end of heating. The experiments were conducted in air at 27.0°C. The specimens were mounted on 150 mm (length), 150 mm (width), and 4.0 mm (thickness) aluminum alloy (A5052) stage. The laser irradiation position was set to the center of the top surface of the specimen as shown in Fig. 1. The circular fiber laser was set to irradiate for 3 seconds at a distance of +34 mm defocus, and then automatically stop immediately. The maximum laser power was 275 W and we decreased it from 275 to 260 W by every 5 W and from 260 to 230 W by every 10 W as the condition. Although this research was conducted using local heating and quenching without laser scanning, it is necessary to study the case of heating and quenching an arbitrary region of a specimen by laser scanning in the future. In order to estimate the maximum temperature Tmax of the heating spot and the time Δt to reach the Ms temperature after laser stop, the heat conduction analysis was performed using CAE software. Table 2 shows the results by the heat conduction analysis. The analysis model included the A5052 stage.


Table 2 Simulated maximum temperature and cooling time to Ms temperature of heated surface spot.
The AE generated during the experiment was detected by an AE sensor attached to the top center of the side surface of the specimen as shown in Fig. 1. The receiving surface of the AE sensor, 5 mm in diameter, was attached to the specimen using high vacuum grease as the couplant, and the AE sensor securely fixed with constant pressure by a clip-shaped fixture. As shown in Fig. 2, the AE wave signal detected by the sensor (100 k to 10 MHz, wideband type) was 40 dB-amplified by the preamplifier and recorded on the high-speed digital recorder (sampling frequency: 1 MHz). Since the signal-to-noise ratio of the AE signal and the environmental noise was relatively low in this study, no threshold was set during the experiment. We recorded the AE wave signal for a total of 4 s during the experiment, 3 s from the start to stop of laser irradiation and 1 s during the subsequent quenching process. The signal of laser irradiation start and stop was also recorded simultaneously.
2.3 Specimen observation and hardness test
After the laser quenching experiment, the visual check of heating trace, spot, which is a laser heating mark on the top surface of the specimen, and the vertical section of the specimen (cross-section in the direction of the specimen thickness) through the center of the spot were observed with a confocal laser microscope, and the inside of the HAZ was observed with a scanning electron microscope (SEM). The specimen was cut to a length slightly larger than 10 mm using a precision cutting machine, and the radius of the spot was measured from the top surface of the specimen using an optical microscope. And then, the vertical section of specimen was made by precise grinding machine that the spot to be precise semicircle. The vertical section was mirrored, and etched with 3% nital solution for the observation. The HAZ by laser quenching appears as the bow shape in the vertical section as shown in Fig. 3, therefore, the HAZ is considered to be the spherical crown shape. The maximum width 2a and the maximum depth h of the HAZ observed in the bow shape were measured using the measurement function of the confocal laser microscope, and the estimated volume of this HAZ was obtained from following eq. (1) for calculating the volume of the spherical crown.
| \begin{equation}
V = \frac{1}{6}\pi h (3a^{2} + h^{2})
\end{equation}
| (1) |
Finally, the micro-Vickers hardness test was conducted at the center of HAZ and at the distanced point from HAZ that was not affected by the laser heating.
2.4 AE parameter used in this study
The AE data including the environmental noise was sent from the high-speed digital recorder to the personal computer after the experiment, and the data was analyzed offline. We focused on the AE in the quenching process after laser irradiation stop. The threshold value was set to the noise level, and the AE count number11,12) that is one of AE parameter was aggregated. As shown in Fig. 4(a), the AE count number refers to the number of times the AE amplitude exceeds the threshold value. From the cumulative number that summarized on the time axis, the occurrence frequency of AE source phenomena can be grasped as shown in Fig. 4(b). The duration of AE was specified with reference to the transition of the cumulative number of AE counts, and the root mean square (RMS) value12) was calculated in this time zone. The RMS value is obtained by eq. (2). The RMS value is an AE parameter that equivalent to the AE source energy.
| \begin{equation}
V_{\textit{RMS}} = \sqrt{\frac{1}{T}\int_{t_{0}}^{t_{1}}[f_{(t)}]^{2}dt}
\end{equation}
| (2) |
where
f(t) represents the AE wave and
T =
t1 −
t0 represents the AE duration.
3. Results and Discussions
3.1 Observation of surface and cross-section of laser quenched area, and volume of HAZ
As shown in Fig. 5, heating marks, the spot, appeared on the top surface of the specimens that were subjected to laser quenching experiments. Visual inspection and comparison of the appearance of the spots for each laser power revealed a clear difference in aspect between the 240 W and 230 W laser powers, but other than that, it was difficult to determine the difference in the degree of local heating for the 5 W and 10 W laser power differences. However, measurements using an optical microscope confirmed that the larger the laser power, the larger the spot diameter. Figure 6 shows the results of confocal laser microscope observation of the vertical section through the center of the spot and SEM observation of the microstructure inside the HAZ, which were performed according to the method described in Section 2.3. Except for the 230 W laser power, the HAZ appeared in the vertical section in the form of an bow as shown in Fig. 3. Therefore, the HAZ is considered to be a spherical crown shape. And also, it was confirmed that the maximum width and depth of the HAZ increased with increasing laser power. Table 3 shows the estimated volume of the HAZ for specimens other than the 230 W specimen, where HAZ was observed, calculated by substituting the maximum width and depth of the HAZ into eq. (1). It can be confirmed that the larger the laser power, the larger the volume of the HAZ.


Table 3 Estimated volume of HAZ.
The right side of Fig. 6 shows the results of SEM observation inside the HAZ. Based on the Ac3, Ac1, and Ms temperatures and upper critical cooling rates of SCM440 shown in Table 1, and the maximum temperature at the heating spot and the estimated time to reach the Ms temperature after the laser is stopped based on heat conduction analysis shown in Table 2, it is considered that before quenching austenite is formed at laser powers above 260 W, ferrite-austenite is formed at 250 W, and ferrite-pearlite is kept at 230 W and 240 W, respectively. Therefore, it was estimated that no martensitic structure was observed from 230 W and 240 W specimen. However, the results showed that needle-like martensitic structures were observed at laser powers of 240 W and higher. The observation at 250 W of laser power did not reveal any ferrite that had not become austenite during heating. In addition, the martensitic structure was also observed at 240 W, suggesting that the material was heated to a higher temperature in the experiment than estimated by the heat conduction analysis. The reflection and absorption of the laser beam are affected by the surface properties of the material, which may explain the difference between the experimental and thermal conductivity analysis results. The ferrite-pearlite structure was observed in the area outside the HAZ of the samples with laser powers of 275 W to 240 W and in the vertical section of the sample with 230 W.
3.2 Result of hardness test at cross-section of laser quenched area
Table 4 shows the results of the micro Vickers hardness test conducted at the center of HAZ, and at the distanced point from HAZ. The hardness number of the HAZ column in 230 W laser power is the result at directly under of the spot. The hardness of the outside HAZ and the 230 W specimen were about HV = 200 MPa, thus it can be confirmed again that the ferrite-pearlite structure existence. On the other hand, the center of HAZ show HV = 500 MPa or more hardness number. The limit hardness of the effective hardened layer specified in JIS G 055913) is HV = 400 MPa for carbon content between 0.33% and 0.43%, or HV = 450 MPa for carbon content between 0.43% and 0.53%. The hardness numbers of HAZ center meet the surface quenching criteria in japan, JIS G 0559. Therefore, it is judged that the laser quenching experiment was carried out appropriately and the martensitic structure generation was recognized.

Table 4 Vickers hardness number of HAZ and outer HAZ.
Figure 7 is a typical example of the AE waveform detected during the laser quenching experiment. The laser power condition in Fig. 7 is 275 W. It was recorded for 4 s from the start of laser irradiation. Figure 7 also includes the square wave signal. This is a signal indicating laser ON (t = −3 s, overlapped with the vertical axis) and OFF (t = 0 s). The continuous AE with larger amplitude than the noise level was observed for 3 seconds during laser irradiation. It is considered that the behavior is due to local heating. Then, at the same time as the laser irradiation was stopped at t = 0 s, the continuous AE disappeared and new AE that seems to contain the information on martensitic transformation occurred at about t = 0.1 s during the quenching process. After that, AE decreased to the noise level.

Figure 8 shows the extracted AE waveform from t = 0 to 160 ms, t = 0 s is the moment when the laser irradiation is stopped, of each laser power condition. The AE that has the peak at about t = 100 ms (0.1 s) focused on in Fig. 7 (275 W) was decreased its amplitude to the noise level as the laser power decreases. And it cannot confirm in 230 W. Based on the martensitic structure formation in the HAZ shown in section 3.1 and the change in volume with each laser power, the volume of HAZ and martensitic transformation as the AE source phenomenon were increased by the laser power increasing, and it was thought that the amplitude of AE was followed. It is a little slower than the estimated time to reach the Ms temperature in Table 2. But as confirmed from the microstructure observation inside the HAZ, it was assumed that the specimen in the experiment was heated more than the analysis. Thus it was accordingly cooled and the time may has been also delayed. In addition, the AE generation time which was t = 100 ms in the case of 275 W has become faster with the laser power decreases. The AE generation time of 240 W was becoming about t = 40 ms. Because the larger heat input makes longer time for reach the Ms temperature, the AE generation time was becoming later in order. The estimated arrival time to Ms temperature in Table 2 has the same behavior. The latest AE generation time is 100 ms at 275 W case, but it is satisfactory as the cooling rate for martensitic transformation.

Aside from the AE we focused above, the burst type AEs were prominently detected until about t = 40 ms in 275 W and about t = 20 ms in 270 W. But the waveform by 265 W or less laser power are not noticeable or clearly not seen. It is considered to correspond to a different source than the AE whose amplitude changed with laser power and martensitic structure volume. These AE occurred earlier than the AE of martensitic transformation mentioned above. In addition, it was appear only in high-power laser power conditions. We thought that the contraction behavior at the heated spot after thermal expansion was worked as the source of this burst type AE. After laser irradiation stop, it is thought that the cooling process and contraction behavior start, then, the accumulated strain due to the thermal expansion will be released as the energy at the same time. A more detailed investigation is required, however, it may be used as the information for knowing that an unintended phenomenon other than the martensitic transformation occurred during the laser quenching process.
3.4 Calculation of RMS value with AE counts and relationship with volume of HAZ
Figure 9 summarizes the amplitude of AE exceeding the noise level threshold and the cumulative number of AE counts for each of the laser power waveforms shown in Fig. 8, versus elapsed time. The plot shows the amplitude of AE exceeding the noise level threshold, and the solid line shows the cumulative number of AE counts. 275 W laser power had the largest total number of AE counts, and the number decreased with decreasing laser power, i.e., with decreasing martensitic structure volume. In the case of 230 W laser power, AEs at the time of laser irradiation stop accounted for most of the total AE counts, and only three AEs exceeding the threshold value occurred from then until t = 160 ms.

Because it is difficult to determine the AE duration from the start to finish of martensitic transformation from the waveforms in Fig. 8, we judged it from the time for beginning and converging of the cumulative number increasing in Fig. 9. For example about 275 W, the amplitude of plot and the cumulative number are both increase from t = 53.2 ms, when and the cumulative number reaches to the maximum at t = 149.2 ms with the amplitude decreasing. Therefore, it can be decided that the AE in this time zone was due to the martensitic transformation. Except for the result of 230 W in which the martensite structure and AE were not confirmed, the duration was determined for the other results. And we calculated the RMS value based on eq. (2) using the AE duration determined. Figure 10 is the relationship between the RMS value and the volume of HAZ, martensitic structure. About one different triangle plot (▲), it will be described in the next section. The volume of the martensitic structure and the RMS value of AE were in a nearly linear relationship. Since the RMS value represents the energy of the AE source, it can be understood that the reasonable result was obtained.

Based on the above results and observations, it can be said that the volume of martensitic structure generated during laser quenching can be estimated by observing and extracting AEs generated during laser quenching and summarizing the RMS values of these AEs. In this study, the volume of the source of AE, i.e., the HAZ that underwent martensitic transformation, and the RMS value that correlates to the energy at the source are used as parameters to summarize the results. It is also thought that the results of total number of AE counts or the AE duration can be utilized as an AE parameter.
3.5 Verification of unknown laser irradiation power
In the proceeding of experiment, one abnormal case was occurred in the case of 270 W laser power condition. Figure 11 shows the spot appearance on specimen. The spot diameter was smaller than 270 W in Fig. 5 and it is close to 250 W. The possible causes are thought as the error of laser or control system, human error, or insufficient heating due to laser reflection caused by the difference of upper surface finish of specimen. True laser power is unknown. As shown in Fig. 12, the HAZ observation was also conducted and the martensitic structure was confirmed with measuring the maximum width 2a and the maximum depth h. The volume of martensitic structure was 0.0440 mm3, thus this result of laser quenching is similar to the 250 W one. The Vickers hardness was 577 HV. Figure 13 and 14 shows the observed AE and cumulative number of AE counts. The calculated RMS value was 7.39 mV·ms by the same method as shown in Section 3.4. The triangle plot in Fig. 10 is based on this RMS value and volume.

Even in such abnormal case, it is considered that the volume estimation of martensitic structure is possible from the AE observation.
4. Conclusion
The AE monitoring during the laser quenching process of SCM440 was conducted using the circular fiber laser. The conclusions obtained are described below.
-
(1)
The spherical crown shaped HAZ was generated by the circular laser quenching experiment. From the results of the structure observation and micro Vickers hardness test of the HAZ, it was confirmed that the martensitic structure formation. In the case of 230 W laser power condition, the HAZ and martensite structures was not confirmed.
-
(2)
The estimated volume of the martensite structure generated by the laser quenching experiment was increased by the increasing of laser power condition.
-
(3)
The AE was detected during the laser quenching experiment. The AE was confirmed in the quenching process after the laser irradiation stop and it was decreased with the decreasing of the estimated volume of martensitic structure. The AE duration was judged from the information of AE counts and the RMS value of AE wave was calculated. There was reasonable positive relationship between the volume of martensitic structure and RMS value of AE.
-
(4)
About the specimen that was quenched by unknown laser power, the volume of martensite structure could be estimated from the obtained AE information.
Acknowledgments
This work was supported by JSPS KAKENHI Grant Number JP19K05087.
REFERENCES
- 1) The Laser Society of Japan: Laser Handbook, (Ohmsha, Tokyo, 2005) VIII, Chapter 35.
- 2) H. Hagino and T. Yamaguchi: J. Vac. Soc. Jpn. 56 (2013) 315–321. doi:10.3131/jvsj2.56.315
- 3) N. Iwata and N. Kato: Inspection Engineering 15(11) (2010) 76–79.
- 4) The Japanese Society for Non-Destructive Inspection: Acoustic Emission Testing -Diagnostics of Machines-, (JSNDI, Tokyo, 2014) pp. 1–5.
- 5) M. Ohtsu: Characteristics and Theory of Acoustic Emission, (Morikita Publishing, Tokyo, 2005) pp. 4–6.
- 6) M. Takuma, N. Shinke and K. Fujii: Proc. M & M 2010 Strength of Materials Conference, (JSME, 2010) pp. 421–423.
- 7) M. Takuma, N. Shinke, Y. Takahashi and N. Yamashita: Proc. 18th National Conference on Acoustic Emission, (JSNDI, 2011) pp. 19–22.
- 8) S.M.C.V. Bohemen, M.J.M. Hermans and G.D. Ouden: J. Phys. D 34 (2001) 3312–3317. doi:10.1088/0022-3727/34/22/316
- 9) Japanese Industrial Standards Database, Japanese Industrial Standards Committee: Low-alloyed steels for machine structural use, JIS G 4053. https://www.jisc.go.jp/app/jis/general/GnrJISSearch.html, (cited 2020-05-27).
- 10) The Japan Institute of Metals and Materials: Metal Data Book, (Maruzen, Tokyo, 2004) p. 479.
- 11) H. Nakamura: J. JIME 52 (2017) 303–308. doi:10.5988/jime.52.303
- 12) The Japanese Society for Non-Destructive Inspection: Acoustic Emission Testing -Diagnostics of Machines-, (JSNDI, Tokyo, 2014) pp. 225–226.
- 13) Japanese Industrial Standards Database, Japanese Industrial Standards Committee: Steel-determination of case depth after flame hardening or induction hardening, JIS G 0559. https://www.jisc.go.jp/app/jis/general/GnrJISSearch.html, (cited 2020-05-27).