Abstract
AlSi10Mg alloy products with a hydrogen content of approximately 3.9 or 5.6 cm3/100 g-Al of hydrogen were fabricated by selective laser melting (SLM) using normal (as-received) and moist powders, and their non-reversible dimensional changes during heat treatment at 473 or 803 K were investigated. The linear dimensional change arising from the heat treatment at 473 K was approximately 0.22% by 3.6 ks and remained constant thereafter. This behavior was independent of the amount of hydrogen in the SLM products, suggesting that the dimensional changes at 473 K were induced by precipitation of Si phase from the α-Al phase. However, the linear dimensional changes during the heat treatment at 803 K were comparatively large and continued to increase during the heat treatment. At the same time, the linear dimensional changes at 803 K also showed a dependence on the amount of hydrogen in the SLM products. These phenomena indicated that the porosity expansion and precipitation of Si phase occurred simultaneously at 803 K. For the SLM product with a hydrogen content of approximately 3.9 cm3/100 g-Al, the linear dimensional change during the heat treatment at 803 K was 0.867% at 18 ks, of which 0.116% and 0.751% were estimated to have been induced by the precipitation of Si phase and the porosity expansion, respectively. From gas analyses using different methods, it was elucidated that the hydrogen desorbed from the powder and was entrapped in the SLM products at the time of laser scanning, and then enriched to the porosities during the heat treatment at 803 K, causing the porosity expansion.

1. Introduction
Additive manufacturing (AM) is a technique that can make net-shaped products based on digital models;1–3) thus, it is a suitable fabrication process for automotive components in particular for maintenance parts for discontinued vehicles or low-volume production parts. Laser powder bed fusion (L-PBF), also known as selective laser melting (SLM), is an AM technique used for metals. AlSi10Mg alloy, because of its low susceptibility to solidification cracking, is commonly used for SLM. This alloy has also been widely used for automotive components. Therefore, it is advantageous to fabricate AlSi10Mg alloy products by SLM.
For automotive components, however, the dimensional precision and stability of SLM products are important issues of concern. Aluminum alloys containing supersaturated solid solution elements may undergo dimensional changes during heat treatment or long-term use, owing to the precipitation of these elements.4–11) These kinds of dimensional changes are known as “growth” for aluminum alloys, since the changes are often positive (expansion).4) AlSi10Mg alloy processed by SLM contains more than 1.6 wt% of solute Si in the α-Al phase at as-built state11–17) due to the high cooling rate,16,18) and thus shows a linear dimensional change of 0.17% during heat treatment at 423 K.11) This is much higher than that for the same alloy processed by the conventional casting technique.10)
Moreover, the heat treatment conditions used for T6, i.e., a solution treatment followed by artificial aging, is often performed to improve the mechanical properties of AlSi10Mg alloy products. However, AlSi10Mg alloy processed by SLM contains large amounts of hydrogen,19,20) resulting in porosity expansion during high-temperature heat treatment,20–22) which causes large dimensional changes in the SLM products. As already reported, the moisture on the surface of the powder is the dominant source of hydrogen in SLM products. Thus, drying the powder can reduce the amount of hydrogen and the porosity of SLM products,20) leading to a low porosity expansion during high-temperature heat treatments.20–22)
In this study, as-received AlSi10Mg alloy powder was exposed to a humid environment to obtain powders with a high moisture content on their surface. The as-received powder and the moist powder were processed by SLM to fabricate specimens containing different amounts of hydrogen and the dimensional changes arising from heat treatments at 473 and 803 K were investigated. Four kinds of gas analysis techniques were applied to correlate the moisture on the powder surface and the dimensional changes associated with the precipitation of Si and the porosity expansion. It was found that increasing the moisture on the surface resulted in comparatively high amounts of hydrogen in the SLM samples, which promoted the porosity expansion during the heat treatment at 803 K. In contrast, the dimensional change at 473 K was independent of the amount of hydrogen in the SLM samples.
2. Methods
2.1 Powders for SLM processing
The AlSi10Mg alloy powder was supplied by LPW Technology UK with D10, D50, and D90 values of 25, 41, and 66 µm, respectively (hereafter referred to as normal powder). Its chemical composition provided by the supplier is listed in Table 1. Observation of the normal powder under an optical microscope showed that the particle shape was globular with internal pores present in some of the particles, as shown in Fig. 1.
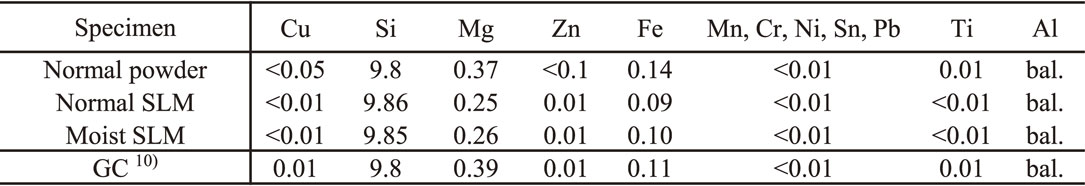
Table 1 Chemical composition of specimens (wt%).

The normal powder was exposed to a humid environment in order to prepare powders containing high levels of moisture (hereafter referred to as moist powder). In this process, 0.5 kg of the normal powder and 3 g of water in a glass tray were placed in a sealed chamber. In this study, heavy water (D2O), i.e. water in which hydrogen (H) atoms are replaced by deuterium (D) atoms, was used as a tracer. The purity of the D2O was higher than 99.8%. Then, the chamber was evacuated to 0.01 MPa and filled with argon (Ar) to 0.09 MPa. This cycle was repeated three times. During Ar filling, the D2O liquid remained in the chamber since its vapor pressure was below 0.01 MPa. After Ar filling, the relative humidity in the chamber increased to 80% in 1 h and 99% in 20 h. The powder was kept for 48 h in the chamber. The temperature during this treatment was kept between 293 and 296 K. Some of the D2O liquid remained in the chamber after the treatment. In this study, 2.5 kg of the moist powder was prepared in total.
2.2 SLM
Tall cylinders 12 mm in diameter and 46 mm in height, short cylinders 9 mm in diameter and 25 mm in height, and rectangular blocks 22 × 22 mm2 square and 27 mm in height were fabricated from the normal and moist powders using a SLM machine (SLM280, SLM Solutions) equipped with multiple fiber lasers in a high-purity Ar atmosphere. The layout of these samples, the Ar flow direction and the powder re-coating direction for each layer are shown in Fig. 2. The samples were fabricated on a stainless-steel substrate (100 × 100 mm2). The alignment of the samples was inclined at 45° to the edge of the substrate, i.e., inclined toward the Ar gas flow and the powder re-coating directions, to avoid contamination by sputtered particles from adjacent samples, especially for the moist powder. During the SLM process, the substrate temperature was kept at 423 K.

The laser scanning strategy and the typical processing parameters were almost the same as those used in a previous study11) and are shown in Fig. 3 and Table 2. The laser scanning strategy was designed by commercial software (Magics, MATERIALISE). In each layer of the cylindrical samples, the powder was scanned twice from outside to inside to form the skin of the sample (so-called “border”), then in a parallel fashion to fabricate the internal part (“hatch”), and once again to fill the gap between the skin and the internal part (“fill-contour”) as shown in Fig. 3(a). The hatch angle was rotated by 67° for each layer. Meanwhile, due to the comparatively large cross-sectional area, the hatch region in the rectangular sample was divided into several parts automatically and randomly. In each layer of the rectangular sample, the hatch laser was scanned in a parallel fashion in the same direction for all parts, overlapping at the edge of each part. An example of the laser scanning strategy used for the rectangular sample is shown in Fig. 3(b). The fabrication process and subsequent cooling to 313 K took 13 h and 4 h respectively.


Table 2 Parameters used for SLM process.
After the SLM process, the tall cylinders, rectangular blocks and short cylinders were machined to 10 mm in diameter and 45 mm in length (hereafter referred to as SLM rods), 20 × 20 × 25 mm3 (hereafter referred to as SLM blocks), and 7 mm in diameter and 10 mm in length (hereafter referred to as SLM short rods), respectively. This means that the border and fill-contour parts were completely removed by the machining. The SLM rods and blocks were used for investigating the dimensional changes arising from the heat treatment and for analyzing the amount of gas in these specimens. The SLM short rods were used for microstructural observations.
The chemical compositions of the SLM specimens made from the normal and moist powders (hereafter referred to as the normal SLM specimens and moist SLM specimens, respectively) were analyzed by inductively coupled plasma - optical emission spectrometry (ICP-OES; PS3520UVDDII, HITACHI) and are listed in Table 1. The compositional difference between the normal and moist SLM specimens was small, although the Mg content in the SLM specimens was slightly lower than that for the normal powder.
2.3 Heat treatment
The SLM rods and blocks were heat-treated at 473 K for 360 ks (100 h) and 803 K for 18 ks (5 h) using a furnace capable of suppressing temperature fluctuations in the specimens to within ±1 K. To monitor the density variations of the specimens during the heat treatment, the specimens were taken out from the furnace at certain intervals and water-quenched to measure the density, and then put back into the furnace.
2.4 Density measurements and linear dimensional changes
The density of the SLM specimens was determined by Archimedes’ method. The specimen was weighed in both air and water using a balance with an accuracy of ±0.0001 g (H31AR, Mettler). Deionized water was used for the measurement. The temperature for density measurement was between 291 and 297 K. The volume of the specimen at 298 K was calculated considering the density change of the water and the thermal expansion coefficient of the AlSi10Mg alloy (2.1 × 10⁻⁵ K−1). The density of the specimen at 298 K was obtained by dividing its weight in air by its volume at 298 K.
The linear dimensional change ΔL [%] induced by the heat treatment is expressed by
| \begin{equation}
\Delta L = \left[\left(\frac{\rho^{\text{A}}}{\rho^{\text{B}}} \right)^{1/3} {}- 1 \right] \times 100
\end{equation}
| (1) |
where ρ
A and ρ
B are the densities of the specimen before and after heat treatment, respectively. The maximum error in the linear dimensional change due to the error in the density measurements was estimated to be Δ
L ± 0.002%.
11)
2.5 Gravity casting
Gravity casting (GC) specimens containing a small amount of hydrogen were heat-treated for comparison. The procedures for fabricating the GC specimens and the heat treatment conditions are described elsewhere.10) In brief, the AlSi10Mg alloy melts were degassed at 1023 K for 1200 s using an evacuated furnace and poured into steel and copper molds. The chemical composition of the GC specimens is listed in Table 1. The steel mold castings were machined into rectangular shapes with dimensions of 20 × 20 × 10 mm3 and solution-treated at 803 K for 86.4 ks. The GC specimens were completely homogenized, and the concentrations of Si and Mg in the α-Al phase were increased to the equilibrium values through the solution treatment. In addition, the solution-treated specimens were heat-treated at 473 K for 1800 ks. The densities of the GC specimens were measured in as-cast, solution-treated and heat-treated states. The copper mold casting was used for measuring the amount of hydrogen. These results for GC specimens have been previously reported,10) and are also adopted in the present study. The rectangular shape with dimensions of 20 × 20 × 25 mm3 machined from the steel mold casting was used as a reference in measuring the amount and composition of gases in the SLM specimens, as described below.
2.6 Characterization
2.6.1 GC specimens
The amounts of the hydrogen (H2), and other gases in the GC specimens in as-cast state were determined by the hot extraction method23) (hereafter referred to as Ransley’s method) with a hydrogen quantitation limit of 0.01 cm3/100 g-Al. Before the measurement, the specimens were machined to a diameter of 9 mm and a length of 35 mm, and were then cleaned. Then, the specimens were melted in an evacuated chamber and the total amount of absorbed gases was determined from the pressure change in the chamber. The amount of hydrogen was measured by removing it through a palladium filter.
The amounts of H2, nitrogen (N2) and Ar in the GC specimens were also measured by the inert gas fusion heat transfer method using a hydrogen analyzer (RH404, LECO) for hydrogen and an oxygen–nitrogen–argon analyzer (TC-436AR, LECO) for N2 and Ar. Ar was used as the carrier gas for H2 measurements, and helium (He) was used for N2 and Ar measurements. The weights of the GC specimens were 0.5, 0.1 and 0.3 g for the measurement of H2, N2 and Ar, respectively. The quantitation limits for H2, N2 and Ar were 0.0001, 0.005 and 0.001 wt%, respectively. The measured values were converted to gas content in terms of the volume VG (G = H2, N2 and Ar) [cm3/100 g-Al] using:
| \begin{equation}
V_{G} = w_{G} \times \frac{V^{\circ}}{\text{m}_{G}}
\end{equation}
| (2) |
where
V° is the molar volume of ideal gas,
wG is the gas content [wt%] and m
G is the molar weight of each gas.
2.6.2 Powder
The appearance of the normal and moist powders was observed by scanning electron microscopy (SEM). X-ray diffraction (XRD) was carried out to investigate the formation of compounds on the surface of the powders owing to exposure to the humid environment.
The gaseous molecules desorbed from the normal and moist powders during gradual heating were measured by temperature programmed desorption - mass spectrometry (TPDMS). For the measurements, 0.5 g of each powder loaded in a quartz tube was heated from room temperature to 1073 K at a rate of 10 K/min, while analyzing the amount and mass of the gas molecules using a gas chromatography - mass spectrometry (GC-MS) system (QP2010SE, Shimadzu) using He as a carrier gas. The quantitation limit for the GC-MS system was below 10 wt-ppb/s.
Hydrogen (H2, HD and D2), N2 and Ar desorbed from the normal and moist powders by rapid heating were measured by the inert gas fusion heat transfer method. The equipment for the measurements was the same as that used for the GC specimens. 0.2 g, 0.1 g and 0.3 g of the powders were used for the measurements of hydrogen, N2 and Ar, respectively. It should be noted that the amounts of hydrogen desorbed from the moist powder may be underestimated in this method because the desorbed gas may contain HD and D2 more than natural isotopic abundance. In this method, the amounts of hydrogen were measured from the thermal conductivity of the mixed gas of the desorbed hydrogen and the carrier gas (Ar). However, since the exact composition of the three hydrogen forms (H2, HD and D2) desorbed from the moist powder at the time of measurement was unclear, the calibration was conducted using hydrogen with natural isotopic abundance and the carrier gas. The thermal conductivity of a gas generally decreases with the increase of the molecular mass. Indeed, the thermal conductivities of H2, D2 and the carrier gas (Ar) at 300 K are 181, 142 and 17.7 mW m−1K−1, respectively.24) Thus, the amounts of hydrogen desorbed from the moist powder tend to be underestimated.
2.6.3 SLM specimens
The microstructure of the SLM short rods was observed by optical microscopy. The specimens were polished and etched by Keller’s reagent (0.5% HF, 1.5% HCl, 2.5% HNO3, and 95.5% H2O) for 30 s prior to the observation. X-ray computed tomography (XCT; TXS225UF, TESCO) was performed to determine the porosity values.
The amount of hydrogen and other gases in the SLM rods before and after the heat treatments was measured by Ransley’s method. The composition and amount of gases in the pores of the SLM blocks were determined by drilling the specimens (hereafter referred to as the drilling method) in a vacuum vessel connected to an absolute pressure gauge (390H, MKS) and a quadrupole mass spectrometer (M-101QA-TDM, ANELVA). The drilling dimensions were 3 mm in diameter and 10 mm in depth. Based on the pressure measurements, the quantitation limit of the gas amount was 1 µL. The GC specimens with dimensions of 20 × 20 × 25 mm3 were used as a reference for the drilling method since their gas content was sufficiently low.
3. Results
3.1 Normal and moist powders
Figure 4 shows SEM images and XRD patterns for the normal and moist powders. Both powders are composed of similarly agglomerated spheroidal particles. No additional compounds were identified in the SEM images or XRD patterns. This agrees with a previous study by Bauer et al.,25) where AlSi10Mg powder exposed to a humid environment below 318 K for 72 h showed no detectable changes on the surfaces, whereas that exposed to the same environment at 328 K for 72 h had compound protuberances on the surface.
Figure 5 shows TPDMS desorption profiles during gradual heating. Signals at m/z 18 are a superposition of H2O, HDO and D2O components, whereas signals at m/z 19 and m/z 20 correspond to HDO and D2O, respectively.
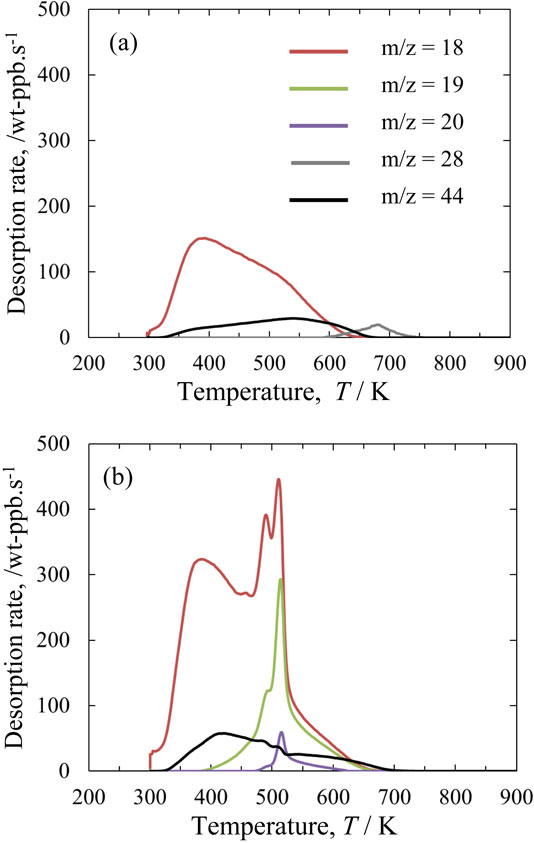
For the normal powder (Fig. 5(a)), the signal at m/z 18 was detected, while the signals at m/z 19 and m/z 20 were below the detection limit. Thus, the m/z 18 signal for the normal powder was mainly due to desorbed H2O, which occurred from 313 to 673 K, and peaked at 391 K. Meanwhile, for the moist powder (Fig. 5(b)), m/z 18, m/z 19 and m/z 20 signals were detected, indicating the presence of absorbed D2O. The temperature range where these signals were detected was the same as that for the normal powder. The desorption rate for the m/z 18 species for the moist powders was higher than that for the normal powder. The highest and second-highest peaks were found at around 513 and 493 K, respectively. These TPDMS results clearly showed that heat treatment to dry the powder prior to the SLM process was effective at reducing the moisture on the powder surface. However, it is difficult to remove surface moisture completely by heat treatment. In this study, therefore, some amount of moisture unavoidably remained in the powder until laser scanning during the SLM process.
In the TPDMS profiles for the normal and moist powders, no signals due to hydrogen isotopes (m/z 2 and m/z 3) were detected. However, a signal at m/z 44 due to carbon dioxide (CO2) was detected. Also, a signal at m/z 28 was detected between 315 and 418 K for the normal powder only. There were two possible candidates for the source of this signal, carbon monoxide (CO) and N2. However, the m/z 28 signal is presumed to be due to CO since N2 can be adsorbed only at very low temperatures. It is known that aluminum typically contains carbonated hydroxide in the form of Al–CHxO,22,26) which is a possible source of the CO2 and CO.
The total amounts of desorbed gases for the normal and moist powder during the TPDMS measurements between 296 and 1073 K are listed in Table 3. The total amount of the m/z 18 species desorbed from the moist powder was approximately two times higher than that from the normal powder, although D2O with a purity of 99.8% was used to prepare the moist powder. This may be due to the superposition of HDO and D2O components. Despite this uncertainty, it is clear that the sum of the m/z 18, m/z 19 and m/z 20 components for the moist powder was higher than that for the normal powder.

Table 3 Total amount of desorbed gases measured by TPDMS from ambient temperature to 1073 K.
The amounts of hydrogen (H2, HD and D2), N2 and Ar desorbed during rapid heating of the GC specimen, the normal powder and the moist powder measured by the inert gas fusion heat transfer method are listed in Table 4. From the GC specimen in as-cast state, a slight amount of H2 (only 0.0001 wt%) was detected, but N2 and Ar were below the quantitative detection limits. In contrast, the normal powder desorbed a comparatively large amount of H2 (0.0033 wt%) and a slight amount of N2. No Ar was detected from the normal powder. The moist powder desorbed a much larger amount of hydrogen (0.0066 wt%). It should be noted again that the amount of hydrogen desorbed from the moist powder is underestimated owing to the use of deuterium (D). Hydrogen is presumed to form by the reaction of aluminum or magnesium in AlSi10Mg alloy with water (H2O, HDO and D2O). Also, N2 and a slight amount of H2 may have been released from the pores in the powder (see Fig. 1) and from the hydrogen dissolved in the α-Al matrix, since these gases could be entrapped in the atomization process.

Table 4 Amount of hydrogen (H2, HD and D2), N2 and Ar measured by inert gas fusion heat transfer method. The values in brackets are below the quantitative detection limit.
Figure 6 shows the microstructure of the normal and moist SLM specimens in as-built state. The shape and size of the melt pools in both the specimens were almost the same. Both specimens contained pores smaller than 20 µm in diameter. The number of pores in the moist SLM specimen was much greater than that in the normal SLM specimen.

Table 5 lists the densities at 298 K of the GC and SLM specimens before and after heat treatment. The density of the GC specimen was 2661.4 kg/m3 in as-cast state, which increased to 2662.6 kg/m3 due to the heat treatment at 803 K for 86.4 ks; i.e., the GC specimen shrank by 0.015% in linear dimensions. This shrinkage is associated with the increase in the concentration of solute Si in the α-Al phase, which reduces the lattice constant of the α-Al phase.10) Toda et al. reported the generation and growth of micropores during high-temperature heat treatment of aluminum alloys containing very low levels of hydrogen.27) However, the density showed that the expansion of such microporosity was small. After the heat treatment at 473 K for 1800 ks, the density of the GC specimen decreased to 2654.5 kg/m3; i.e., the GC specimen expanded, since the solute Si and Mg in the α-Al phase completely precipitated as Si and Mg2Si phases, respectively.10) The density of the three normal SLM specimens in as-built state was about 2666 kg/m3, which is higher than that of the GC specimen, despite the existence of pores. This is due to the comparatively high concentration of solute Si in the α-Al phase.11–16) Thus, the density of the normal SLM specimen dropped below that of the GC specimen after the heat treatment at 473 K owing to the precipitation of the Si phase. Although the solid solubility of Si in the α-Al phase at 803 K was higher than that at 473 K, the density of the normal SLM specimens after the heat treatment at 803 K became lower than after the heat treatment at 473 K, suggesting that the porosity expansion occurred at 803 K. In contrast, the density of the moist SLM specimens in as-built state was lower than that of the GC specimens due to the greater porosity. The heat treatments at 473 K and 803 K also decreased the density of the moist SLM specimens.

Table 5 Density and linear dimensional change for GC and SLM specimens.
Figure 7 shows the linear dimensional change of the normal and the moist SLM specimens following heat treatments at 473 and 803 K. For both the SLM specimens, the linear dimensional change during the heat treatment at 473 K reached a maximum value of 0.2% by 3.6 ks and remained constant after 3.6 ks. This behavior was independent of the amount of hydrogen in the SLM specimens. Thus, the linear dimensional change at 473 K seemed to occur mainly due to the precipitation of Si phase. Meanwhile, the linear dimensional change arising from the heat treatment at 803 K for the normal and moist SLM specimens was much higher than that induced by heat treatment at 473 K and continued to increase with time. Also, the rate of increase of the linear dimensional change for the moist SLM specimens was higher than that for the normal SLM specimens. Thus, the linear dimensional change at 803 K is presumed to occur mainly due to the porosity expansion.

Figure 8 shows XCT images of the same cross-section of the normal SLM block in the as-built state and after heat treatment at 803 K for 18 ks. The size and number of pores clearly increased upon heat treatment.

The amount of hydrogen in the SLM specimens and the GC specimen measured by Ransley’s method is listed in Table 6. The GC specimen had a hydrogen content of only 0.18 cm3/100 g-Al, while the normal and moist SLM specimens in as-built state had a hydrogen content exceeding 3 and 5 cm3/100 g-Al, respectively. In the SLM process, laser scanning caused the desorption of large amounts of hydrogen from the powder as listed in Table 4, and the desorbed hydrogen was entrapped during the subsequent rapid solidification20) as hydrogen gas in the pores and as atomic hydrogen in the α-Al phase. Thus, the SLM specimens contained high amount of hydrogen and the use of the moist powder intended to increase the amount of hydrogen in the SLM specimens. Besides, due to the high hydrogen content in the SLM specimens and the low hydrogen solubility in solid aluminum (below 0.02 cm3/100 g at 803 K for pure aluminum28)), the solute atomic hydrogen diffuses to the pores and forms gaseous hydrogen, leading to porosity expansion. Therefore, the SLM specimens experienced a high linear dimensional change during the heat treatment at 803 K, and the linear dimensional change at 803 K depended on the amount of hydrogen in the SLM specimens. The amount of hydrogen decreased slightly after the heat treatment at 803 K. A part of the hydrogen may have diffused out of the SLM specimens.

Table 6 Amount of hydrogen measured by Ransley’s method.
Table 7 lists the composition and total amount of gases released from the normal and moist SLM specimens measured by the drilling method. The signals at m/z 2, m/z 3, m/z 4 and m/z 40 are associated with H2, HD, D2 and Ar, respectively. The signal at m/z 28 is associated with N2 and/or CO, whereas the signal at m/z 16 is expected to be due to methane (CH4).

Table 7 Composition and total amount of gases released from normal and moist SLM specimens. The values in brackets are below the quantitative detection limit, and N.D. means below the detection limit.
For the normal SLM specimen in as-built state, signals at m/z 2, m/z 28 and m/z 40 were detected, although the total intensity was quite small. This suggests that H2, N2 and CO from the powder and the Ar from the atmosphere in the SLM chamber were entrapped in the pores. After the heat treatment at 803 K, the total amount of gases increased to 2.0 µL and the intensity of the signal at m/z 2 increased, whereas the intensity of the m/z 28 and m/z 40 signals decreased. This means that the atomic hydrogen in the α-Al phase diffused to the pores and formed gaseous hydrogen, leading to expansion of the pores. For the moist SLM specimen in as-built state, more than 20 vol% of the m/z 3 species was detected. After the heat treatment at 803 K, the total amount of gases increased to 3.3 µL and the concentration of hydrogen (m/z 2, m/z 3 and m/z 4) also increased, whereas the concentration of the m/z 28 and m/z 40 species decreased. Therefore, the use of the moist powder caused an increase in the amount of hydrogen in the SLM specimens, which resulted in a high linear dimensional change due to the porosity expansion.
It is not clear why the m/z 28 species was undetected for both the normal and moist SLM specimens after heat treatment at 803 K. Possible reasons may be that N2 was consumed by the nitridization of aluminum or magnesium, and CO reacted with H2 to form CH4 along with the oxidation of aluminum or magnesium.
4. Discussion
4.1 Hydrogen source in SLM specimens
The amount of hydrogen in the normal and moist SLM specimens in as-built state exceeded 3 and 5 cm3/100 g-Al according to Ransley’s method, which was much higher than that for the GC specimens. The source of such large amounts of hydrogen is considered to be the moisture on the powder surface. Thus, the amount of hydrogen desorbed from the powder and the SLM specimens was compared. As shown in Table 4, the amount of hydrogen desorbed from the normal powder measured by the inert gas fusion heat transfer method was about 37 cm3/100 g-Al. This is 12 times higher than that desorbed from the normal SLM specimen. However, the amount of hydrogen detected is often affected by the measurement method. In this study, therefore, the amount of hydrogen in the GC specimens was measured by two methods. The results showed that the amount of hydrogen measured by the inert gas fusion heat transfer method was 1.12 cm3/100 g-Al, which is about 6 times higher than that measured by Ransley’s method (0.18 cm3/100 g-Al). This means that the normal powder gave off higher amounts of hydrogen than the SLM specimens.
4.2 Porosity expansion due to hydrogen in SLM specimens
The SLM specimens at as-built state contained hydrogen more than 3 cm3/100 g-Al. Such large amounts of hydrogen were also detected after the heat treatment at 803 K (Table 6). The gas analysis performed by the drilling method revealed that the amount of hydrogen in the pores increased during the heat treatment at 803 K (Table 7). This implied that the atomic hydrogen in the α-Al phase diffused to the pores during the heat treatment and formed gaseous hydrogen. Also, high linear dimensional changes were induced by the heat treatment at 803 K (Fig. 7). Thus, it seemed that the porosity expansion occurred during the heat treatment due to the high amount of hydrogen.
The volume fraction of pores was evaluated using the image analyses conducted for 10 views of microstructures captured by the optical microscope (Fig. 6). An image analyzer ImageJ software was used to measure the area fraction of pores in the microstructures and the area fraction was considered as the volume fraction. The volume fraction of pores in the normal SLM specimens was 0.45 ± 0.25 vol%.
The hydrogen content at 803 K in the SLM specimens was evaluated based on Charles’s law, i.e. V/T = const., where V is volume and T is temperature [K]. Since the hydrogen content in the normal SLM specimen is about 3 cm3/100 g-Al at 298 K under 0.1 MPa pressure, the hydrogen content at 803 K under 0.1 MPa is approximately 8 cm3/100 g-Al. The volume of AlSi10Mg alloy at 803 K is about 39 cm3/100 g, when its density at 298 K is 2666 kg/m3 and the thermal expansion coefficient is 2.1 × 10⁻⁵ K−1. Thus, the volume fraction of hydrogen in the normal SLM specimen at 803 K would have become about 20 vol%, if it could expand freely, which was from 28 to 100 times higher than the volume fraction of pores. The hydrogen pressure in the pores was therefore from 2.8 to 10 MPa. This value is high enough for the porosity to expand as the 0.2% proof stress of the alloy is only several MPa at 803 K. In contrast, the hydrogen pressure in the pores at 473 K is from 1.8 to 6.3 MPa. This means that the porosity expansion hardly occurs during the heat treatment at 473 K because the 0.2% proof stress of the alloy is as high as up to 158 MPa at this temperature.29)
4.3 Concentration of solute Si in SLM specimens in as-built state
In the SLM process, the high cooling rate of the melt pool commonly results in not only entrapment of a large amount of hydrogen but also high concentrations of solute Si in the α-Al phase. Thus, the concentration of solute Si in the normal and moist powder SLM specimens was estimated.
In our previous study,10) a model was proposed to evaluate the linear dimensional change associated with precipitation of Si phase for Al–Si–Mg ternary alloys. In the model, the linear dimensional change was calculated from the volume change of present phases, i.e. α-Al, diamond structure Si and β-Mg2Si. The volume of each phase is calculated with the phase fraction (wt% or at%) in the alloy and the lattice constant of each phase. The phase fraction of each phase is calculated by lever rule for three phases considering the concentrations of Si and Mg in the α-Al phase. The lattice constants were described in Ref. 10). In calculating the lattice volume of the α-Al phase, the variation of lattice constant depending on concentration of solute Si and Mg is also taken into account in the concentration ranges less than 16 at% Si and 1.42 at% Mg.10) The validity of the model for AlSi10Mg alloy GC and SLM specimens was confirmed by comparing the calculated and experimentally measured linear dimensional changes arising from heat treatment and also by direct measurement of the concentration of Si in the α-Al phase using electron probe microanalysis (EPMA) and scanning transmission electron microscopy combined with energy-dispersive X-ray spectroscopy (STEM-EDS).10,11)
The average concentration of solute Si in the SLM specimens at as-built state were estimated using this model inversely. In the inverse calculation, the composition of AlSi10Mg alloy is supposed to be Al–9.8Si–0.3Mg. The concentration of Si in the α-Al phase at as-built state, CSi [wt%] was the fitting parameter. Mg is assumed to be solute in the α-Al phase since the Mg containing compounds observed in AlSi10Mg alloy SLM specimens were a few except small amount of π-Al18Si6Mg3Fe phase.30–32) According to the lever rule for α-Al, Si and β-Mg2Si phases, the concentration of Mg in the α-Al phase at as-built state that corresponds with absence of the β-Mg2Si was approximately 0.33 wt%. After the heat treatment, the alloy is supposed to reach the equilibrium state and the concentrations of Si and Mg in the α-Al phase were evaluated with the thermodynamic calculation software Thermo-calc with TCAL4 database. The phase fractions of the equilibrium phases are calculated with the lever rule. The theoretical values of ΔLSi are shown in Fig. 9 under the assumption that CSi was 2.00, 2.25, or 2.50%. As reported previously,10,11) the theoretical values decrease with increasing heat treatment temperature since the solubility of Si in the α-Al phase increases. Also, the theoretical values increase with increasing CSi. It is noteworthy that experimental values for the normal and moist powder SLM specimens heat-treated at 473 K for 360 ks were 0.218 and 0.220%, respectively, and were induced by the precipitation of Si since the amount of hydrogen in the SLM specimens was not enough for the porosity expansion as mentioned in section 4.2. Thus, these experimental values are also plotted in Fig. 9. The theoretical values calculated for CSi = 2.25% agree well with the experimental values. This means that the average concentration of solute Si in the α-Al phase for both the normal and moist powder SLM specimens in as-built state is at most 2.25%, which corresponds well with reported values.11–16)

It is also important to note that the average concentrations of solute Si in the α-Al phase of the normal and moist SLM specimens in as-built state were almost the same. This indicates that the average concentration of solute Si in the α-Al phase in as-built state mainly depends on the laser parameters and the laser scanning strategy, which affect the solidification rate of the melt pool, and the repetition of re-melting and/or re-heating caused by subsequent laser scanning, rather than the moisture levels of the powder.
4.4 Estimation of linear dimensional change at 803 K
The linear dimensional change for the SLM specimens heat-treated at 803 K for 18 ks was between 0.8 and 1.2%, as shown in Fig. 7. This is due to the simultaneous effects of the precipitation of Si phase (ΔLSi) [%] and the porosity expansion, (ΔLP) [%]. These values were quantitatively estimated.
In Fig. 8, the theoretical value of ΔLSi for the AlSi10Mg alloy with CSi = 2.25% is 0.116% when the heat treatment temperature is 803 K. In the case of the normal SLM rod specimen heat-treated at 803 K for 18 ks, the linear dimensional change is 0.867%. Therefore, the estimated value of ΔLP for this specimen is 0.751%. Clearly, ΔLP is much higher than ΔLSi.
5. Conclusion
In summary, SLM specimens containing different amounts of hydrogen were fabricated using normal and moist AlSi10Mg alloy powders, and the dimensional changes during heat treatments at 473 and 803 K were investigated.
SLM products, especially those made of moist powders, contain much more hydrogen than gravity castings.
The linear dimensional change during heat treatment at 473 K is mainly caused by the precipitation of Si phase and are thus independent of the hydrogen content of the SLM products. However, the linear dimensional change arising from heat treatment at 803 K is mainly attributed to the porosity expansion and thus depends on the hydrogen content in the SLM specimens.
REFERENCES
- 1) N.T. Aboulkhair, M. Simonelli, L. Parry, I. Ashcroft and C. Tuck: Prog. Mater. Sci. 106 (2019) 100578. doi:10.1016/j.pmatsci.2019.100578
- 2) T. Debroy, H.L. Wei, J.S. Zuback, T. Mukherjee, J.W. Elmer, J.O. Milewski, A.M. Beese, A. Wilson-heid, A. De and W. Zhang: Prog. Mater. Sci. 92 (2018) 112–224. doi:10.1016/j.pmatsci.2017.10.001
- 3) W.E. Frazier: J. Mater. Eng. Perform. 23 (2014) 1917–1928. doi:10.1007/s11665-014-0958-z
- 4) L.W. Kempf and H.L. Hopkins: Trans. AIME 122 (1936) 266–281.
- 5) K.R. Van Horn: Aluminum, vol. 1., (American Society for Metals, Metals Park, OH, 1967) pp. 157–161.
- 6) H.Y. Hunsicker: Metall. Trans. A 11 (1980) 759–773. doi:10.1007/BF02661205
- 7) J.M. Boileau, C.A. Cloutier, L.A. Godlewski, P.A. Reeber-Symanksi, C. Wolverton and J.E. Allison: technical paper#2003-01-0822, (SAE International, 2003).
- 8) J. Yaokawa, Y. Yagi, Y. Sugiyama, S. Dong and Y. Iwata: Mater. Trans. 60 (2019) 1651–1658. doi:10.2320/matertrans.F-M2019823
- 9) S. Dong, Y. Iwata, J. Yaokawa, K. Hibi and K. Oh-ishi: Mater. Trans. 60 (2019) 1989–1995. doi:10.2320/matertrans.F-M2019830
- 10) J. Yaokawa, K. Oh-ishi and S. Dong: Mater. Trans. 62 (2021) 1023–1029. doi:10.2320/matertrans.MT-M2021058
- 11) J. Yaokawa, K. Oh-ishi, S. Dong, M. Hara, T. Masutani and H. Sato: Mater. Charact. 182 (2021) 111533. doi:10.1016/j.matchar.2021.111533
- 12) M. Fousová, D. Dvorský, A. Michalcová and D. Vojtěch: Mater. Charact. 137 (2018) 119–126. doi:10.1016/j.matchar.2018.01.028
- 13) T. Maeshima and K. Oh-ishi: Heliyon 5 (2019) e01186. doi:10.1016/j.heliyon.2019.e01186
- 14) P. Van Cauwenbergh, V. Samaee, L. Thijs, J. Nejezchlebová, P. Sedlák, A. Iveković, D. Schryvers, B. Van Hooreweder and K. Vanmeensel: Sci. Rep. 11 (2021) 6423. doi:10.1038/s41598-021-85047-2
- 15) N. Takata, M. Liu, H. Kodaira, A. Suzuki and M. Kobashi: Addit. Manuf. 33 (2020) 101152. doi:10.1016/j.addma.2020.101152
- 16) N. Takata, M. Liu, H. Li, A. Suzuki and M. Kobashi: Mater. Des. 219 (2022) 110830. doi:10.1016/j.matdes.2022.110830
- 17) N. Takata, H. Kodaira, K. Sekizawa, A. Suzuki and M. Kobashi: Mater. Sci. Eng. A 704 (2017) 218–228. doi:10.1016/j.msea.2017.08.029
- 18) M. Tang, P.C. Pistorius, S. Narra and J.L. Beuth: JOM 68 (2016) 960–966. doi:10.1007/s11837-015-1763-3
- 19) T. Kimura and T. Nakamoto: J. Jpn. Soc. Powder Powder Metall. 61 (2014) 531–537. doi:10.2497/jjspm.61.531
- 20) C. Weingarten, D. Buchbinder, N. Pirch, W. Meiners, K. Wissenbach and R. Poprawe: J. Mater. Process. Technol. 221 (2015) 112–120. doi:10.1016/j.jmatprotec.2015.02.013
- 21) L. Girelli, M. Tocci, M. Gelfi and A. Pola: Mater. Sci. Eng. A 739 (2019) 317–328. doi:10.1016/j.msea.2018.10.026
- 22) X.P. Li, K.M. O’Donnell and T.B. Sercombe: Addit. Manuf. 10 (2016) 10–14. doi:10.1016/j.addma.2016.01.003
- 23) C.E. Ransley and D.E.J. Talbot: J. Inst. Met. 84 (1955) 445–452.
- 24) Jpn. Soc. Mech. Eng.: Data Book: Heat Transfer, 4th Ed., (1986).
- 25) D.M. Bauer, E. Schwarzenböck, I. Ludwig, N. Schupp, F. Palm and G. Witt: Powder Metall. 60 (2017) 175–183. doi:10.1080/00325899.2017.1288841
- 26) N. Phambu: Mater. Lett. 57 (2003) 2907–2913. doi:10.1016/S0167-577X(02)01395-2
- 27) H. Toda, T. Hidaka, M. Kobayashi, K. Uesugi, A. Takeuchi and K. Horikawa: Acta Mater. 57 (2009) 2277–2290. doi:10.1016/j.actamat.2009.01.026
- 28) P.N. Anyalebechi: Mater. Sci. Appl. 13 (2022) 158–212. doi:10.4236/msa.2022.134011
- 29) N.E. Uzan, R. Shneck, O. Yeheskel and N. Frage: Addit. Manuf. 24 (2018) 257–263. doi:10.1016/j.addma.2018.09.033
- 30) Q. Yan, B. Song and Y. Shi: J. Mater. Sci. Technol. 41 (2020) 199–208. doi:10.1016/j.jmst.2019.08.049
- 31) A. Hadadzadeh, B.S. Amirkhiz and M. Mohammadi: Mater. Sci. Eng. A 739 (2019) 295–300. doi:10.1016/j.msea.2018.10.055
- 32) A. Hadadzadeh, B.S. Amirkhiz, J. Li, A. Odeshi and M. Mohammadi: Mater. Sci. Eng. A 722 (2018) 263–268. doi:10.1016/j.msea.2018.03.014
