Abstract
Flux leakage in the rotor core bridges is a problem specific to interior permanent magnet motors and has been unsolved till date. It is widely known that if the bridges are partially non-magnetically improved with low magnetic polarization, the leakage flux will be smaller, and the rotor will have a higher magnetic flux. We proposed that the portion of the silicon steel sheets that becomes the bridge after pressing can be non-magnetized and laminated to fabricate the rotor core. Partially non-magnetic material with a polarization of almost zero was obtained by melting and mixing Ni–Cr alloy powder with the silicon steel sheets. This non-magnetic improvement treatment was applied to the bridge in the rotor core sheet, in which the non-magnetic area width was 1.45 mm, and the prototype rotor core was fabricated by laminating 60 rotor core sheets. Upon measurement, the rotor core showed approximately 35% higher magnetic flux than a conventional one, with the actual value nearly identical to that obtained from the magnetic field analysis.

1. Introduction
For realizing carbon neutrality, internal combustion engine vehicles are being rapidly replaced by electric vehicles. As a result, the number of motors used in electric vehicles is increasing. Consequently, there may be a supply shortage of materials used in interior permanent magnet (IPM) motors. Such materials include rare-earth magnets, silicon steels, and copper wires. In order to save materials, it is necessary to reduce the size of the motor using high-speed rotation and a rotor core with high magnetic flux. Bonded magnets with high electrical resistance effectively suppress magnetic heat generation for high-speed rotation. Therefore, a rotor core design with low iron loss and high magnetic flux is preferred when using a bonded magnet. In this study, we focused on developing a rotor core with a high magnetic flux.
Conventional rotor cores with high magnetic flux have been achieved by three approaches: multi-layering of magnets, increasing the magnetic polarization, and arrangement of flux barriers.1) Leakage flux in the bridges of the rotor core is a problem specific to IPM motors and has remained unresolved. It is widely known that if the bridges are partially non-magnetized, the leakage flux will be smaller, and the rotor will have a higher magnetic flux.2)
Several studies have been reported on the partial non-magnetization of magnetic materials. In one such process, metastable austenitic stainless steel was heat-treated in the austenite phase region, and then stainless steel was ferro-magnetized through strong deformation via strain-induced martensitic transformation. Subsequently, it was partially non-magnetized by local heat treatment in the austenite phase region to make it suitable for achieving high performance in actuators and small solenoid valve sleeves.3,4) Fe–Cr–C alloys were partially non-magnetized by laser heat treatment in the austenite phase region and used in magnetic screw rods, SPM motor retainer rings, IPM motor rotor cores, and reluctance motor rotor cores.2,5–8) In the case of silicon steels, the bridges of the rotor were work-hardened to obtain low magnetic permeability.9) However, the magnetic polarization of the bridges was not reduced. A previous research focused on the partial non-magnetization method in which a slit was processed in silicon steel with a laser, and a Cu or Cu–Si alloy wire was melted into the slit.10) Another research reported that Fe-based soft magnetic material and Ni–Cr alloy wire were melted by laser heating and non-magnetized by mixing to control a magnetic circuit;11) a process that has been put to practical use in magnetic dentures.
As a preliminary experiment, we attempted to melt and mix the bridges of the rotor core with Ni–Cr alloy wire from the side of the rotor core via laser heat treatment to non-magnetize them, as shown in Fig. 1. However, the rotor core could not be in practical application because of welding defects, as the rotor core could not withstand the rotational force and coupling of the laminated bridges, thus increasing the Eddy current losses.
Therefore, we non-magnetized the bridge portion of the silicon steel sheets in advance and then laminated them to obtain a high-flux fabricated rotor core. Specifically, a laser process was performed to melt and mix the Ni–Cr alloy powder and the silicon steel sheet for the parts assigned to become bridges. Following a pressing process, the prototype rotor core was fabricated and evaluated for its magnetic properties and microstructures.
2. Experimental Procedure
2.1 Laser process
Samples were prepared by the process shown in Fig. 2. The laser process consists of 3 steps: 1) a powder-scraping step, 2) a melting and mixing (melt-mixing) step, and 3) a residual powder removal step. In the powder-scraping step, the alloy powder was placed on a silicon steel sheet (50HXT780T, Nippon Steel Corporation, Tokyo, Japan) with a thickness that ranged from 0.2 to 1.0 mm. The chemical composition of the powder was Ni–50 mass%Cr (Nippon Welding Rod Co., Ltd., Tokyo, Japan), with an average particle diameter of 35.5 µm. In the melt-mixing step, the powder and the silicon steel sheet were melt-mixed with a laser at a set value of 1–3 mm × 10 mm in shape. A single-type fiber laser was used with an output of 2 kW and a laser diameter of 36 µm. The laser had an output of 300–700 W, and a scan speed of 20–100 mm·s−1. The scanning pattern is shown in Fig. 3. Following the above process, the residual powder was removed in order to obtain the samples.
2.2 Pressing process
The pressing process consists of three steps: 1) a defect removal step, 2) a flattening step, and 3) a punching step, as shown in Fig. 2. In the defect removal step, defects such as cracks and shrinkage cavities were punched out by a press in order to leave a homogeneous area that would become the bridge. Next, the flattening process was performed to achieve a thickness less than that of the 0.5 mm silicon steel sheet. Finally, punching was performed in order to leave an improved area with a width of 0.5 mm. An 80-ton press was used with special molds for all steps.
2.3 Evaluation
The appearance was observed from the top and back sides using a stereoscopic microscope and an optical microscope. Cross-sectional observation and chemical composition were measured using scanning electron microscopy (SEM) with energy dispersive spectrometry (EDS). The phase and crystal structure analysis were measure using electron backscatter diffraction (EBSD) and X-ray diffraction (XRD). The magnetic polarization was measured by vibration sample magnetometry (VSM) in a magnetic field of 1.6 MA·m−1. Two-dimensional static magnetic field analysis was performed using the finite element method (using JMAG software), and the model was a 1/8 division antiperiodic model in the circumferential direction. In the magnetic field analysis silicon steel sheet and the improvement portion were used magnetic polarization of 2.0 T and 0 T and permeability of 4607 and 1, respectively. Magnetic polarization of magnet (S5P13MF, Aichi Steel Corporation) were used 0.724 T.
3. Results
3.1 Laser process
When applying partial non-magnetic improvement treatment to the bridges, it is necessary to melt and mix the powder and silicon steel sheet up to the underside of the sheet. The effect of different laser conditions on the appearance of a sample with a size of 1 mm × 10 mm is shown in Fig. 4. The holes are formed when the laser output is high, or the scanning speed is slow, and the back side of the sheet is insufficiently melted and mixed when the laser output is low, or the scanning speed is high. At an output condition of 500 W and a speed of 50 mm·s−1, there was no hole, and the melting and mixing were achieved through to the back side. Figure 5 shows the SEM and EDS images of the cross-section with the abovementioned output condition. Cr is homogeneously distributed from the top side to the back side, implying that the Ni–Cr alloy powder in the partially melted area was sufficiently melted and mixed with silicon steel.


The samples were laser-processed with conditions of 500 kW, 100 mm·s−1, and a 3 mm × 10 mm shape at various Ni–Cr alloy powder thickness. The chemical compositions of the samples were analyzed by EDS, as summarized in Table 1. Ni and Cr increase with increasing Ni–Cr powder thickness, which implies that the powder thickness can control the chemical composition of the partially melted area. The overall view of sample C is shown in Fig. 6. The width at the end point of laser processing is larger than at the starting point, possibly due to heat storage at the end. The back side has a smaller shape than the top side, which agrees with Fig. 5. On the end point side, cracks and shrinkage cavities were observed due to solidification shrinkage. The bridges of the rotor core can be formed in an area without cracks and shrinkage cavities. The cross-sectional microstructures of sample C are shown in Fig. 7. Sample C shows a fine cell-like structure of approximately 5 µm, where Si is concentrated between the cells, as seen in the EDS image. Figure 8 shows the image quality map and the phase map of sample A, B, C and F by EBSD. The constituent phase in the non-magnetic improvement samples changed from ferrite to austenite at Ni and Cr contents above 30.9%. This result agrees with the appearance of the austenite phase when the NiCr quantity exceeds about 29% in the Schaeffler diagram.12–14)

Table 1 Composition of each sample.

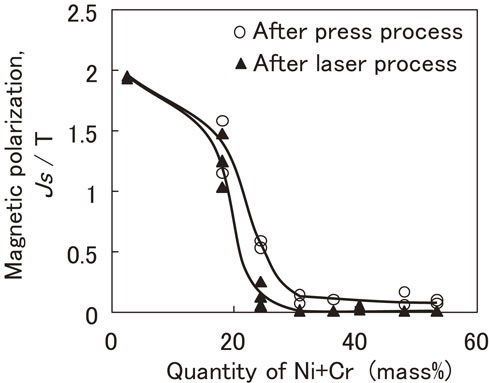
The magnetic polarization of a 2 mm × 2 mm cut without cracks and shrinkage cavities from the non-magnetic improvement samples were measured. The effect of Ni and Cr contents on magnetic polarization after the laser process is shown in a closed triangle in Fig. 8. Notably, the Ni and Cr contents of 2.5% indicate the magnetic polarization of the silicon steel sheet. The mass density of 7.84 mg·m−3, measured by the Archimedes method using an arc melting sample of sample C composition, was used in all samples, and the mass density of silicon steel used 7.60 mg·m−3. The magnetic polarization is almost zero when the Ni and Cr contents exceed 30.9 mass%, as seen in Fig. 9. The reason that a magnetic polarization suddenly decreases at NiCr quantity of 20% is that the constituent phase in the non-magnetic improvement samples changed from ferrite to austenite, and this change agrees to the result of Fig. 8.
3.2 Press process
Samples were press-processed with a width of 1.0 mm, as shown in Fig. 2. Figure 10 shows the appearance of sample C in each process, and Fig. 11 shows the SEM and EDX images from the top view after the punching step in the pressing process. There are no defects in the sample at the defect removal step in Fig. 10. In the flattening step, sample C was pressed so that the thickness was less than that of the silicon steel sheet (0.5 mm), which resulted in a thickness of 0.44 mm. Additionally, the sample underwent deformation and spread over a defect removal zone. In the punching step, the sample and the silicon steel sheet were punched simultaneously. This suggests that the sample and the silicon steel sheet were fully binded.

After press processing, only the parts of magnetic improvement in the samples were cut out, with a size of about 0.5 mm × 0.44 mm × 3 mm. The magnetic polarizations were measured and compared with that of the samples after laser-processing, as shown in Fig. 9. The crystal structure of the sample C after pressing is analyzed by XRD, as shown in Fig. 12. A small amount of the a-Fe structure, that is the ferrite phase, was observed although the sample C before press-processing has only the austenite phase as shown in Fig. 8. The formation of the ferrite phase was caused by strain-induced martensite,15–19) therefore magnetic polarization is higher after press-processing than after laser-processing.
3.3 Prototype of rotor core
Based on the above results, core sheet samples were produced by laser-processing at an output condition of 300–350 W, a speed of 40 mm·s−1, and a powder thickness of 0.4 mm such that the composition was the same as that of sample C. Figure 13 shows SEM and EDS images of the bridge in the core sheet. The section melted and mixed with Ni–Cr alloy powder, is located in the center of the bridges and had a width of 1.45 mm. A rotor core was fabricated by stacking 60 core sheets, and magnets were inserted. The inserted magnet was an injection molded Nd–Fe–B bonded magnet with high coercivity, prepared by the d-hydrogenation-disproportionation-desorption-recombination (d-HDDR)20–27) and grain boundary diffusion processes.28–31) The effect of the non-magnetic improvement width in the bridge on the flux of the rotor was measured. The result is shown in Fig. 14, compared with a conventional rotor and the results of magnetic field analysis. By applying partial non-magnetic improvement in the bridges, the magnetic flux increased by approximately 35.3%, nearly identical to the value from magnetic field analysis.

4. Discussion
It is preferable to reduce Ni content since Ni is the more expensive element. If cracks can be reduced, the partial non-magnetic improvement treatment area can also be reduced. As a result, the amount of Ni–Cr alloy powder used per bridge can be reduced, and the amount of Ni for the non-magnetic improvement treatment can be reduced. Therefore, crack suppression is an issue. In the following paragraphs, the formation of cracks in the present process is discussed in detail.
The relation between microstructures and cracks of TIG-welded austenitic stainless steel was investigated by Senda et al.32) Large cracks were observed when the microstructure showed relatively thick primary dendrite arms and insufficiently grown secondary arms. On the other hand, small cracks were observed when the microstructure showed thin primary dendrite arms and fine, complex secondary arms.
The microstructure shown in Fig. 7 is similar to that observed in the large cracks reported by Senda et al.32) A cross-section microstructure of sample C, including cracks, is shown in Fig. 15. A typical solidification crack is shown along the primary crystal in the mushy zone. Homma et al.33) reported that the liquid phase can be fed into initial cracks immediately and that cracks can be healed during the start of the solidification stage. However, in the final stage, the liquid feeding is insufficient, and cracks occur at the liquid film interface. Sample C has a small eutectic region; therefore, the formation mechanism of cracks in the present process is similar to that reported by Homma et al.33) As mentioned above, in order to reduce cracks, it may be necessary for the microstructure of partial non-magnetic improvement to be complex and in sync with the increment of the eutectic region as suggested by Senda et al.32)
5. Conclusion
We proposed a laser process to melt and mix Ni–Cr alloy powder and silicon steel in the bridge and a press process that punches out the welding defects. The parameters of each process were optimized, and the microstructure was observed. Furthermore, a prototype rotor core was fabricated, and its magnetic properties were evaluated, thus obtaining the following conclusions:
-
(1)
In the laser process, the optimum process conditions were that the sample did not have holes and that even the back side of it needed to be melted and mixed. When the Ni and Cr contents exceeded 30.9 mass%, the magnetic polarization was almost zero, and the single austenitic phase was obtained. This chemical composition result is consistent with the Schaeffler diagram.
-
(2)
In the pressing process, it was confirmed that pressing was possible, and the partial non-magnetic improvement part was fully bonded to the silicon steel. Compared to the sample before press working, the non-magnetic improvement part showed a slight increment of magnetic polarization due to strain-induced martensite.
-
(3)
Based on the obtained results, a prototype rotor core with partial magnetic improvement in the bridges was fabricated. As a result, the magnetic flux of the rotor core increased by approximately 35.3% compared to the conventional rotor core, in corroboration with the magnetic field analysis results.
Acknowledgments
This research was a result of commissioned work (JPNP20001891-0) and supported by the Green Innovation Fund subsidy project (JPNP22100313-0) of the New Energy and Industrial Technology Development Organization (NEDO), a national research and development agency.
REFERENCES
- 1) I. Takahashi: Motor Fan 139 (2018) 40–45 (in Japanese).
- 2) M. Mita, M. Masuzawa, N. Hirao and F. Kimura: J. Appl. Phys. 93 (2003) 8769–8771. doi:10.1063/1.1556983
- 3) T. Tsukamoto, M. Asakawa, C. Sudoo, M. Kouso and M. Nakasato: Materia Japan 33 (1994) 435–437 (in Japanese). doi:10.2320/materia.33.435
- 4) K. Takeuchi, S. Sugiura, Y. Katayama, T. Inui and J. Sunakawa: Materia Japan 36 (1997) 358–360 (in Japanese). doi:10.2320/materia.36.358
- 5) S. Yokoyama and T. Inui: Tetsu-to-Hagané 88 (2002) 222–228 (in Japanese). doi:10.2355/tetsutohagane1955.88.4_222
- 6) M. Mita, N. Hirao and F. Kimura: J. Appl. Phys. 91 (2002) 6997–6999. doi:10.1063/1.1452195
- 7) M. Mita, N. Hirao and F. Kimura: J. Magn. Magn. Mater. 254–255 (2003) 272–274. doi:10.1016/S0304-8853(02)00771-0
- 8) S. Yokoyama and H. Sasaki: Hitachi-Gihou 19 (2003) 57–60.
- 9) M. Shimada, S. Ohwada, T. Katoh, M. Kanou and H. Ono: Japanese Patent Applications, JP2005-130604 (2005).
- 10) K. Tanaka, Y. Hoshino and Y. Kawamura: J. Jpn. Laser Proc. 29 (2022) 98–102.
- 11) Y. Honkura, I. Arai and A. Watarai: Japanese Patent, JP3416932 (2003).
- 12) M.A. Pugacz: Weld. J. 23 (1944) 536s–544s.
- 13) C.B. Voldrich: Weld. J. 24 (1947) 153s–169s.
- 14) S. Ando: J. Jpn. Welding Soc. 21 (1952) 247–254 (in Japanese). doi:10.2207/qjjws1943.21.247
- 15) P.L. Mangonon and G. Thomas: Metall. Trans. 1 (1970) 1577–1586. doi:10.1007/BF02642003
- 16) T. Maki, S. Shimooka, M. Umemoto and I. Tamura: Trans. JIM 13 (1972) 400–407. doi:10.2320/matertrans1960.13.400
- 17) S.S. Hecker, M.G. Stout, K.P. Staudhammer and J.L. Smith: Metall. Trans. A 13 (1982) 619–626. doi:10.1007/BF02644427
- 18) M. Chen, D. Terada, A. Shibata and N. Tsuji: Mater. Trans. 54 (2013) 308–313. doi:10.2320/matertrans.MBW201212
- 19) H. Qiu, L. Wang, C. Wang, T. Nakamura and T. Inoue: Mater. Trans. 59 (2018) 380–385. doi:10.2320/matertrans.M2017285
- 20) T. Takeshita and R. Nakayama: Proc. 11th Int. Workshop Rare-Earth Magnets and Their Applications, (1991) pp. 49–71.
- 21) S. Sugimoto, H. Nakamura, K. Kato, D. Book, T. Kagotani, M. Okada and M. Homma: J. Alloy. Compd. 293–295 (1999) 862–867. doi:10.1016/S0925-8388(99)00376-X
- 22) S. Sugimoto, S. Ohga, K. Inomata, M. Okada, K. Suzuki, T. Konno and K. Hiraga: Proc. 17th Int. Workshop Rare-Earth Magnets and Their Applications, (2002) pp. 636–643.
- 23) C. Mishima, N. Hamada, H. Mitarai and Y. Honkura: IEEE Trans. Magn. 37 (2001) 2467–2470. doi:10.1109/20.951205
- 24) T. Horikawa, M. Yamazaki, M. Matsuura and S. Sugimoto: Sci. Technol. Adv. Mater. 22 (2021) 729–747. doi:10.1080/14686996.2021.1944780
- 25) T. Horikawa, M. Matsuura, S. Sugimoto, M. Yamazaki and C. Mishima: AIP Adv. 6 (2016) 056017. doi:10.1063/1.4944073
- 26) M. Yamazaki, T. Horikawa, C. Mishima, M. Matsuura, N. Tezuka and S. Sugimoto: AIP Adv. 7 (2017) 056220. doi:10.1063/1.4975697
- 27) T. Horikawa, M. Yamazaki, C. Mishima, M. Matsuura and S. Sugimoto: AIP Adv. 9 (2019) 035244. doi:10.1063/1.5079953
- 28) N. Hamada, C. Mishima, H. Mitarai and Y. Honkura: Proc. 16th Int. Workshop on Rare-Earth Magnets and Their Applications, (2000) pp. 818–819.
- 29) N. Hamada, C. Mishima, H. Mitarai and Y. Honkura: IEEE Trans. Magn. 39 (2003) 2953–2955. doi:10.1109/TMAG.2003.815757
- 30) N. Hamada, K. Noguchi, C. Mishima and Y. Honkura: IEEE Trans. Magn. 41 (2005) 3847–3849. doi:10.1109/TMAG.2005.854870
- 31) A. Iijima, M. Matsuura, N. Tezuka, S. Sugimoto, Y. Une, H. Kubo and M. Sagawa: Mater. Trans. 58 (2017) 825–828. doi:10.2320/matertrans.M2016448
- 32) T. Senda, F Matsuda, G. Takano, K. Watanabe, T. Kobayashi and T. Matsuzaka: J. Jpn. Welding Soc. 41 (1972) 709–723 (in Japanese). doi:10.2207/qjjws1943.41.709
- 33) H. Homma: J. Jpn. Welding Soc. 57 (1988) 496–501 (in Japanese). doi:10.2207/qjjws1943.57.496