Abstract
Dilute Mg–Zn–Y alloy with a mille-feuille structure (MFS) exhibits a mechanical strength comparable to Mg–Zn–Y alloy with long period stacking/ordered (LPSO) structure through kink deformation. In order to deepen understanding the thermal stability of the MFS-type Mg alloys, it is required to clarify the solute cluster structures composed of Zn and Y in solute enriched stacking faults (SESFs). In this study, electron energy-loss and energy dispersive X-ray spectroscopy based on scanning transmission electron microscopy (STEM-EELS/EDS) were conducted to investigate the electronic structure and composition of Zn and Y in the SESFs of the MFS-Mg alloy. Zn-L2,3 spectra indicated that the valence charges of Zn in the dilute Mg alloy were different from that of the LPSO-type Mg–Zn–Y alloy. In addition, the intensity ratio of L3/L2 in Y-L2,3 spectrum of the dilute MFS-Mg alloy was larger than that of the LPSO-Mg alloy, reflecting the electron occupancies of 4d3/2 and 4d5/2 orbitals of Y atoms were different from those of the LPSO-Mg alloys. STEM-EELS analysis of the SESF composition in the dilute MFS-Mg alloy indicated that the Zn/Y ratio should be lower than that of the LPSO-Mg alloy, which was confirmed also by STEM-EDS measurements. These results indicate that the cluster structure in the SESFs of the dilute MFS-Mg alloy should be different from the ideal Zn6Y8 cluster in the LPSO-type Mg–Zn–Y alloys.

1. Introduction
Ternary magnesium (Mg) alloys containing a few atomic percent of transition metal (TM) and rare earth (RE) elements exhibit yield strengths that are greater than aluminum alloys. They have been attracting attention as the next-generation lightweight structural materials.1,2) These alloys form a long-period stacking/ordered (LPSO) structure,3–13) in which layers of ABCA stacking faults in the hexagonal closed packed (hcp) structure are accumulated periodically. The solutes of TM and RE elements are concentrated in the solute enriched stacking faults (SESF), where the TM and RE atoms form an L12-type short-range order (SRO) TM6RE8 cluster. Structure analysis using scanning transmission electron microscopy (STEM) has revealed that TM and RE atoms in the cluster were significantly displaced from the positions of the L12 arrangement, which is due to structural relaxation.8) This cluster structure in the LPSO region has been observed for various ternary Mg alloys,9–15) and experimental and theoretical studies have been conducted to clarify the formation mechanism of the SRO solute clusters.16–22) The behavior of SRO development during the formation of the LPSO phase in ternary Mg alloys was investigated by synchrotron X-ray scattering analysis.19) In addition, it was confirmed that the SRO cluster existed in sparsely distributed SESFs (i.e., a mille-feuille structure; MFS) of the ternary Mg alloys containing dilute solute elements, as revealed by STEM techniques.12) Thermodynamic analysis using first-principles calculations showed that the formation process of LPSO phase and SESFs in Mg–Zn–Y alloys undergo a spinodal-like decomposition into Mg-rich solid-solution and Zn/Y-rich L12 type order phase, explaining the possible thermodynamic origin of the SRO clusters in the SESF.21) Simulation using the density functional theory also showed that various structure models of the SRO clusters in the Mg matrix were energetically stable.22) Therefore, in the various ternary Mg alloys, the SRO clustering is highly expected to occur within the SESF. Recently, a single crystal of the Mg alloy containing dilute Zn and Y elements (Mg99.2Zn0.2Y0.6) has been synthesized,23) and the SESF in the alloy is sparsely distributed in the hcp-Mg matrix as shown in Fig. 1(a). Notably, the yield stress of the dilute Mg–Zn–Y alloy was comparable with an Mg alloy with the LPSO phase. This is industrially beneficial because of the strengthening of Mg even in the presence of a small amount of RE element. The reason for the stable existence of sparsely distributed SESF in dilute MFS-Mg alloy is still under the discussion. Also, details of the solute clusters still remain unsolved.

Spectroscopic techniques are effective in investigating the chemical and electronic states of the clusters composed of TM and RE elements in SESF. The change in Zn–K absorption spectra of Mg–Zn–gadolinium (Gd) alloy during heating at 673 K has been reported, and the change in the spectral intensity distribution reflects the formation of Zn6Gd8 clusters from Zn-isolated atoms in the hcp-Mg matrix.24) Photoemission spectroscopy studies on Mg97Zn1Y2, Mg85Zn6Y9, and Mg75Zn10Y15 have shown that the energy states of Y 3d core levels of Mg97Zn1Y2 suggested the presence of the SRO cluster structures as well as Zn6Y8 clusters.25) However, the detection of signals from Zn and Y elements in a dilute MFS-Mg alloy using the macroscopic spectroscopy technique is not easy. Thus, a microscopic spectroscopy method is required to measure by focusing the SESF region and investigate the compositions and electronic structure of the clusters composed of Zn and Y atoms. The combination of STEM and electron energy-loss spectroscopy (STEM-EELS) is a powerful technique, which should provide the clue of the cluster in the SESF. At present, structural analysis of the solute cluster in the SESF of the present dilute MFS-Mg alloy is underway as independent research. The present analysis focuses on the local chemistry including electronic states of Zn and Y in the alloy; i.e., Zn- and Y-L2,3 spectra obtained from SESFs in dilute MFS-Mg alloy are analyzed. Furthermore, the Zn- and Y-L3 absorption intensities were used to evaluate the composition ratios of Zn and Y elements in SESF compared to the LPSO phase. The energy dispersive X-ray spectroscopy (EDS) with STEM was also applied to investigate the SESF composition. As will be described in the present paper, we have found that the Zn/Y ratio in the present dilute MFS-Mg alloy is significantly different from that in the nearly-stoichiometric LPSO-Mg alloys, providing an important clue on the significant differences between the cluster structures in MFS- and LPSO-Mg alloys.
2. Experiment
The nominal compositions of the Mg alloys used are Mg99.2Zn0.2Y0.6 (MFS-Mg alloy) and Mg75Zn10Y15 (LPSO-Mg alloy), respectively, which were directionally solidified in an Ar-gas atmosphere via the Bridgman technique (Nissin Giken NEV-DS2).23) Thin foils of the alloys for STEM-EELS/EDS measurements were prepared by mechanical polishing and Ar ion milling using an EM-09100S Ion Slicer (JEOL) equipped with an original liquid-N2 cryo-system26) and a precision ion polishing system II (PIPS-II, Gatan).27)
STEM images and EELS spectra were obtained using JEM-ARM200F system (JEOL), which was equipped with the followings, cold field-emission source, aberration correctors for the probe-forming and image-forming lenses, and an electron energy-loss spectrometer (Enfinium ER, Gatan).28) The convergence semi-angle of the electron probe on a specimen and detection angle for a high-angle annular dark field (HAADF) image were 19 mrad and 90–170 mrad, respectively. The convergence and collection semi-angles for the EELS measurement were 4.3 mrad and 11.7 mrad, respectively. The Zn- and Y-L2,3 spectra were acquired in dual EELS mode. The energy dispersion and energy resolution were 0.25 eV/ch and 1 eV, respectively. The electron-beam incidence direction for a specimen was along $[10\bar{1}0]$ or $[11\bar{2}0]$. The Zn- and Y-L2,3 spectra of the MFS-Mg alloy were acquired by scanning electron probe for 100 seconds in an SESF region of 1.2 nm × 18 nm as shown in Fig. 1(a). The spectra of the LPSO-Mg alloy were acquired while scanning for 100 seconds in an LPSO region of 18 nm × 18 nm (Fig. 1(b)). The EELS spectra shown in this study are the sum of spectral intensities obtained from five areas for a specimen.
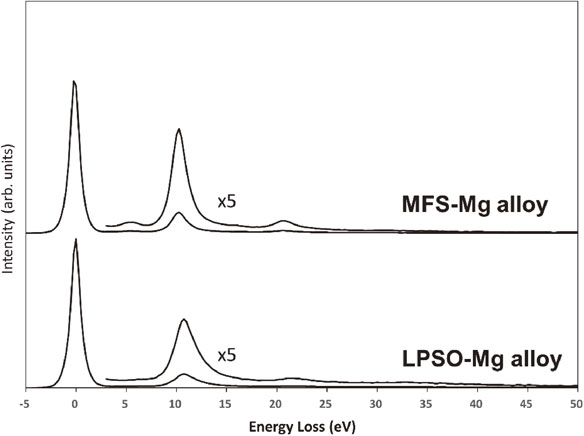
Zn- and Y-L2,3 spectra were measured from a sample thickness of less than 50 nm to suppress modulation of the spectral intensity due to plural scattering for the composition analysis. The sample thickness of 50 nm is less than half of the mean free path (MFP) of inelastically scattered electrons in the Mg alloys, where the MFPs of MFS- and LPSO-Mg alloys estimated by the Malis’ method29) are approximately 130 nm and 110 nm, respectively. The specimen thickness was evaluated by EELS log-ratio method.30) Figure 2 shows examples of the low-loss spectra obtained from the MFS- and LPSO-Mg alloys, from which the specimen thicknesses were evaluated to be 42 nm for MFS-Mg alloy and 47 nm for LPSO-Mg alloy.
Energy dispersive X-ray spectroscopy (EDS) was performed to evaluate the composition of each element in SESF using silicon drift detector (Thermo Fisher Ltd. Co.). The EDS spectra were obtained at 12 locations each from the SESF and Mg matrix regions in the dilute Mg alloy, respectively. The acquisition time for each EDS spectrum was 30 seconds.
3. Results and Discussions
The Zn- and Y-L2,3 spectra obtained from the SESF region of the MFS-Mg alloy are shown in Fig. 3(a) and (b), respectively. The spectra obtained from the LPSO-Mg alloy are also shown for comparison. According to the dipole selection rule, the Zn-L3 spectrum reflects the density of states (DOSs) for unoccupied states of 4s and 3d orbitals in Zn. On the other hand, the Y-L3 spectrum reflects the unoccupied states of 5s and 4d orbitals in Y. The Zn-L2,3 spectra of MFS- and LPSO-Mg alloys showed similar intensity distributions; however, the spectrum of the MFS-Mg alloy showed a slight shift to higher energy of approximately 0.5 eV compared with the LPSO-Mg alloy. This could be a chemical shift, indicating a lower valence charge of Zn in the MFS-Mg alloy than in the LPSO-Mg alloy.

The Y-L2,3 spectra shown in Fig. 3(b) were normalized by the L2 peak intensity. The Y-L3 and Y-L2 peaks of the MFS-Mg alloy were observed at 2080 and 2157 eV, respectively. These peak structures correspond to electron excitations of 2p3/2 → 4d and 2p1/2 → 4d, respectively. As Y 5s orbital exhibits a wider bandwidth and a smaller DOS compared with Y 4d states, the Y-L3 and -L2 peak intensities mainly reflect electron excitations to the 4d unoccupied states. For both alloys, weak peak structures at approximately 11 eV higher energy positions than L3 peaks were observed as indicated by a dotted vertical line. These structures may be due to plural inelastic scatterings of the Y-L3 absorption plus volume plasmon excitation. The L3/L2 intensity ratio of the MFS-Mg alloy was slightly larger than that of the LPSO-Mg alloy, indicating that the electronic excitation probabilities of 2p3/2 → 4d and 2p1/2 → 4d were different from those for LPSO-Mg alloy. Such different excitation probabilities should occur when the electron occupancies of the 4d5/2 and 4d3/2 orbitals of Y in the MFS-Mg alloy were different from those in the LPSO alloy.31) This difference in Y-element electronic structures between the two alloys indicates that the atomic configuration of nearest neighbors around Y atoms in the MFS-Mg alloy is different from that of the LPSO region.
The compositional ratio of Zn and Y in the SESF region of the MFS-Mg alloy was evaluated by k factor approach30) of Zn- and Y-L3 spectral intensity. The intensity of ionization edge IA for an element A (= Zn or Y) measured in EELS spectra is described as
| \begin{equation*}
I_{A}(\beta,\Delta) = N_{A}I_{\textit{Zero}}(\beta,\Delta_{\textit{Zero}}) \cdot \sigma_{A}(\beta,\Delta_{A})
\end{equation*}
|
where
NA is the number of atoms per unit area, β and Δ
A are collection semi-angle and energy range for the spectral intensity integration, respectively.
IZero(β, Δ
Zero) is the zero-loss peak intensity. σ
A(β, Δ) is partial ionization cross-section. For the evaluation of atomic ratio of two elements Zn and Y, the compositional ratio
NZn/
NY is determined as
| \begin{equation*}
\frac{N_{\textit{Zn}}}{N_{Y}} = k \cdot \frac{I_{\textit{Zn}}(\beta,\Delta_{\textit{Zn}})}{I_{Y}(\beta,\Delta_{Y})}
\end{equation*}
|
where
k = σ
Y(β, Δ
Y)/σ
Zn(β, Δ
Zn).
k factor was experimentally determined from a standard specimen. The LPSO-Mg alloy was used as a standard specimen because the composition ratio
NZn/
NY in LPSO region is clear to be 6/8 from Zn
6Y
8 cluster. The energy windows of Zn- and Y-
L3 spectra,
$\Delta_{\textit{Zn-L}_{3}}$ and
$\Delta_{\textit{Y-L}_{3}}$ were set to be 1020–1040 eV and 2075–2150 eV, respectively. The Zn- and Y-
L3 intensities of MFS- and LPSO-Mg alloys for the compositional analysis were normalized by dividing by zero-loss peak intensities and specimen thicknesses, which were evaluated from the low-loss spectra obtained simultaneously in dual EELS mode. In the experimental setup of this study,
k factor was evaluated to be approximately 0.9. From the experimental intensity ratio
$I_{\textit{Zn}}(\beta ,\Delta_{\textit{Zn-L}_{3}})/I_{Y}(\beta ,\Delta_{\textit{Y-L}_{3}})$ of the MFS-Mg alloy, the composition ratio
NZn/
NY in SESF of the dilute Mg alloy was derived to be approximately 0.5, which is lower than that of the LPSO region. Therefore, this estimation suggests that the amount of Zn in the SESF of the MFS-Mg alloy was lower than the LPSO-Mg alloy. As seen in
Fig. 3(b), the Y-
L3 peak intensity was affected by the chemical states of the Y atoms. However, the difference of the Y-
L3 intensities, which were evaluated as integral in 2075–2150 eV, was about 6% between MFS- and LPSO-Mg alloys. Such intensity difference is negligible for the present evaluation of the composition ratios between the two alloys.
The Zn/Y compositional ratio in the SESF region of the MFS-Mg alloy was also verified by EDS analysis. For the evaluation of the composition of each element, the thin-film approximation (Cliff-Lorimer method) was applied.32) The Cliff-Lorimer k factor for each element was provided by the EDS analysis system of the manufacturer. The peaks of Mg-K, Zn-L, and Y-L were fitted by Gaussian to evaluate the peak intensities. Figures 4(a) and (b) show EDS spectra obtained from SESF and Mg matrix regions of the MFS-Mg alloy as shown in Fig. 4(c). Zn-L (1012 eV) and Y-L (1922 eV) were more clearly observed in the SESF region than the Mg-matrix region. Figure 4(d) shows a plot of Zn and Y elemental compositions obtained from twelve SESF regions in atomic percent. The plots of Zn and Y compositions show variations due to differences in specimen thickness and depth of the SESF region. However, there is a linear correlation between the elemental compositions of Zn and Y. By fitting the linear function, the ratio of Zn/Y was estimated to be ∼0.5, which also indicates the deficiency of Zn atoms in the SESF compared to the LPSO-Mg alloy. The Zn/Y ratio was almost the same everywhere the EDS spectra were obtained. This fact suggests that the Zn and Y atoms do not arrange irregularly in SESF but form some kind of SRO cluster structure.

Two spectroscopic techniques led to the identical conclusion that Zn in SESF is deficient compared to the LPSO phase. In addition, a valence change of Zn and the different occupancies of 4d3/2 and 4d5/2 orbitals of Y from those in the LPSO-Mg alloy were observed, indicating that the electronic structure in SESF is different from that of the LPSO phase. Therefore, the SRO cluster structure in SESF should be different from the Zn6Y8 cluster in the LPSO phase. These findings will provide important clues for the structural analysis. To clarify the cluster structures, more detailed structural analyses using X-ray fluorescence holography33) and STEM observation are currently underway. The clarification of the SRO cluster structure in SESF is expected to reveal the formation mechanism of MFS-Mg alloys and the origin of their thermal stability, leading to further understanding of the reinforcement mechanism of Mg alloys through the kink deformation.
4. Conclusions
In this study, Zn- and Y-L3 spectra were obtained from the SESF region only of the MFS- and LPSO-Mg alloys using STEM-EELS. These spectra indicated that the valence charges of Zn atoms and electron occupancies of 4d3/2 and 4d5/2 orbitals of Y atoms should be different from those in the LPSO-Mg alloy. In addition, the composition ratio of NZn/NY of the MFS-Mg alloy was lower than that of the LPSO-Mg alloy, indicating that Zn is deficient compared with the LPSO-Mg alloy. The deficiency of the Zn element was also confirmed by EDS analysis. These experimental results suggest that the SRO clusters in the MFS-Mg alloy have a different structure from Zn6Y8 clusters. The findings in this study are expected to be useful for the detailed structural analysis studies that are currently underway.
Acknowledgments
This study was supported by JSPS KAKENHI for Scientific Research on Innovative Areas “Materials Science of a Mille-feuille Structure” (21H00089) and Tohoku University Advanced Characterization Nanotechnology Platform in MEXT Advanced Research Infrastructure for Materials and Nanotechnology in Japan (JPMXP1221TU0002, JPMXP1222TU0002). The usage of electron microscope was supported by Dr. Makoto Nagasako, Institute for Materials Research, Tohoku University.
REFERENCES
- 1) Y. Kawamura, K. Hayashi, A. Inoue and T. Masumoto: Mater. Trans. 42 (2001) 1172. doi:10.2320/matertrans.42.1172
- 2) Y. Kawamura and M. Yamasaki: Mater. Trans. 48 (2007) 2986. doi:10.2320/matertrans.MER2007142
- 3) E. Abe, Y. Kawamura, K. Hayashi and A. Inoue: Acta Mater. 50 (2002) 3845–3857. doi:10.1016/S1359-6454(02)00191-X
- 4) A. Ono, E. Abe, T. Itoi, M. Hirohashi, M. Yamasaki and Y. Kawamura: Mater. Trans. 49 (2008) 990–994. doi:10.2320/matertrans.MC200763
- 5) D. Egusa, M. Yamasaki, Y. Kawamura and E. Abe: Mater. Trans. 54 (2013) 698–702. doi:10.2320/matertrans.MI201216
- 6) D. Egusa, R. Manabe, T. Kawasaki, S. Harjo, S. Sato and E. Abe: Mater. Today Comm. 31 (2022) 103344. doi:10.1016/j.mtcomm.2022.103344
- 7) E. Abe, A. Ono, T. Itoi, M. Yamasaki and Y. Kawamura: Philos. Mag. Lett. 91 (2011) 690–696. doi:10.1080/09500839.2011.609149
- 8) D. Egusa and E. Abe: Acta Mater. 60 (2012) 166–178. doi:10.1016/j.actamat.2011.09.030
- 9) D. Egusa, M. Yamasaki, Y. Kawamura and E. Abe: Mater. Trans. 54 (2013) 698–702. doi:10.2320/matertrans.MI201216
- 10) M. Yamasaki, M. Matsushita, K. Hagihara, H. Izuno, E. Abe and Y. Kawamura: Scr. Mater. 78 (2014) 13–16. doi:10.1016/j.scriptamat.2014.01.013
- 11) K. Yamashita, T. Itoi, M. Yamasaki, Y. Kawamura and E. Abe: J. Alloy. Compd. 788 (2019) 277–282. doi:10.1016/j.jallcom.2019.02.219
- 12) D. Egusa, K. Kawaguchi and E. Abe: Frontiers Mater. 6 (2019) 266. doi:10.3389/fmats.2019.00266
- 13) D. Egusa, H. Somekawa and E. Abe: Mater. Trans. 61 (2020) 833–838. doi:10.2320/matertrans.MT-MM2019010
- 14) K. Guan, M. Egami, D. Egusa, H. Kimizuka, M. Yamasaki, Y. Kawamura and E. Abe: Scr. Mater. 207 (2022) 114282. doi:10.1016/j.scriptamat.2021.114282
- 15) K. Guan, D. Egusa and E. Abe: J. Magnesium Alloys 10 (2022) 1573–1580. doi:10.1016/j.jma.2021.11.007
- 16) T. Nishioka, Y. Yamamoto, K. Kimura, K. Hagihara, H. Izuno, N. Happo, S. Hosokawa, E. Abe, M. Suzuki, T. Matsushita and K. Hayashi: Materialia 3 (2018) 256–259. doi:10.1016/j.mtla.2018.09.002
- 17) D. Egusa, K. Inoue, Y. Nagai and E. Abe: Mater. Charact. 177 (2021) 111153. doi:10.1016/j.matchar.2021.111153
- 18) H. Okuda, M. Yamasaki, Y. Kawamura, M. Tabuchi and H. Kimizuka: Sci. Rep. 5 (2015) 14186. doi:10.1038/srep14186
- 19) H. Okuda, M. Yamasaki and Y. Kawamura: Scr. Mater. 139 (2017) 26–29. doi:10.1016/j.scriptamat.2017.06.013
- 20) M. Egami, I. Ohnuma, M. Enoki, H. Ohtani and E. Abe: Mater. Trans. 61 (2020) 839–848. doi:10.2320/matertrans.MT-MM2019009
- 21) M. Egami, I. Ohnuma, M. Enoki, H. Ohtani and E. Abe: Mater. Des. 188 (2020) 108452. doi:10.1016/j.matdes.2019.108452
- 22) M. Itakura, M. Yamaguchi, D. Egusa and E. Abe: Acta Mater. 203 (2021) 116491. doi:10.1016/j.actamat.2020.116491
- 23) K. Hagihara, R. Ueyama, M. Yamasaki, Y. Kawamura and T. Nakano: Acta Mater. 209 (2021) 116797. doi:10.1016/j.actamat.2021.116797
- 24) K. Ninomiya, K. Itamoto, H. Setoyama, D. Egusa, E. Abe, M. Yamasaki and M. Nishibori: J. Alloy. Compd. 928 (2022) 167101. doi:10.1016/j.jallcom.2022.167101
- 25) S. Hosokawa, K. Maruyama, K. Kobayashi, J. Rüdiger Stellhorn, B. Paulus, A. Koura, F. Shimojo, T. Tsumuraya, M. Yamasaki, Y. Kawamura, S. Yoshioka and H. Sato: J. Alloy. Compd. 762 (2018) 797–805. doi:10.1016/j.jallcom.2018.05.163
- 26) M. Terauchi, F. Sato, H. Sugizaki and K. Suganuma: J. Electron Microsc. 60 (2011) 25–27. doi:10.1093/jmicro/dfq069
- 27) L. Dieterle, B. Butz and E. Müller: Ultramicroscopy 111 (2011) 1636–1644. doi:10.1016/j.ultramic.2011.08.014
- 28) A. Gubbens, M. Barfels, C. Trevor, R. Twesten, P. Mooney, P. Thomas, N. Menon, B. Kraus, C. Mao and B. McGinn: Ultramicroscopy 110 (2010) 962–970. doi:10.1016/j.ultramic.2010.01.009
- 29) T. Malis, S.C. Cheng and R.F. Egerton: J. Electron Microsc. Tech. 8 (1988) 193–200. doi:10.1002/jemt.1060080206
- 30) R.F. Egeton: Electron Energy-Loss Spectroscopy in the Electron Microscope, 3rd Ed., (Springer, 2011).
- 31) D.M. Pease, S.D. Bader, M.B. Brodsky, J.I. Budnick, T.I. Morrison and N.J. Zaluzec: Phys. Lett. A 114 (1986) 491–494. doi:10.1016/0375-9601(86)90701-2
- 32) G. Cliff and G.W. Lorimer: J. Microscopy 103 (1975) 203–207. doi:10.1111/j.1365-2818.1975.tb03895.x
- 33) K. Kimura: J. Phys. Soc. Jpn. 91 (2022) 091005. doi:10.7566/JPSJ.91.091005
