Abstract
Increasing dissolved oxygen (DO) concentration of saturated Ca(OH)2 solution accelerated formation of corrosion resistant film, calcium hydroxy zincate (Ca(Zn(OH)3)2·2H2O, CHZ) on zinc and increased the density of the CHZ layer. The increase in the DO concentration enhanced the oxygen reduction reaction, which is the rate-determining step of the CHZ formation. The higher the DO concentration of the saturated Ca(OH)2 solution, the shorter the period for the improvement of corrosion resistance of zinc. This is because the accelerated formation of insulating CHZ rapidly reduced the exposed metal surface of zinc.
This Paper was Originally Published in Japanese in Zairyo-to-Kankyo 71 (2022) 21–29. The captions of all Figures and Table 1 have been slightly modified from the original paper.
1. Introduction
Zinc-based plating is often used to protect the structural steel from corrosion. There has been a lot of research on the corrosion resistant mechanism of the galvanized steels.1–5) It was reported that the corrosion resistance of zinc plating is demonstrated by the following mechanisms.
1) Protective film formation
Galvanized steels exposed to the external environment corrode due to water, dissolved oxygen, and chloride ions in the environment. Zinc plating protects the steel by covering the steel surface and preventing it from contact with the external environment. In addition, the zinc plating is also protected from the corrosion by forming an oxide film spontaneously formed on the zinc plating surface.
2) Sacrificial corrosion protection
As the zinc plating is degraded by corrosion or mechanical damage, the steel substrate is exposed to the external environment. In this case, the zinc plating and the steel substrate are short-circuited through water in the environment. Since zinc is less noble than steel, zinc plating becomes the anode, and the steel substrate becomes the cathode in the galvanized steel and suppresses the steel dissolution. Therefore, the zinc plating protects the steel substrate by corroding itself (i.e., sacrificial corrosion).
As described above, the steel substrate is protected by zinc plating while the zinc plating is degraded by corrosion. It has been reported that the steel substrate was exposed to the external environment and iron rusts formed in just 10 years of use in salt-polluted regions and heavy industrial regions where the corrosion is particularly severe.6) To improve the corrosion resistance of zinc plating, zinc alloy plating such as Zn–Al, Zn–Al–Mg, and Zn–Ni platings have been developed and commercialized.7–9) Regardless of the composition of the plating, the outer surface contacting with the external environment is a pure zinc layer formed by zinc enrichment.10) As a result, the surface of the plating layer corrodes, causing degradation of the plating layer. The surface treatment with the trivalent chromate is sometimes used to improve the corrosion resistance of the plating surface,11,12) however, this treatment has several problems. For example, pretreatment with nitric acid is required, pH control of the chromate treatment bath is necessary, and there is concern that the price of chromium which is a rare metal will rise in the future. In addition, the use and disposal of treatment solutions containing large amounts of chromium ions are necessary to plate on large steel products, and the hexavalent chromium ions are sometimes detected in the chromate film.
It is known that hydroxy calcium zincate (Ca(Zn(OH)3)2·2H2O, hereafter referred to as CHZ) forms on the zinc surface when zinc is immersed in a solution containing calcium ions and exhibits high corrosion resistance.13) An example that CHZ formation being used as a corrosion protection technique is the use of galvanized steel bars in reinforced concrete.14–17) In concretes, calcium ions are supplied from Ca(OH)2 which is the main component of concrete, and CHZ spontaneously forms on the zinc surface. A problem is that it takes several weeks or more for the CHZ to cover the entire zinc surface and provide high corrosion resistance. In the case of concrete, CHZ forms during the curing of concrete for about one month. However, accelerated formation of CHZ is essential for industrial CHZ formation on bare galvanized steel structures.
The CHZ formation proceeds by the following reactions.15,18)
| \begin{equation}
\textit{Zn} + 4\textit{OH}^{-} \to \textit{Zn}(\textit{OH})_{4}^{2-} + 2\textit{e}^{-}
\end{equation}
| (1) |
| \begin{equation}
\textit{Zn} + 2\textit{OH}^{-} \to \textit{ZnO} + \textit{H}_{2}\textit{O} + 2\textit{e}^{-}
\end{equation}
| (2) |
| \begin{equation}
\textit{O}_{2} + 2\textit{H}_{2}\textit{O} + 4\textit{e}^{-} \to 4\textit{OH}^{-}
\end{equation}
| (3) |
| \begin{equation}
\textit{ZnO} + \textit{H}_{2}\textit{O} + 2\textit{OH}^{-} \to \textit{Zn}(\textit{OH})_{4}^{2-}
\end{equation}
| (4) |
| \begin{align}
&2\textit{Zn}(\textit{OH})_{4}^{2-} + \textit{Ca}^{2+} + 2\textit{H}_{2}\textit{O}\\
&\quad \to \textit{Ca}(\textit{Zn}(\textit{OH})_{3})_{2} \cdot 2\textit{H}_{2}\textit{O} + 2\textit{OH}^{-}
\end{align}
| (5) |
and
(2) are the anodic reactions that produce electrons and always proceed simultaneously with the same magnitude of the cathodic reaction consuming electrons shown in
eq. (3). The
$\text{Zn(OH)}_{4}^{2-}$ produced in
eq. (1) and
(4) reacts with calcium ions and water in the solution and CHZ forms on the zinc surface as described in
eq. (5). When zinc dissolves according to
eq. (1) and
(2), then the reaction of
eq. (4) and
(5) occur spontaneously. In addition, in the saturated Ca(OH)
2 solution of highly alkaline environment with pH of about 12.5, the dissolution rate of zinc is limited by the oxygen reduction reaction.
19) Equation (1) and
(2) are rate-determined by
eq. (3), therefore, the oxygen reduction reaction in
eq. (3) is the rate-determining step for CHZ formation.
We have developed a hyperbaric-oxygen accelerated corrosion test in which a test solution is exposed to high-pressure oxygen gas to accelerate the oxygen reduction reaction that limits the corrosion of metallic materials. Using this method, we have studied the corrosion behavior of steel embedded in concrete with low corrosion rates.20–22) Since the CHZ formation is rate-dependent on the oxygen reduction reaction as described above, we expected that the supply of pressurized oxygen gas in this reaction system is effective to accelerate the CHZ formation. In this study, we attempted the acceleration of CHZ formation on zinc surface by immersion in saturated Ca(OH)2 solutions under high oxygen gas pressure. Furthermore, the corrosion resistance of zinc on which the CHZ formed (zinc with CHZ) was evaluated by potentiodynamic polarization tests and cyclic dry-wet corrosion tests.
2. Experimental
2.1 CHZ formation on zinc
A pure zinc plate (99.2%, The Nilaco Corporation) was used as samples. The samples with 15 mm × 50 mm × 1 mm were ground using SiC abrasive papers with a grit of up to #800 and degreased by sonicating in 2-propanol for 300 s. For the CHZ formation, the samples were immersed in a saturated Ca(OH)2 solution (sat. Ca(OH)2 solution) in the air and in pure oxygen gas at 0.1 MPa and 0.5 MPa. The partial oxygen pressure of the ambient air is 0.02 MPa. Hereafter, the 0.02 MPa, 0.1 MPa, and 0.5 MPa oxygen conditions are described as ‘0.02 MPa-environment’, ‘0.1 MPa-environment’ and ‘0.5 MPa-environment’, and the samples exposed to each environment is described as ‘0.02 MPa-sample’, ‘0.1 MPa-environment’ and ‘0.5 MPa-environment’, respectively.
In the 0.02 MPa-environment, the pure zinc samples were immersed in the sat. Ca(OH)2 solution in the ambient air. The beaker containing the sample and the sat. Ca(OH)2 solution was covered with plastic film to prevent evaporation of the test solution (Fig. 1(a)). In the 0.1 MPa-environment, the pure zinc samples were immersed in the sat. Ca(OH)2 solution bubbled with a pure oxygen gas in a covered acrylic container (Fig. 1(b)). In the 0.5 MPa-environment, the pure zinc samples were immersed in the sat. Ca(OH)2 solution in a titanium chamber, and pure oxygen gas was supplied to the Ti chamber up to 0.5 MPa (Fig. 1(c)). The immersion period was 1, 3 and 7 days. The CHZ formation was carried out for three times for each test environment.

After CHZ formation on pure zinc, the samples were rinsed ultrasonically in distilled water and 2-propernol for 300 s, respectively. The surface and cross section observation of the samples using a scanning electron microscope (SEM), (QuantaFEG, FEI), the measurement of sample weight change before and after the CHZ formation, and the X-ray diffraction (XRD) measurement (D2 Phaser, Bruker) of compounds formed on the sample surface were performed. In addition, as polished zinc plates were also prepared as the comparison sample and subjected to the potentiodynamic polarization tests and the cyclic wet and dry corrosion tests.
Dissolved oxygen (DO) concentrations in the sat. Ca(OH)2 solution in ambient air and kept for 24 h under 0.1 MPa and 0.5 MPa O2 gas pressure were measured. The DO concentration in the sat. Ca(OH)2 solutions under 0.1 MPa and 0.5 MPa O2 gas are assumed to be 40 mg/L and 200 mg/L, respectively under the assumption that a DO concentration in the sat. Ca(OH)2 solution in the ambient air (0.02 MPa O2) is 8 mg/L at 25°C and the oxygen dissolves in the solutions according to Henry’s law. The dissolved oxygen meter (OM-71, HORIBA) used in this study has a measurement range from 0.00 to 20.00 mg/L that is lower than the assumed DO concentrations of the solutions under 0.1 MPa and 0.5 MPa O2 gas. Therefore, the DO concentration of the sat. Ca(OH)2 solutions under the pressurized oxygen gas was measured by diluting the test solution with that exposed to 0.02 MPa environment.
When a certain volume (V2(L)) of the sat. Ca(OH)2 solution in the 0.1 or 0.5 MPa-environments is diluted with a certain volume (V1(L)) of the sat. Ca(OH)2 solution under the 0.02 MPa-environment, the amount of DO in the diluted solution is described as c1V1 + c2V2 (mg), where c1 (mg/L) is the DO concentration in the solution under the 0.02 MPa-environment, c2 (mg/L) is the DO concentration in the solutions in the 0.1 or 0.5 MPa-environments. Therefore, the DO concentration of the diluted test solution (c3 (mg/L)) is described as follows.
| \begin{equation}
c_{3} = \frac{c_{1}V_{1} + c_{2}V_{2}}{V_{1} + V_{2}}
\end{equation}
| (6) |
A variant of the above equation is as follows.
| \begin{equation}
c_{2} = \frac{c_{3}(V_{1} + V_{2}) - c_{1}V_{1}}{V_{2}}
\end{equation}
| (7) |
The measured DO concentration (
c1) of the sat. Ca(OH)
2 solution under 0.02 MPa-environment was 8.31 mg/L. Based on the theoretical values of DO concentration under the 0.1 MPa- and 0.5 MPa-environments described above, V
1 = 0.08 L and V
2 = 0.02 L were used to determine the DO concentration of the test solution under the 0.1 MPa-environment, and V
1 = 0.19 L and V
2 = 0.01 L were used for the solution under the 0.5 MPa-environment. Since the bubbling of the pure O
2 gas and supplying 0.5 MPa pure O
2 gas were stopped to measure the DO concentration in 0.02 MPa-environment, dilution of the solutions and the measurements were carried out as soon as possible.
2.2 Potentiodynamic polarization test
Potentiodynamic polarization tests were performed for 0.02 MPa-, 0.1 MPa-, and 0.5 MPa-samples and as polished zinc as a reference to discuss the electrochemical properties of zinc samples with CHZ. The potentiodynamic polarization tests were carried out three times for each condition. 1 mass% NaCl solution was used as an electrolyte and Ag/AgCl electrode and Pt wire were used as the reference and counter electrode, respectively. After immersing the samples in the NaCl solution for 10 min until the corrosion potential showed a constant value, the potential of the sample was swept with a sweep rate of 20 mV min−1 from −1.2 V to −0.7 V. In this paper, all potentials are expressed as vs. Ag/AgCl.
2.3 Cyclic wet and dry corrosion test
The cyclic wet and dry corrosion test (CCT) was carried out for 0.02 MPa-, 0.1 MPa- and 0.5 MPa-samples and as polished zinc as a reference to evaluate the corrosion resistance of zinc with CHZ. The CCT was carried out three times for each condition. Before the CCT, 240 µL of a mixture of NaCl solution and ethanol (mixing ratio 1:4) was dropped onto the sample surface (sample area: 15 × 50 mm2) to obtain a Cl− density of 1 g/m2 (Cl− amount on the sample: 0.75 mg). Ethanol was mixed with the NaCl solution to increase the wettability to the sample surface and to form a solution film over the entire surface of the sample. Then, the CCT consisting of four cycles of wet (95% relative humidity, 4 hours) and dry (30% relative humidity, 2 hours) conditions was performed for a total of 24 hours. The temperature was maintained at 50°C during the CCT. After the CCT, the samples were ultrasonically cleaned in distilled water and isopropanol for 5 min, respectively, and dried naturally. The sample surface was observed using a digital microscope (RH-8800, HIROX), analyzed using SEM and energy dispersive X-ray spectroscopy (EDS), and the change in sample weight before and after the CCT was measured.
3. Results and Discussion
3.1 Rapid formation of CHZ on zinc surface
Figure 2 shows the surface images of the as polished sample and the 0.02 MPa-, 0.1 MPa- and 0.5 MPa-samples. Under the 0.02 MPa-environment, almost no changes were observed in the appearance of the samples immersed in the sat. Ca(OH)2 solution for 1 day and 3 days, whereas the sample immersed in the sat. Ca(OH)2 solution for 7 days lost its metallic luster. Under the 0.1 MPa- and the 0.5 MPa-environments, the samples immersed in the sat. Ca(OH)2 solutions for 1 day and longer lost their metallic luster, which suggests that the sample surface was covered with zinc compound. Figure 3 shows the backscattered electron images (BE images) observed by SEM of the 0.02 MPa-, 0.1 MPa-, and 0.5 MPa-samples immersed in the sat. Ca(OH)2 solution for 7 days. On the 0.02 MPa-sample, some compounds shown in dark gray contrast formed in places on the surface, whereas most of the zinc substrate, shown in light gray contrast, was exposed. On the 0.1 MPa- and the 0.5 MPa-samples, the compound formed a layer covering almost the entire surface of the sample. However, on the 0.1 MPa-sample, zinc substrate was observed as light gray contrast dots in some places more frequently than on the 0.5 MPa-sample, suggesting that the compound did not completely cover the substrate surface on the 0.1 MPa-sample.
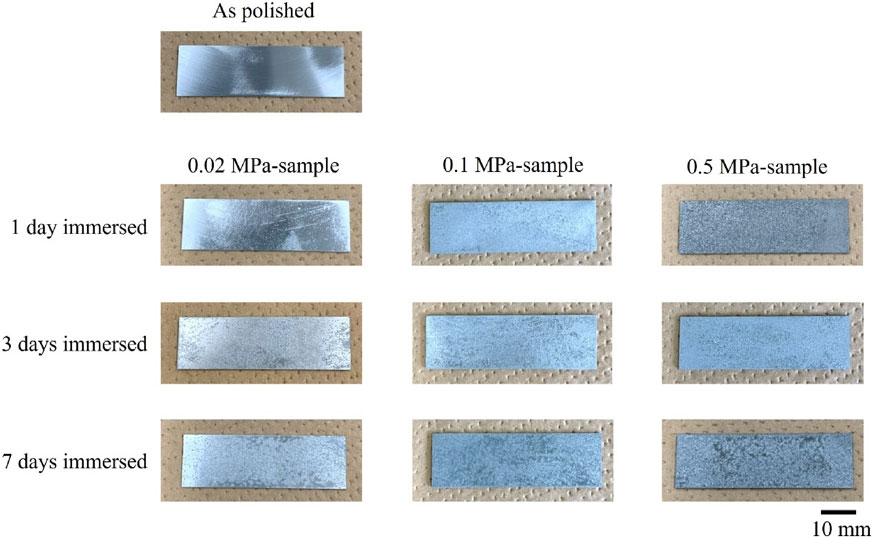
Figure 4 shows the XRD patterns of the 0.02 MPa-, 0.1 MPa-, and 0.5 MPa-sample surfaces at 1 day after immersion. Only zinc and CHZ peaks were detected on all the samples, indicating that the compound formed by immersion in the sat. Ca(OH)2 solution consisted of only CHZ and the compounds except CHZ did not form as the DO concentration increased. Comparing the intensity of the zinc and CHZ peaks among the three conditions, the zinc peaks were stronger than the CHZ peaks for the 0.02 MPa-sample, whereas the CHZ peaks were stronger than the Zn peaks for the 0.1 MPa- and 0.5 MPa-samples. It is indicated that a larger amount of CHZ was formed on the 0.1 MPa- and 0.5 MPa-samples. These results reveal that increasing the DO concentration in the sat. Ca(OH)2 solution is effective to accelerate the CHZ formation on the zinc surface.

Figure 5 shows the weight changes of the samples before and after the CHZ formation. The weight of 0.02 MPa-sample increased slightly in proportion to time up to 7 days. The weight increase in the 0.1 MPa-sample after 1 day-immersion was significantly larger than that of the 0.02 MPa-sample after 7 day-immersion. Although the rate of weight change slowed down after 3 day-immersion, a gradual weight increase was observed up to 7 day-immersion. The 0.5 MPa-sample showed a larger weight increase than the 0.1 MPa-sample after 1 day-immersion, and thereafter, the rate of weight change decreased to show a slight weight increase until 7 days. The rate of weight change during CHZ formation slowed down because the zinc ion supply from the substrate decreased as the CHZ formed and the coverage of the zinc surface by CHZ increased.

Table 1 shows the DO concentration of the sat. Ca(OH)2 solution. The DO concentration under 0.1 MPa- and 0.5 MPa-environments was approximately 5 times and 25 times higher than that under 0.02 MPa-environment. Therefore, the DO concentration of the sat. Ca(OH)2 solution in this study was found to be proportional to the supplied oxygen (partial) pressure in accordance with Henry’s law. In our previous studies using the hyperbaric-oxygen accelerated corrosion test, the oxygen reduction reaction on the surface of iron samples embedded in mortar was accelerated in proportion to the supplied oxygen (partial) gas pressure.21) In this study, the increase in the DO concentration at 0.1 MPa and 0.5 MPa accelerated the oxygen reduction reaction on the sample surface shown in eq. (3), leading to the enhancement of the CHZ formation.

Table 1 Dissolved oxygen concentration in sat. Ca(OH)2 solution exposed to O2 gas at various (partial) pressure.
Figure 6 shows the cross-section SEM images of the samples with CHZ. Only Fig. 6(a) and (b) show higher magnification images than the others. On the 0.02 MPa-sample, scaly CHZ was scattered across the sample surface, and the zinc substrate was exposed in some places. On the 0.1 MPa-sample, a layer was formed by the aggregation of scale-like CHZ, and a lot of defects were observed inside the CHZ layer. The 0.5 MPa-sample showed defects in the layer after 1 day-immersion similar to the 0.1 MPa-sample, whereas after 3 and 7 day-immersion, few defects were observed, and the layer obtained a dense and uniform structure. Pokorný et al. and Tittarelli et al. also reported that CHZ exhibits a scaly morphology,15,19) and Maeda et al. demonstrated the densification of scale-like CHZ by immersion of zinc plates in a saturated Ca(OH)2 solution for 20 h and 400 h.23) In this study, the exposure to 0.5 MPa oxygen gas promoted the formation and growth of CHZ most efficiently, resulting in a rapid morphological change from a coarse layer consisting of scaly CHZ to a dense CHZ layer. Figure 7 shows the average thickness of the CHZ layer formed under each condition. Five cross-sectional SEM images were taken for each sample, and one location was randomly selected from the locations where CHZ was formed to measure the thickness. On the 0.02 MPa-sample, the CHZ thickness increased with increasing immersion period, reaching approximately 7 µm in 7 days. On the 0.1 MPa-sample, it was approximately 6 µm in 1 day and then grew to approximately 8.5 µm with increasing in the immersion period. On the 0.5 MPa-sample, it grew to approximately 8.5 µm within 1 day and showed little change thereafter. The maximum thickness of the CHZ layer obtained under the formation conditions in this study was approximately 8.5 µm, and the further growth in thickness of the CHZ layer was suppressed. This result corresponds to the saturation of the weight changes for each sample shown in Fig. 5. Maeda et al. reported that CHZ exhibits insulating properties by using electrochemical impedance spectroscopy measurements,23) and it is considered that the dissolution of zinc is suppressed by the CHZ coverage and the CHZ does not grow further in thickness than a certain thickness.


Figure 8 shows the formation process of the CHZ layer in the sat. Ca(OH)2 solution. The main reaction at each stage is shown in A–D. First, zinc dissolves to form $\text{Zn(OH)}_{4}^{2-}$ by the reaction of eq. (1), (2), and (4) (Fig. 8(A)). The formation of $\text{Zn(OH)}_{4}^{2-}$ is rate-determined by the oxygen reduction reaction shown in eq. (3). Subsequently, $\text{Zn(OH)}_{4}^{2-}$ reacts with Ca2+ and water in the solution to form the nucleus of CHZ (Fig. 8(B)). As new CHZ nucleation and growth of CHZ proceed, the zinc surface is gradually covered by an insulating CHZ layer (Fig. 8(C)). This stage corresponds to 1, 3 and 7 day-immersion for the 0.1 MPa-sample and 1 day-immersion for the 0.5 MPa-sample as shown in Fig. 6. As the zinc substrate exposed area decreases, CHZ nucleation and growth are suppressed (Figs. 5 and 7). At the stage shown in Fig. 8(C), the solution permeation to the zinc substrate surface is not completely suppressed because there are many defects in the CHZ layer. Therefore, the formation and growth of CHZ continue, and finally, a dense CHZ layer forms (Fig. 8(D)). Stage D corresponds to 3 and 7 day-immersion for the 0.5 MPa sample as shown in Fig. 6. Since the formation of $\text{Zn(OH)}_{4}^{2-}$ and the oxygen reduction reaction occur in every stage of A, B, C and D, the increase in DO concentration in the solution accelerates the reaction at every stage. However, the CHZ formation is suppressed as the exposed area of zinc decreases with time. It is therefore considered that the most effective stages at which the increased DO concentration accelerates the CHZ formation are stages A and B.

Figure 9 shows the polarization curves of the samples from −1.2 V to −0.7 V for each condition. The polarization curve of the as polished sample showed an oxygen diffusion limiting current density from −1.2 V to around the corrosion potential. In the range of anodic potential, the dissolution of zinc was accelerated as the potential increased, and the anodic current density continued to increase. The polarization curves of the 0.02 MPa-sample after 1 day-immersion showed almost no difference from the as polished sample. The oxygen diffusion limiting current density and the dissolution current density of zinc were slightly suppressed as the CHZ formation period increased. This is because the area of zinc substrate contacting with the solution decreased as the insulating CHZ covered the sample surface. On the 0.1 MPa- and 0.5 MPa-samples, the oxygen diffusion limiting current density and zinc dissolution current density were suppressed by 1 day-immersion more significantly than those of the 0.02 MPa-sample by 7 day-immersion, indicating that the CHZ layer accelerated formed is expected to improve zinc corrosion resistance.

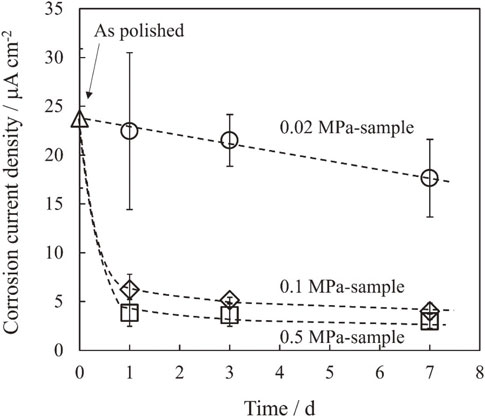
The Tafel extrapolation method24) was performed to obtain the corrosion current density for each sample. In the Tafel extrapolation method, linear regions observed at 50 mV or higher than the corrosion potential of the cathodic and anodic current curves were extrapolated, respectively, and the intersection of the two linear lines was determined as the corrosion current density. The corrosion current density for each condition is shown in Fig. 10. The horizontal axis represents the time of CHZ formation, and the vertical axis represents the corrosion current density. For the 0.02 MPa-sample, the corrosion current density gradually decreased in proportion to the increase in the CHZ formation period. For the 0.1 MPa-sample, the corrosion current density decreased rapidly by 1 day of CHZ formation, followed by a gradual decrease in the subsequent period. For the 0.5 MPa-sample, the corrosion current density decreased more rapidly than that for the 0.1 MPa-sample by 1 day of CHZ formation, followed by a gradual decrease in the subsequent period similar to the 0.1 MPa-sample. For the 0.5 MPa-sample with 7 days of CHZ formation, the corrosion current density was about 5 µA/cm2, which was approximately 1/5 of that for the as polished sample (corrosion current density: approx. 25 µA/cm2), and approx. 1/4 of that for the 0.02 MPa-sample with 7 days CHZ formation (corrosion current density: approx. 20 µA/cm2). The polarization curves and corrosion current densities suggest that zinc with CHZ almost completely covering the surface has higher corrosion resistance than the as polished zinc and zinc with sparse CHZ coverage.
Then, the corrosion behavior of zinc with CHZ was evaluated by CCT. Figure 11 shows the surface images of the samples after the CCTs. Severe corrosion and formation of white zinc corrosion products were observed on the as polished and 0.02 MPa-samples. On the 0.02 MPa-sample, the longer the CHZ formation period, the less corrosion products were observed. On the other hand, little corrosion and corrosion products were observed on the 0.1 MPa- and 0.5 MPa-samples, regardless of the period of CHZ formation. The surface images of the as polished sample and the samples with 7 days of CHZ formation obtained with a digital microscope after CCTs are shown in Fig. 12 to discuss the corrosion behavior of the sample surface in detail. On the as polished sample, white and large-grained zinc corrosion products covered the entire surface. On the 0.02 MPa-sample, large-grained zinc corrosion products were also observed as on the as polished sample, whereas some areas were not covered with corrosion products. On the 0.1 MPa- and 0.5 MPa-samples, small white grains with 10 µm diameter were observed (indicated by red circles in the figure). However, corrosion products with large grains were rarely observed. This result shows that the formation and coverage by CHZ improved the corrosion resistance of zinc.


Figure 13 shows the weight changes of the samples during the CCTs. The weight change of all the samples showed a positive value because the weight change was measured with corrosion products on the samples. The as polished samples and the 0.02 MPa-samples of 1 day- and 3 day-immersion showed the largest weight changes, indicating that they were the most corroded. For the 0.02 MPa-sample, the weight change was slightly smaller after 7 day-immersion. For the 0.1 MPa-sample, the weight change was smaller than that of the 0.02 MPa-samples after 1 day-immersion, and the weight change was smaller as the period of CHZ formation increased. The 0.5 MPa-sample showed the smaller weight change than that of other condition, and the smallest weight change was obtained for the 7 day-immersion sample, of which the weight change was approximately 1/10 of that of the as polished sample. The CCT results indicate that the more CHZ covers the zinc surface, the more the zinc corrosion is suppressed. Figure 14 shows the BE images of the surface of the as polished sample and the 0.02 MPa-, 0.1 MPa-, and 0.5 MPa-samples of 7 day-immersion after CCTs. To distinguish between corrosion products and CHZ on the sample surface, Ca mapping images in the same field of BE images were obtained by EDS and shown. The white contrast areas where Ca was detected are the areas of zinc covered with CHZ. The BE images show that the entire surface of the as polished sample was covered with coarse corrosion products, whereas on the 0.02 MPa-, 0.1 MPa- and 0.5 MPa-samples, corrosion products areas and CHZ areas were observed. The areas of corrosion product decreased with increasing DO concentration, indicating that the formation of CHZ improved the corrosion resistance of zinc. In addition, the BE image of the 0.5 MPa-sample shows that the corrosion products formed at the defects in the CHZ layer. In other words, although the CHZ itself has high barrier properties, the corrosion initiates when the solution penetrates through the defects in the CHZ layer and reaches the zinc surface, therefore, the denser CHZ layer contributes the higher corrosion resistance of zinc. In particular, the corrosion resistance of zinc with a dense CHZ layer grown to the stage in Fig. 8(D) is significantly higher than that of bare zinc or zinc covered with a CHZ layer with many defects, and the accelerated CHZ formation by increasing the DO concentration is expected to be an industrially valuable method.

4. Conclusions
In this study, the effect of the dissolved oxygen (DO) concentration of saturated Ca(OH)2 solution on the formation of calcium hydroxy zincate (CHZ) on pure zinc was investigated. The corrosion resistance of zinc coated with CHZ was also investigated by potentiodynamic polarization measurements and cyclic wet and dry corrosion tests. The followings are the conclusions of the study.
-
(1)
CHZ formation was accelerated with increasing the DO concentration of sat. Ca(OH)2 solution. CHZ is the only compound on the zinc surface immersed in the sat. Ca(OH)2 solution in 0.02 MPa-, 0.1 MPa-, and 0.5 MPa-environment.
-
(2)
In the process of CHZ formation, CHZ is initially formed as scaly dots on the zinc surface, followed by formation and growth of CHZ nuclei, leading to form a dense a CHZ layer. Then, the CHZ formation is gradually suppressed as the exposed area of zinc decreases with the formation and growth of CHZ nuclei.
-
(3)
Zinc covered with a dense CHZ layer exhibits higher corrosion resistance compared to the as polished zinc. For example, for the 0.5 MPa-sample immersed for 7 days, the corrosion current density decreased to approximately 1/5 and the weight change in cyclic wet and dry corrosion tests was approximately 1/10 of those for the as polished sample.
Acknowledgements
This work was supported by Grant-in-Aid for Scientific Research (C) (Japan Society for the Promotion of Science, JSPS, Project No. 21K04226).
REFERENCES
- 1) A.R. Marder: Prog. Mater. Sci. 45 (2000) 191–271. doi:10.1016/S0079-6425(98)00006-1
- 2) A.P. Yadav, A. Nishikata and T. Tsuru: Corros. Sci. 46 (2004) 169–181. doi:10.1016/S0010-938X(03)00130-6
- 3) V. Barranco, S. Feliu, Jr. and S. Feliu: Corros. Sci. 46 (2004) 2203–2220. doi:10.1016/j.corsci.2003.09.032
- 4) M. Natesan, G. Venkatachari and N. Palaniswamy: Corros. Sci. 48 (2006) 3584–3608. doi:10.1016/j.corsci.2006.02.006
- 5) H. Matsuda and A. Yabuki: Zairyo-to-Kankyo 66 (2017) 238–245. doi:10.3323/jcorr.66.238
- 6) K. Tachibana, Y. Morinaga and M. Mayuzumi: Corros. Sci. 49 (2007) 149–157. doi:10.1016/j.corsci.2006.05.015
- 7) Y. Morinaga, K. Tachibana, M. Mayuzumi, T. Tani, T. Kon and M. Yamada: Corrosion 64 (2008) 929–938. doi:10.5006/1.3294408
- 8) K. Sarkar, A. Mondal, A. Chakraborty, M. Sanbui, N. Rani and M. Dutta: Surf. Coat. Technol. 348 (2018) 64–72. doi:10.1016/j.surfcoat.2018.05.036
- 9) N. Wint, N. Cooze, J.R. Searle, J.H. Sullivan, G. Williams, H.N. McMurray, G. Luckeneder and C. Riener: J. Electrochem. Soc. 166 (2019) C3147–C3158. doi:10.1149/2.0171911jes
- 10) C.E. Jordan and A.R. Marder: Metall. Mater. Trans. A 25 (1994) 937–947. doi:10.1007/BF02652269
- 11) Y. Kobayashi: J. Surf. Finish. Soc. Jpn. 66 (2015) 187–190. doi:10.4139/sfj.66.187
- 12) F. Rosalbino, G. Scavino, G. Mortarino, E. Angelini and G. Lunazzi: J. Solid State Electrochem. 15 (2011) 703–709. doi:10.1007/s10008-010-1140-7
- 13) G. Roventi, T. Bellezze, E. Barbaresi and R. Fratesi: Mater. Corros. 64 (2013) 1007–1014. doi:10.1002/maco.201206868
- 14) G. Roventi, T. Bellezze, G. Giuliani and C. Conti: Cement Concr. Res. 65 (2014) 76–84. doi:10.1016/j.cemconres.2014.07.014
- 15) P. Pokorný, M. Kouril and V. Kucera: Materials 12 (2019) 2786. doi:10.3390/ma12172786
- 16) S. Dong, B. Zhao, C. Lin, R. Du, R. Hu and G. Zhang: Constr. Build. Mater. 28 (2012) 72–78. doi:10.1016/j.conbuildmat.2011.08.026
- 17) H. Zheng, J.-G. Dai, C.S. Poon and W. Li: Cement Concr. Res. 108 (2018) 46–58. doi:10.1016/j.cemconres.2018.03.001
- 18) Z.Q. Tan and C.M. Hansson: Corros. Sci. 50 (2008) 2512–2522. doi:10.1016/j.corsci.2008.06.035
- 19) F. Tittarelli and T. Bellezze: Corros. Sci. 52 (2010) 978–983. doi:10.1016/j.corsci.2009.11.021
- 20) K. Doi, S. Hiromoto and E. Akiyama: Mater. Trans. 59 (2018) 927–934. doi:10.2320/matertrans.M2018029
- 21) K. Doi, S. Hiromoto, H. Katayama and E. Akiyama: J. Electrochem. Soc. 165 (2018) C582–C589. doi:10.1149/2.1421809jes
- 22) K. Doi, S. Hiromoto, T. Shinohara, K. Tsuchiya, H. Katayama and E. Akiyama: Corros. Sci. 177 (2020) 108995. doi:10.1016/j.corsci.2020.108995
- 23) M. Maeda, X. Li, A. Ooi, E. Tada and A. Nishikata: ISIJ Int. 60 (2020) 337–345. doi:10.2355/isijinternational.ISIJINT-2019-396
- 24) K. Noda and T. Saito: Zairyo-to-Kankyo 67 (2018) 9–16. doi:10.3323/jcorr.67.9

