Abstract
The optimization of processing parameters is indispensable for the laser powder bed fusion (L-PBF) process. The deposited energy density (DED) is one of the process indexes for the L-PBF process and has a simplified formula of P·v−0.5, where P is the laser power, and v is the scan speed. This parameter describes the change in the relative density and the melt pool morphology with laser power and scan speed well, whereas it does not include the effect of other processing parameters, e.g., hatch spacing (S). In the present study, an attempt was made to incorporate the effect of S into DED. Al–12Si (mass%) alloy cube samples were fabricated by L-PBF under various P, v, and S, for evaluating the relative density and the melt pool morphology. The melt pool depth and width of L-PBF-manufactured Al–12Si alloy increased linearly with P·v−0.5 and did not exhibit a clear correlation with S. Based on the experimental observation, the effect of hatch spacing on DED was estimated to be S−0.5, and a new index of P·v−0.5·S−0.5 was proposed. This index described the change in the relative density of the L-PBF-manufactured Al–12Si alloy with laser conditions (P, v, and S) well when the thermal conduction mode melting was dominant. This study also indicated the limitation of the applicability of P·v−0.5·S−0.5 under the keyhole or transition mode melting.

1. Introduction
Metal additive manufacturing (AM) is a forming and processing technology to manufacture metallic parts with complex shapes.1–4) The metal AM also enables the fabrication of metallic products that have been conventionally made by combining multiple parts into a single unit.5) Laser powder bed fusion (L-PBF), which is one of the most common metal AM technologies, repeats the powder bedding on a building platform and laser scanning on the powder bed to build the metallic parts.2) The L-PBF process involves a large thermal gradient and rapid heating/solidification during the process.6) Such a unique thermal field leads to L-PBF-manufactured metallic parts having unique microstructures including crystallographic texture,7,8) supersaturated solid solution,9–11) and metastable phases.12,13) Because of this, these parts exhibit outstanding properties such as controlled elastic modulus,14) high strength,15) and anisotropic thermal conductivity.16) Thus, the L-PBF process can provide high- and multi-functionality of built parts by not only shaping complex topologies but also controlling the unique microstructures.
In the L-PBF process, the optimization of processing parameters for each material is indispensable.17–21) The processing parameters including laser power, scan speed, and hatch spacing are especially crucial conditions for the quality of the built parts. For example, under a low laser energy input condition, built parts often exhibit irregular-shaped lack-of-fusion defects and sometimes even don’t consolidate.22) However, excessive laser energy input causes a keyhole mode melting phenomenon and leaves spherical pores by the entrapment of atmospheric gas.22) Thus, the laser energy input depending on the laser parameters is one of the most important process indexes. As an energy density index, the following volumetric energy density (VED) is commonly used in the L-PBF process.23–25)
| \begin{equation}
\mathrm{VED} = \frac{P}{vSt}
\end{equation}
| (1) |
where
P is the laser power,
v is the scan speed,
S is the hatch spacing (spacing between adjacent laser tracks), and
t is the powder bed thickness. The VED has a physical meaning of total heat energy (unit: J) to make a part per the volume of the part (unit: m
3). The VED is useful for optimizing the laser conditions because the effect of four processing parameters can be combined into one parameter. However, it has been pointed out that the VED cannot describe the change in the quality of built parts, e.g., relative density with laser conditions under a wide range of processing parameters.
26)
As another parameter, the following deposited energy density (DED) has been applied.27,28)
| \begin{equation}
\mathrm{DED} = \frac{AP}{\sqrt{\pi Dv\sigma^{3}}}
\end{equation}
| (2) |
where
A is the laser absorptivity,
D is the thermal diffusivity, and σ is the spot size. DED also has a unit of energy (J) per unit volume (m
3). In the DED model, thermal conduction during laser irradiation is considered, and the thermal diffusion distance is used for the volume of the heat input region. DED can be simplified as
P·
v−0.5 when
A,
D, and σ are fixed (using a single material and fixing defocus). It is reported that
P·
v−0.5 describes the change in relative density and melt pool morphology of L-PBF-manufactured maraging steel
29) and Al–2.5 mass%Fe alloy
15) better than the VED. However, DED has been proposed in the laser welding field and therefore does not include the processing parameters specific to the L-PBF process (hatch spacing (
S), powder bed thickness (
t)). By incorporating the effect of processing parameters specific to the L-PBF process into DED, a better process index can be established. Moreover, the laser parameters are recently optimized using machine-learning approaches.
30–33) The establishment of a new process index will contribute to the reduction of data required for the machine-learning approaches because multiple variables (processing parameters) are treated as one variable (dimensionality reduction based on physical models). In the present study, an attempt was made to incorporate the effect of hatch spacing into the DED. The Al–12Si (mass%) alloy powder, which is commonly used for the L-PBF, was processed by various laser power, scan speed, and hatch spacing. The relative density and melt pool morphology of the built samples were evaluated. Based on the evaluation of the melt pool size, a new process index, in which the effect of hatch spacing is considered in DED, was proposed. The new index was validated using the relative density of Al–12Si alloy.
2. Experimental Procedure
2.1 Additive manufacturing of the samples and measurement of their relative density
The Al–12Si alloy powder was used as a starting material. The morphology and chemical composition of the powder is given elsewhere.34,35) The 3D printer used to fabricate samples was 3Dsystems ProX DMP 200. Cubic samples with a size of 15 × 15 × 15 mm3 were fabricated under various conditions shown in Table 1. The spot size (σ) and powder bed thickness (t) were set at ∼100 µm and 30 µm, respectively. Laser power (P), scan speed (v), and hatch spacing (S) were changed in the range of 102–255 W, 500–3000 mm·s−1, and 50–200 µm, respectively. Figure 1 presents the applied laser conditions plotted on (a) the P-v map and P·v−0.5-S map. The laser conditions include various P·v−0.5 in the range of 2.3–11.4 J·mm−0.5·s−0.5. Under each P·v−0.5, S was changed from 50 to 200 µm. The sample fabricated under P·v−0.5 of 2.3 J·mm−0.5·s−0.5 and S of 200 µm was unconsolidated as shown in the photograph in Fig. 1(b), due to low laser energy input and excluded from the evaluations.

Table 1 LPBF processing parameters applied in this study.
After the fabrication, the samples were cut out from the base plate, and the relative density of the samples was measured using the Archimedes method.
2.2 Observations of the defect and melt pool morphology
The samples were cut to expose cross-sections parallel and perpendicular to the building direction (denoted as Z direction). The samples were first wet polished with SiC emery papers (Struers inc., #800, #1200, #2400). They were then mirror-polished using colloidal silica (Musashino Denshi, inc. Chemical liquid, 0.05 µm, PH9.8). The cross-sections were observed using an optical microscope (EclipseLV150N, Nikon, Japan) to investigate the defect morphology formed under each laser condition.
To observe the melt pool morphology and measure the melt pool size (depth and width), the mirror-polished samples that were cut parallel to the building direction were electropolished using a 10% perchloric acid-ethanol mixed solution. The cross-sections of samples were then observed using the optical microscope. The depth and width of seven melt pools at the top of each sample were measured using image-analysis software (Image J, National Institutes of Health, USA). The distance from the top of each sample to the bottom of the semi-ellipse-shaped melt pool was measured as the melt pool depth (d). The depth of five melt pools excluding the melt pools with the largest and smallest depth was averaged. It is difficult to exactly measure the melt pool width because of the inclination of the observed cross-section to the section perpendicular to the scanning direction and the overlapping of adjacent melt pools as shown in Fig. 2. Therefore, two assumptions were applied in the present study: (1) the ratio of hatch spacing to the distance between adjacent melt pool bottoms corresponds to the cosine of the inclination angle and (2) the melt pool is symmetrical with respect to the scanning lines. The distance between melt pool bottoms (S′) was measured, and then the cosine of the inclination angle was expressed as S/S′. The distance between a perpendicular line drawn from the bottom of the melt pool to the top of the sample and the observable edge of the melt pool (w′/2) was measured. Then, the melt pool width (w) was quantified as w′S/S′. The widths of five melt pools excluding the melt pools with the largest and smallest ones were averaged.

3. Results and Discussion
Figure 3 shows the change in the relative density of L-PBF-fabricated Al–12Si alloys as a function of hatch spacing (S). The relative density tended to decrease with an increase in S. When the laser power (P) and scan speed (v) were 102 W and 2000 mm·s−1 (the lowest P·v−0.5 of 2.9 J·mm−0.5·s−0.5), respectively, the relative density was a low value of approximately 0.85 at S of 50 µm and decreased drastically to approximately 0.7 with increasing S to 200 µm. Under the other P and v conditions in this study, the relative density was around 0.94∼0.98 at S of 50 µm. When laser conditions with higher P·v−0.5 of (P, v, P·v−0.5) = (191 W, 1200 mm·s−1, 5.5 J·mm−0.5·s−0.5), (191 W, 800 mm·s−1, 6.8 J·mm−0.5·s−0.5), (255 W, 1200 mm·s−1, 7.4 J·mm−0.5·s−0.5), and (255 W, 500 mm·s−1, 11.4 J·mm−0.5·s−0.5) were applied, the reduction in relative density with S was relatively suppressed.
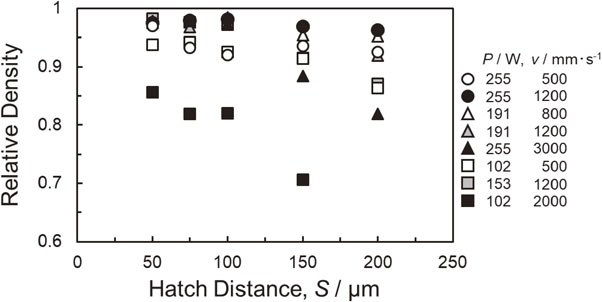
Figure 4 presents representative optical micrographs showing the defects formed in Al–12Si alloys fabricated by L-PBF under P of 255 W, v of (a)–(c) 3000 mm·s−1 (P·v−0.5 = 4.7 J·mm−0.5·s−0.5), (d)–(f) 1200 mm·s−1 (P·v−0.5 = 7.4 J·mm−0.5·s−0.5), and (g)–(i) 500 mm·s−1 (P·v−0.5 = 11.4 J·mm−0.5·s−0.5), and S of (a), (d), (g) 50 µm, (b), (e), (h) 100 µm, and (c), (f), (i) 200 µm. Under v of 3000 mm·s−1, slight irregular-shaped defects were observed at a hatch spacing of 50 µm. The defects increased at S of 100 µm. At S of 200 mm, significant lack-of-fusion defects with a size of approximately 100 µm were formed. The formation of lack-of-fusion defects was suppressed under v of 1200 mm·s−1. Even when the hatch spacing was 200 µm, the size of lack-of-fusion defects was approximately 10 µm. Under a scan speed of 500 µm·s−1, spherical pores were consistently observed under all the hatch spacing. The size of spherical pores was approximately 50 µm, although the size was relatively reduced at a hatch spacing of 50 µm.

Figure 5 indicates optical micrographs showing locations of defects formed in Al–12Si alloys fabricated by L-PBF under P of 255 W, v of (a), (b) 3000 mm·s−1 and (c), (d) 500 mm·s−1, and S of (a), (c) 75 µm, (b), (d) 150 µm. When v is 3000 mm·s−1, the irregular-shaped lack-of-fusion defects were formed between adjacent melt pools by increasing the hatch spacing from 75 µm to 150 µm (Fig. 5(a), (b)), indicating that the lack-of-fusion defects were generated by less overlapping of adjacent melt tracks. In contrast, when v is 500 mm·s−1, spherical pores tended to form inside the melt pools (Fig. 5(c), (d)).
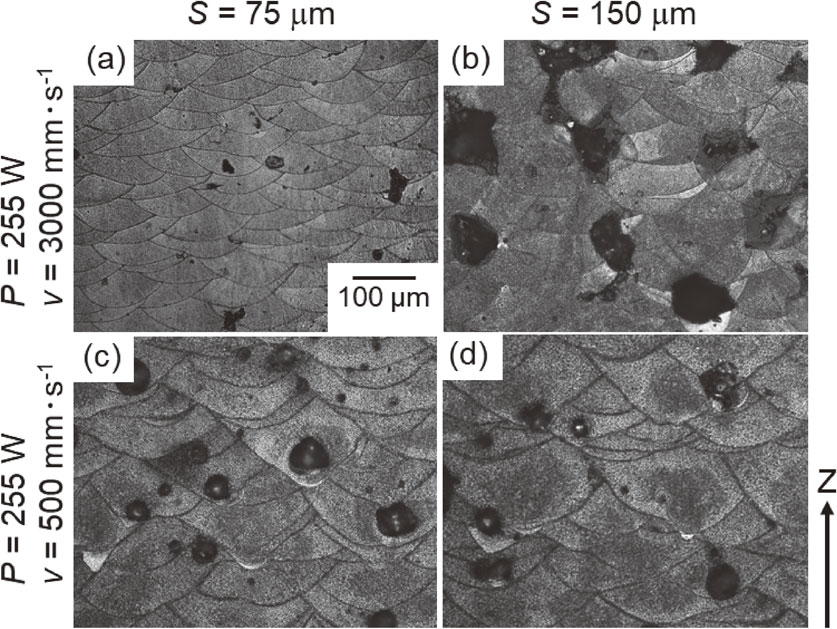
Figure 6 presents optical micrographs showing the morphology of melt pools formed in Al–12Si alloys fabricated by L-PBF under the laser conditions of (P, v, S) = (a) (255 W, 1200 mm·s−1, 50 µm), (b) (255 W, 1200 mm·s−1, 100 µm), (c) (255 W, 3000 mm·s−1, 50 µm), and (d) (255 W, 500 mm·s−1, 100 µm). The dotted line represents the melt pool boundaries. Semi-circular melt pools with a depth of approximately 100 µm were observed in Fig. 6(a), (b). These figures also indicate that the S had a slight effect on the melt pool morphology. Smaller melt pools with a depth of approximately 50 µm were observed in Fig. 6(c). The melt pool size was significantly affected by reducing v (increasing P·v−0.5). The melt pools shown in Fig. 6(d) had a depth of approximately 200 µm and were inflected (shown in the broken line).

Figure 7 shows the change in the relative density with P·v−1 based on the VED and P·v−0.5 based on DED. When the relative density was plotted against both P·v−1 and P·v−0.5, the relative density tended to increase significantly from the left side of the graph toward the right side and then decrease slightly at the right end. However, when the relative density was plotted against P·v−1, the relative density decreased discontinuously at P·v−1 of approximately 0.2 J·mm−1 under all S conditions. The trend was improved consistently under all S by plotting the relative density against P·v−0.5. The samples with the deviated relative density were fabricated under a relatively low P of 102 W and v of 500 mm·s−1. In the VED model, the thermal diffusion length is assumed to be a constant (corresponding to the powder bed thickness). As a result, the contributions of laser power and scan speed are considered equivalent as denoted by P·v−1. But under a lower scan speed, the assumption would not be applied because a lower scan speed provides a longer period for thermal diffusion and a deeper thermal diffusion length. The deeper thermal diffusion length leads to a larger volume in which the laser energy is distributed and a less pronounced increment in the energy density. Thus, the contribution of scan speed to the energy density would be smaller than that of laser power. In the DED model, the time dependence of thermal diffusion length is considered, and therefore the simplified formula is denoted as P·v−0.5. By considering the time dependence of thermal diffusion length, the deviation of the relative density at the low v condition was improved in Fig. 7(b). From these results, it can be concluded that the P·v−0.5 was a better parameter for describing the change in the relative density of not only the maraging steel and Al–2.5 Fe15,29) but Al–12Si alloy with laser conditions.

Figure 8 presents the change in the melt pool (a) depth (d) and (b) width (w) with P·v−0.5. d and w are increased monotonically to P·v−0.5 and did not show a clear correlation with S. Therefore, the morphology of melt pools was only controlled by P and v and was almost independent of S. Moreover, when P·v−0.5 was below ∼8.5 W J·mm−0.5·s−0.5, both melt pool width and depth increased linearly to P·v−0.5. It is noted here that d and w at P·v−0.5 of 11.4 J·mm−0.5·s−0.5 were relatively scattered and tended to deviate from the extrapolation from the data at lower P·v−0.5. Under the P·v−0.5 of 11.4 J·mm−0.5·s−0.5, the spherical pores were formed as shown in Fig. 4(g)–(i). The melt pools had an inflected morphology, as shown in Fig. 6(d). These results indicate that the metal powder would be melted under the keyhole mode or transition mode at this condition, and therefore the melt pool size tended to be enlarged. In other words, at a lower P·v−0.5 than ∼8.5 W J·mm−0.5·s−0.5, the Al–12Si alloy powder was melted under the thermal conduction mode and the melt pool size showed a linear correlation with P·v−0.5.

Based on these results, the effect of S on the DED is considered. The DED takes the thermal diffusion depth during laser irradiation into account and corresponds to the energy density of one laser scanning. To reflect the effect of S on the energy density, thermal conduction in the width direction of the melt pool is considered, and the interaction between adjacent melt tracks should be considered. Therefore, the simplified DED (P·v−0.5) is multiplied by the melt pool depth normalized by S (w·S−1). The melt pool width is a trace of thermal conduction in the width direction. w·S−1 also indicates the overlapping of adjacent melt tracks. As shown in Fig. 8, d and w were proportional to the P·v−0.5 by limiting the conditions under the thermal conduction mode, and therefore w could be substituted by the P·v−0.5. Here, the parameter, P2·v−1·S−1 is obtained. Since this parameter represents two adjacent melt tracks, it is synergistically averaged and normalized to a single laser scanning. As a result, the parameter, P·v−0.5·S−0.5 is obtained. The parameter estimates that the effect of S on the DED would be represented by S−0.5.
Figure 9 presents the change in relative density as functions of (a) P·v−1·S−1 based on VED and (b) P·v−0.5·S−0.5. In this figure, the relative density at (P, v, P·v−0.5) = (255 W, 500 mm·s−1, 11.4 J·mm−0.5·s−0.5) is not plotted because the laser condition would not provide the melting under the thermal conduction mode under which DED is applicable. In both the figures, the relative density increased with increasing the simplified energy densities and saturated at around 0.97. Plotting the relative density against P·v−0.5·S−0.5 resulted in less variation in data points than plotting against P·v−1·S−1. To compare the variation quantitatively, the data points were regressed with the following bi-linear equation.
| \begin{equation}
y =
\begin{cases}
a(x - x_{0}) + b & \text{($x \leq x_{0}$)}\\
b & \text{($x > x_{0}$)}
\end{cases}
\end{equation}
| (3) |
where
y is the relative density,
x is the energy density.
a,
b,
x0 are the regression parameters. This equation assumes that the relative density increases linearly with increasing the energy density and saturates above the threshold energy density of
x0. The regression lines were shown using broken lines in
Fig. 10(a), (b). When the data were regressed against
P·
v−1·
S−1 and
P·
v−0.5·
S−0.5 by
eq. (3), the square of the determination coefficient (R
2), which is an indicator of consistency between
eq. (3) and the data, was 0.72 and 0.90, respectively. Thus, plotting against
P·
v−0.5·
S−0.5 resulted in higher R
2 values (higher consistency) than plotting against
P·
v−1·
S−1, indicating that
P·
v−0.5·
S−0.5 would be a better parameter for describing the change in the relative density with laser conditions (
P,
v, and
S).


In Fig. 10, all the data including the relative density of the samples melted under the keyhole mode or transition mode (P·v−0.5 = 11.4 J·mm−0.5·s−0.5) were plotted as functions of (a) P·v−1·S−1 and (b) P·v−0.5·S−0.5. When both P·v−1·S−1 and P·v−0.5·S−0.5 were used, R2 was reduced to 0.69 and 0.87, respectively. The P·v−1·S−1 of 2–4 J·mm−2 and P·v−0.5·S−0.5 of 25–35 J·mm−1·s−0.5 provided saturated relative density (the dense materials) under the thermal conduction mode but led to reduced relative density under the keyhole or transition mode. Therefore, both parameters were not appropriate for describing the change in the relative density with laser conditions under the keyhole or transition mode. Especially in the model of DED, the thermal conduction depth is used for describing the volume of the heat input region. The keyhole mode (or transition mode) heat transfer and gas entrapment are not considered in the model. Therefore, it is reasonable that P·v−0.5·S−0.5 is not applicable under the keyhole or transition mode.
Changes in melt pool arrangement and defect formation with S are schematically illustrated in Fig. 11. Under the thermal conduction mode, the melt pool size is determined by the balance between the heat input from laser irradiation and heat output due to the thermal condition. The balance is expressed in the linear correlation between the melt pool size and P·v−0.5. A wider S leads to the formation of the region at which the metal powder is not melted, resulting in forming lack-of-fusion defects. The formation of lack-of-fusion defects is described by using P·v−0.5·S−0.5 as shown in Fig. 9(b). By contrast, under the keyhole or transition mode, the pores are formed inside the melt track by the entrapment of the atmospheric gas. The formation of spherical pores exhibits less correlation with S because the entrapment is a phenomenon occurring in one melt track. Therefore, P·v−0.5·S−0.5 cannot describe the reduction in the relative density due to the formation of spherical pores. Other parameters will be required to describe the change in the relative density under the keyhole or transition mode.

Under a constant hatch spacing, the relative density tended to increase and then decrease with P·v−0.5 as shown in Fig. 7, which corresponds to the reduction in lack-of-fusion defects and formation of spherical pores, respectively (Fig. 4). King et al. reported that the DED normalized by the enthalpy of melting provides the threshold laser condition under which the dominant melting phenomenon changes from the thermal conduction mode to the keyhole mode.28) Limiting the phenomenon occurring in one melt track (fixed hatch spacing), P·v−0.5 would describe the changes in the relative density from lack-of-fusion to dense and from dense to the formation of spherical pores. It is recommended from this study that threshold laser power and scan speed from thermal conduction mode to keyhole (transition mode) are clarified using the P·v−0.5, and then the processing parameters including S are optimized using P·v−0.5·S−0.5 under the thermal conduction mode. In the case of this study, only the laser condition of P·v−0.5 = 11.4 J·mm−0.5·s−0.5 provide the keyhole or transition mode melting (Figs. 7 and 8). The relative density is plotted as a function of P·v−0.5·S−0.5 when the data for P·v−0.5 = 11.4 J·mm−0.5·s−0.5 is excluded (Fig. 9(b)). As a result, the optimized laser condition is in the range of P·v−0.5·S−0.5 = 25–35 J·mm−1·s−0.5.
4. Conclusions
In the present study, the relative density and melt pool morphology of L-PBF-fabricated Al–12Si alloy under various laser power (P), scan speed (v), and hatch spacing (S) were investigated to incorporate the effect of S on deposited energy density (simplified as P·v−0.5) which is a promising parameter for optimizing the laser conditions. The main conclusions are listed as follows.
-
(1)
The melt pool depth and width were almost independent of S and were proportional to P·v−0.5.
-
(2)
By considering the overlap of adjacent melt pool tracks, S−0.5 was multiplied to P·v−0.5, and P·v−0.5·S−0.5 was proposed as a new process index.
-
(3)
P·v−0.5·S−0.5 described the change in relative density with laser conditions from lack-of-fusion to dense better than the volumetric energy density.
-
(4)
Under the keyhole or transition mode melting, both the volumetric energy density and P·v−0.5·S−0.5 could not describe the change in the relative density with laser conditions. Another index should be used under the keyhole or transition mode melting.
Acknowledgments
The present work is supported by the Priority Research Project of Aichi Prefectural Government, “Knowledge Hub Aichi” and JSPS KAKENHI Grant Number JP22H05281 (Grant-in-Aid for Transformative Research areas).
REFERENCES
- 1) L.E. Murr, S.M. Gaytan, D.A. Ramirez, E. Martinez, J. Hernandez, K.N. Amato, P.W. Shindo, F.R. Medina and R.B. Wicke: J. Mater. Sci. Technol. 28 (2012) 1–14. doi:10.1016/S1005-0302(12)60016-4
- 2) W.E. King, A.T. Anderson, R.M. Ferencz, N.E. Hodge, C. Kamath, S.A. Khairallah and A.M. Rubenchi: Appl. Phys. Rev. 2 (2015) 041304. doi:10.1063/1.4937809
- 3) W.J. Sames, F.A. List, S. Pannala, R.R. Dehoff and S.S. Babu: Int. Mater. Rev. 61 (2016) 315–360. doi:10.1080/09506608.2015.1116649
- 4) D. Herzog, V. Seyda, E. Wycisk and C. Emmelmann: Acta Mater. 117 (2016) 371–392. doi:10.1016/j.actamat.2016.07.019
- 5) D. Eyers: Managing 3D printing: Operations Management for Additive Manufacturing, (Springer Nature, Berlin, 2020) pp. 53–55.
- 6) Y. Koizumi and M. Okugawa: ISIJ Int. 62 (2022) 2183–2196. doi:10.2355/isijinternational.ISIJINT-2022-184
- 7) T. Ishimoto, S. Wu, Y. Ito, S.-H. Sun, H. Amano and T. Nakano: ISIJ Int. 60 (2020) 1758–1764. doi:10.2355/isijinternational.ISIJINT-2019-744
- 8) S.-H. Sun, K. Hagihara and T. Nakano: Mater. Des. 140 (2018) 307–316. doi:10.1016/j.matdes.2017.11.060
- 9) N. Takata, M. Liu, H. Kodaira, A. Suzuki and M. Kobashi: Addit. Manuf. 33 (2020) 101152. doi:10.1016/j.addma.2020.101152
- 10) P. Van Cauwenbergh, V. Samaee, L. Thijs, J. Nejezchlebová, P. Sedlák, A. Iveković, D. Schryvers, B. Van Hooreweder and K. Vanmeensel: Sci. Rep. 11 (2021) 6423. doi:10.1038/s41598-021-85047-2
- 11) A. Suzuki, T. Miyasaka, N. Takata, M. Kobashi and M. Kato: Addit. Manuf. 48 (2021) 102383. doi:10.1016/j.addma.2021.102383
- 12) X. Qi, N. Takata, A. Suzuki, M. Kobashi and M. Kato: Addit. Manuf. 35 (2020) 101308. doi:10.1016/j.addma.2020.101308
- 13) W. Wang, N. Takata, A. Suzuki, M. Kobashi and M. Kato: Intermetallics 125 (2020) 106892. doi:10.1016/j.intermet.2020.106892
- 14) T. Nakano, T. Ishimoto, R. Ozasa and A. Matsugaki: J. Japan Thermal Spray Soc. 58 (2021) 121–128. doi:10.11330/jtss.58.121
- 15) I. Yadroitsev, I. Yadroitsava, A. Du Plessis and E. MacDonald: Fundamentals of Laser Powder Bed Fusion of Metals, (Elsevier, Amsterdam, 2021) pp. 349–376.
- 16) A. Suzuki, T. Miyasaka, N. Takata and M. Kobashi: J. JILM 72 (2022) 164–171. doi:10.2464/jilm.72.164
- 17) T. Kimura and T. Nakamoto: J. JILM 66 (2016) 167–173. doi:10.2464/jilm.66.167
- 18) E. Liverani, S. Toschi, L. Ceschini and A. Fortunato: J. Mater. Process. Technol. 249 (2017) 255–263. doi:10.1016/j.jmatprotec.2017.05.042
- 19) H. Gong, K. Rafi, B.H. Gu, T. Starr and B. Stucker: Addit. Manuf. 1–4 (2014) 87–98. doi:10.1016/j.addma.2014.08.002
- 20) Y. Bai, Y. Yang, D. Wang and M. Zhang: Mater. Sci. Eng. A 703 (2017) 116–123. doi:10.1016/j.msea.2017.06.033
- 21) G. Casalino, S.L. Campanelli, N. Contuzzi and A.D. Ludovico: Opt. Laser Technol. 65 (2015) 151–158. doi:10.1016/j.optlastec.2014.07.021
- 22) S. Wang, J. Ning, L. Zhu, Z. Yang, W. Yan, Y. Dun, P. Xue, P. Xu, S. Bose and A. Bandyopadhyay: Mater. Today 59 (2022) 133–160. doi:10.1016/j.mattod.2022.08.014
- 23) M. Giovagnoli, G. Silvi, M. Merlin and M. Giovanni: Mater. Sci. Eng. A 802 (2021) 140613. doi:10.1016/j.msea.2020.140613
- 24) L. Lan, W. Wang, Z. Cui, X. Hao and D. Qiu: J. Mater. Sci. Technol. 129 (2022) 228–239. doi:10.1016/j.jmst.2022.04.020
- 25) K. Hukpati, A. Eliasu, F. Tetteh, A. Czekanski and S. Boakye-Yiadom: Mater. Sci. Eng. 853 (2022) 143710. doi:10.1016/j.msea.2022.143710
- 26) U.S. Bertoli, A.J. Wolfer, M.J. Matthews, J.P.R. Delplanque and J.M. Schoenung: Mater. Des. 113 (2017) 331–340. doi:10.1016/j.matdes.2016.10.037
- 27) D.B. Hann, J. Iammi and J. Folkes: J. Phys. D 44 (2011) 445401. doi:10.1088/0022-3727/44/44/445401
- 28) W.E. King, H.D. Barth, V.M. Castillo, G.F. Gallegos, J.W. Gibbs, D.E. Hahn, C. Kamath and A.M. Rubenchik: J. Mater. Process. Technol. 214 (2014) 2915–2925. doi:10.1016/j.jmatprotec.2014.06.005
- 29) A. Suzuki, R. Nishida, N. Takata, M. Kobashi and M. Kato: Addit. Manuf. 28 (2019) 160–168. doi:10.1016/j.addma.2019.04.018
- 30) K. Aoyagi, H. Wang, H. Sudo and A. Chiba: Addit. Manuf. 27 (2019) 353–362. doi:10.1016/j.addma.2019.03.013
- 31) Q. Liu, W. Moses, J. Paul, P. He, Z. Peng, B. Gludovatz, J.J. Kruzic, C.H. Wang and X. Li: Acta Mater. 201 (2020) 316–328. doi:10.1016/j.actamat.2020.10.010
- 32) Y. Yanase, H. Miyauchi, H. Matsumoto and K. Yokota: Mater. Trans. 63 (2022) 176–184. doi:10.2320/matertrans.MT-M2021215
- 33) A. Suzuki, Y. Shiba, H. Ibe, N. Takata and M. Kobashi: Addit. Manuf. 59 (2022) 103089. doi:10.1016/j.addma.2022.103089
- 34) M. Liu, T. Wada, A. Suzuki, N. Takata, M. Kobashi and M. Kato: Crystals 10 (2020) 1007. doi:10.3390/cryst10111007
- 35) X. Liu, T. Wada, A. Suzuki, N. Takata, M. Kobashi and M. Kato: Mater. Des. 199 (2021) 109416. doi:10.1016/j.matdes.2020.109416
