Abstract
High entropy alloys (HEAs) are a novel class of materials that have emerged as potential candidates for various industrial applications due to their excellent mechanical properties at cryogenic, ambient, elevated temperatures, and even under a hydrogen environment. The incorporation of nanocrystalline (nc) structure into HEAs has attracted significant attention for the further enhancement of their exceptional properties, as exceptional grain refinement usually results in enhanced strength without a large expense of ductility. High-pressure torsion (HPT) is often considered one of the most efficient methods for nanocrystallization, and this also holds true for HEAs. Recently, nanoindentation technique has been widely utilized to explore the relationship between HPT-induced grain refinement and mechanical behavior due to the inhomogeneous microstructure within the HPT disk. In this report, recent nanoindentation studies performed on HPT-processed HEAs are comprehensively reviewed with special emphasis on the nanomechanical behavior of nc HEAs.

1. Introduction
High entropy alloys (HEAs) are a new member of structural materials introduced in 2004,1,2) which were defined originally as alloys consisting of at least five principal elements in (near-)equiatomic compositions. Recently, the concept of HEAs has been extended to an alloy with 2 to 4 principal elements, which is usually referred to as medium-entropy alloys (MEAs) having configurational entropy in the range of 0.69R–1.61R (where R is the molar gas constant).3–5) Due to the relatively high configurational entropy, M/HEAs often exhibit a simple solid solution phase having body-centered cubic (BCC),6,7) face-centered cubic (FCC)8,9) or hexagonal close-packed (HCP) structures.10,11) M/HEAs possess (1) an outstanding combination of strength and ductility,12–14) (2) high resistance to corrosion,15,16) hydrogen embrittlement,17,18) wear,19,20) and fatigue,21,22) and (3) excellent strength retention at cryogenic and elevated temperatures.9,23–25) These exceptional properties of M/HEAs could be further improved by tailoring the microstructure (e.g., introducing multiple phases,26,27) short-range ordering,28–30) or refined microstructure31–33)).
Since the grain boundaries (GBs) are a representative example of the defects controllable in an easy and obvious manner, grain refinement might be the most effective way to improve the mechanical strength according to the so-called Hall-Petch relation:34,35)
| \begin{equation}
\sigma = \sigma_{0} + k_{\textit{HP}}d^{-0.5}
\end{equation}
| (1) |
where σ is the strength for either yielding (σ
y) or plastic flow (σ
f), σ
0 is the friction stress that is free from GB contributions,
d is grain size, and
kHP is a material constant that is often referred to as the locking parameter or Hall–Petch coefficient. In addition, considering that the
kHP value of HEAs, particularly for the FCC structured ones, was found to be significantly higher than for the conventional FCC metals, reducing
d to below ∼100 nm, i.e., within the nanocrystalline (nc) regime, this appears to be a promising approach for strengthening M/HEAs.
31,32,36,37)
At present, the application of severe plastic deformation (SPD) is known as the most effective ‘top-down’ strategy to achieve exceptional grain refinement in bulk coarse-grained (cg) materials.38–40) Although there are several conventional methods such as intensive rolling, fast forging, and shot peening for inducing high strain, the most known SPD processes that have received the most scientific and industrial attention include equal-channel angular pressing (ECAP),41) high-pressure torsion (HPT),42) and accumulative roll-bonding (ARB).43) This is primarily because the level of applied strain upon ECAP, HPT, and ARB can be continuously increased by repeating the procedure without considerably changing the overall dimensions of the workpieces. Compared with ECAP and ARB, HPT processing has the advantage of introducing higher accumulative strains and thus leading to an exceptional level of grain refinement.39,44–50) In fact, it was demonstrated that for several HEAs, the nc structure could be achieved from the very early stage of HPT, establishing the HPT processing as the most efficient way for exploiting the synergy between HEA and nc alloys.31,32,36,37) As a result, HPT processing has been used for improving the mechanical properties of several M/HEAs, such as CoCrFeMnNi,31,36) CoCrFeNi,51,52) Al0.3CoCrFeNi,32,53) Al0.5CoCrFeMnNi,54) AlCrFeCoNiNb,55) TiZrNbHfTa,37,56) AlFeCoNiCu,57) CrFe2NiMnV0.25,58) TiZrCrMnFeNi,59) AlTiFeCoNi,60) AlTiFeCoNi–C61) and CoCrFeMnNi–C.62) More recently, the application of HPT has been extended to nonmetallic high-entropy materials, including high-entropy hydride MgTiVCrFe–H,63) high-entropy oxide TiZrHfNbTaO11,64) and high-entropy oxynitride TiZrHfNbTaO6N365) for investigating their potential applications in hydrogen-related industries. It is noteworthy that the hardness value of AlCrFeCoNiNb HEA increases to ∼1030 HV (or ∼10.9 GPa) after HPT-processing,55) which represents the highest hardness value reported among the aforementioned HEAs.
The equivalent strain imposed by the HPT process is inhomogeneously distributed across the HPT disk (which has generally a diameter of 10 mm and a thickness of approximately 0.8 mm) according to the relation:49,66)
| \begin{equation}
\varepsilon_{\textit{eq}} = \frac{1}{\sqrt{3}}\frac{2\pi Nr}{t_{D}}
\end{equation}
| (2) |
where
r is the distance from the disk center,
N is the number of HPT turns, and
tD is the thickness of the disk. Since the strain proportionally increases with
r, the microstructure and thus mechanical properties change within the 10-mm-diameter disk. Together with the limited sample size, such a local gradient makes the nanoindentation technique a strong tool for evaluating the mechanical properties of HTP-processed materials.
67) This is because nanoindentation testing has a simple and easy procedure and requires only a small volume of material. In addition, it has been reported that various mechanical properties beyond hardness and reduced modulus can be determined from the load (
P) versus displacement (
h) curves. Thus, there have been several studies reporting the use of nanoindentation testing for exploring the mechanical behavior of HPT-processed materials.
40,67) Accordingly, in this report the crucial results in nanoindentation studies to date are reviewed to provide insight into the effect of HPT-induced grain refinement on the deformation behavior of HEAs.
2. Fundamental Applications of Nanoindentation: Hardness and Elastic Modulus
The primary objective of the nanoindentation test is to estimate the hardness, HN, which is also useful for analyzing the effect of rate and temperature on the deformation behavior of a material as discussed below. The HN is determined as
| \begin{equation}
H_{N} = \frac{P_{\textit{max}}}{A_{c}}
\end{equation}
| (3) |
where
Pmax is the maximum load and
Ac is the projected contact area that is a geometrical function of the contact depth,
hc. Based on the Oliver-Pharr method,
68,69) the
HN value of a material can be extracted from the load-displacement (
P-
h) curve recorded during nanoindentation testing. For several HEAs, the nc structure can be obtained at the edge of the HPT disk even in the early stage of HPT processing.
31,70) Therefore, the mechanical behavior of nc HEAs can be systematically explored by performing nanoindentation tests on the edge regions of HPT disks.
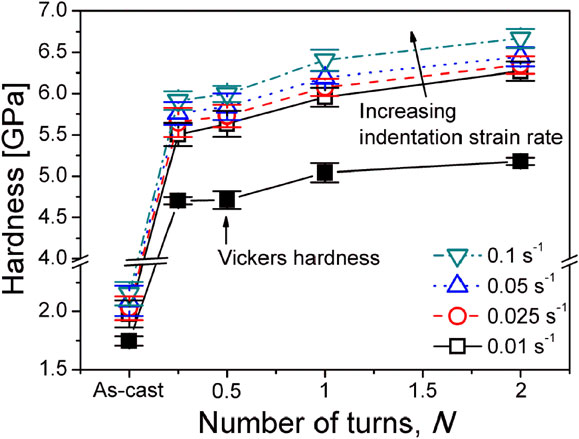
Figure 1 shows the variation in HN of CoCrFeMnNi HEA as a function of the number of HPT turns, N. Nanoindentation hardness remarkably increases in the early stages of the HPT process (N = 1/4 turn) and thereafter saturates toward the maximum values. Since HPT processing refined the grain size of CoCrFeMnNi HEA from an initial value of ∼40 µm to ∼40 nm without any phase transformation,31) HPT-induced hardening is mainly attributed to the grain refinement. It is also noteworthy that the tendency of the change in hardness is almost the same for the nanoindentation test and the microhardness test, but the higher values were recorded from nanoindentation tests compared with microhardness. This may be due to an indentation size effect (ISE) which is manifest as an increase in HN with decreasing h for a sharp indentation.71,72)
From nanoindentation tests, it is also possible to estimate the critical resolved shear stress required to operate plastic flow across the GB, τc, based on the dislocation pile-up model as:73)
| \begin{equation}
k_{\textit{HP}} = 3M(\pi m_{s}\tau_{c}Gb/2\alpha)^{1/2}
\end{equation}
| (4) |
where
M is the Taylor factor (taken as 3.06 for FCC),
ms is Sachs orientation factor (2.2378
74)),
G is the shear modulus,
b is the magnitude of the Burgers vector, α is the average dislocation character obtained by α = 2(1 − ν)/(2 − ν) (ν is Poisson’s ratio). Using
eq. (4), the τ
c value can be estimated from the
HN versus
d−1/2 plot whose slope indicates
kHP. For example, it was reported for FCC structured CoCrFeNi MEA processed by HPT.
52) Figure 2 shows the variation in
HN as a function of
d−1/2 under different indentation strain rates,
$\dot{\varepsilon }_{i} = h^{ - 1}(dh/dt)$.
52) For all
$\dot{\varepsilon }_{i}$,
HN versus
d−1/2 plots are exactly following the Hall-Petch relation and the estimated values of
kHP for the MEA are within the range of ∼32.2–33.4 MPa(mm)
1/2, which are similar to the values for CoCrFeMnNi HEA (∼27.7 MP(mm)
1/2 31)). Using
eq. (4) and the
kHP values obtained from
Fig. 2, the τ
c values are calculated and summarized in
Table 1. The values of τ
c for the HEA were determined as ∼138–149 MPa, which are much higher than those reported for pure FCC metals (e.g. 21.9 MPa for Cu and 36.7 MPa for Ni
75)), suggesting that the GB strengthening is more significant in FCC M/HEAs than in conventional FCC metals.


The significant GB strengthening in FCC M/HEAs is often attributed to the severe lattice distortion, which results in high Peierls stress.76) It is also noteworthy that the kHP values obtained from Fig. 2 are obviously higher than the kHP value (∼21.8 MP(mm)1/2) reported for the CoCrFeMnNi HEA of which grain size was controlled through heat treatments. This discrepancy could be due to the fact that the Hall-Petch plot in Fig. 2 was analyzed without taking into account the effect of dislocation hardening. During HPT processing, a large number of dislocations can accumulate and hence further contribute to HPT-induced hardening as followed by Taylor equation ($\sigma_{Taylor} = \alpha MGb\sqrt{\rho } $, where ρ is dislocation density).77–80) Therefore, it should be noted that the kHP values presented in Fig. 2 and Table 1 might be overestimated due to the lack of consideration of dislocation hardening.
Recently, there have been several attempts to fabricate nanocomposites by performing the HPT processing on dual-phase HEAs (such as Al0.7CoCrFeNi)81) or two disks of HEAs with different phases.82) For example, Taheriniya et al.82) produced an FCC CoCrFeMnNi and BCC HfNbTaTiZr nanocomposite via HPT processing (Fig. 3(a)–3(e)) and reported that the microhardness of the composite was found to be superior to the HPT deformed single-phase matrices after the same number of revolutions, i.e., the imposed ideal shear strains (Fig. 3(f)). To gain an insight on the hardness distribution within the constituent phases, high resolution-high speed nanoindentation mapping was employed for the nanocomposite and the results are displayed in Fig. 4.82) As shown in Fig. 4(a), two distinct phases are clearly identified by the cluster maps and, more importantly, the average values of hardness for Phase 1 (i.e., FCC phase) and Phase 2 (i.e., BCC phase) gradually increase with increasing numbers of HPT turns. In addition, the hardness intensity maps in Fig. 4(b) clearly revealed that a significant increase in hardness was observed in Phase 2 near the interphase boundary, in which deformation-induced dislocation accumulation and element migration occurred.82)


Similarly, Gao et al.81) carried out nanoindentation on an HPT-processed dual-phase Al0.7CoCrFeNi HEA for exploring the contribution of constituent phases to its overall strength. Since the BCC/B2 phases (especially in HPT-processed samples) are too small to be directly indented, the authors suggested the protocol to estimate the hardness of only BCC/B2 phase from the hardness of FCC + BCC/B2 mixture, which is schematically illustrated in Fig. 5(a). As shown in the inset of Fig. 5(a), the indentation impressions produced at Pmax = 10 mN include both FCC and BCC/B2 phases. Therefore, the tests with Pmax = 5 mN were additionally performed on only the FCC phase. Since the HN obtained from FCC + BCC/B2 (i.e., HN at Pmax = 10 mN) cannot be directly compared with the HN obtained from the FCC phase (i.e., HN at Pmax = 5 mN) due to ISE, HN should be converted to the size-independent, mascroscopic hardness, H0 using the Nix-Gao model:71)
| \begin{equation}
H_{N}^{2} = H_{0}^{2}\left(1 + \frac{h^{*}}{h} \right)
\end{equation}
| (5) |
where
h* is a material length scale for
h-dependent
HN. With the
HN versus
h plot recorded during nanoindentation,
eq. (5) enables us to estimate
H0 of FCC + BCC/B2 and FCC phases, referred to as
H0,all and
H0,F, respectively (
Fig. 5(a)). Then,
H0 of the BCC/B2 phase,
H0,B, can be determined by using the simple rule-of-mixtures:
| \begin{equation}
H_{0,B} = \frac{H_{0,\textit{all}} - H_{0,F}X_{F}}{1 - {X_{F}}}
\end{equation}
| (6) |
where
XF is the fraction of FCC phase within the indentation-induced plastic zone volume. Since the radius of the plastic zone during indentation (
rp) is actually larger than the visible triangular impression,
rp should be considered while calculating the
XF value. According to Johnson’s expanding-cavity-based model,
83) rp can be estimated as:
| \begin{align}
r_{p} &= h_{c}\,\mathit{cot}(90^{\circ} - \theta) \bigg\{ \frac{1}{6(1 - \nu)} \bigg[\frac{E}{\sigma_{y}}\tan (90^{\circ} - \theta) \\
&\quad + 4(1 - 2\nu) \bigg] \bigg\}^{1/3}
\end{align}
| (7) |
where θ is the half-cone angle to the surface (70.3° for Berkovich indenter) and σ
y is the yield strength (∼701 MPa
84)). By drawing the circle with calculated
rp surrounding each indentation, the
XF values can be calculated on the basis of a comparison of SEM images taken prior to and after nanoindentation. From the above process, the remaining value of
H0,B can be finally obtained from
eq. (7).
Figure 5(b) shows the variations in
H0 of each phase as a function of
N. For clarifying the HPT-induced hardening, the hardening ratio, which is the hardness change divided by the original hardness, for each phase was summarized in
Fig. 5(c). It can be seen that the hardening due to HPT is significant in both the FCC and BCC/B2 phases, but the hardening ratio of the FCC phase is always higher than that of the BCC/B2 phase. The above results imply that the nanoindentation technique can be utilized to decouple the distinct role of constituent phases in the mechanical behavior of nanocomposite HEAs.
In addition to the hardness, nanoindentation testing can be used to determine the elastic modulus from the P-h curve through the relation:68,69)
| \begin{equation}
S = \beta \frac{2}{\sqrt{\pi}}E_{r}\sqrt{A_{c}}
\end{equation}
| (8) |
where
S is stiffness, β is a dimensionless parameter, and
Er is the reduced modulus defined by
| \begin{equation}
\frac{1}{E_{\textit{eff}}} = \frac{1 - \nu_{s}^{2}}{E_{s}} + \frac{1 - \nu_{i}^{2}}{E_{i}}.
\end{equation}
| (9) |
The subscripts “s” and “i” denote the sample and indenter. Maier-Kiener
et al.85) explored the evolution of hardness and elastic modulus of HPT-induced nc CoCrFeMnNi HEA upon post-process heat treatment. For 1 h isochronal annealing, the hardness of the nc HEA gradually increases with annealing temperature,
TA, and reaches a maximum value of ∼7.64 GPa at
TA = 550°C, beyond which it decreases to ∼2.2 GPa for
TA > 800°C (
Fig. 6). Similarly, the modulus of nc HEA first increases to a maximum of 252 GPa at
TA = 550°C, but remains fairly constant up to
TA = 700°C. Afterwards, the modulus decreases significantly for
TA > 800°C. A detailed microstructural analysis by Schuh
et al.36) reported that nano-scale precipitates (NiMn-, FeCo, and Cr-rich phases) formed in the primary single-phase matrix of nc CoCrFeMnNi HEA after annealing at 450°C for 1 h. The annealing at intermediate temperature (i.e., 550°C <
TA < 800°C) led to coarsening of the FCC HEA matrix, but the secondary phases were still present at GBs and triple junctions.
36) On this basis, a sudden increase in hardness and modulus at
TA = 450°C could be attributed to the formation of secondary phases. For 550°C <
TA < 800°C, hardness starts to decrease due to the grain growth, whereas the modulus is unaffected by grain size and therefore remains high. For
TA > 800°C, the modulus drops significantly and converges to that for the nc HEA before annealing. This can be directly correlated to a complete dissolution of the nanophases and restoration of the single phase, as reported by previous microstructural analyses.
36) Thus, the change in elastic modulus, rather than the change in hardness, can be directly related to the formation of additional phases during annealing. These results imply that nanoindentation of nc HEAs is a powerful tool to detect phase decomposition, which can also be used to qualitatively predict the long-term stability of single-phase HEAs.
3. Stress-Strain Response for Plastic Flow
Since a sharper indenter induces a larger elasto-plastic strain in the material,86,87) a series of nanoindentation tests with numerous triangular pyramidal indenters having different “sharpness” that can be determined by centerline-to-face angle, ψ, makes it possible to estimate the constitutive stress-strain behavior of a local region within HPT-processed HEAs. This allows for systematic analysis of the effects of grain size on the stress–strain response and thus the constitutive behavior of HPT-processed HEAs. Such an example can be found in Lee et al.88) that explored the effect of annealing treatment on plastic flow in HPT-processed CoCrFeMnNi HEA. Figure 7 shows the variations in hardness (H) as a function of ψ (i.e., the sharpness of pyramidal indenter) for the HPT-processed CoCrFeMnNi HEA before (HPT) and after annealing treatment at 723 K for 1 h (HPT+1A) and 10 h (HPT+10A). For comparison purposes, the corresponding H versus ψ plot for the as-cast sample is also displayed in Fig. 7. As mentioned earlier, the indentations made with different ψ lead to different levels of plastic strain (so-called as characteristic strain, εchar) which can be described as89)
| \begin{equation}
\varepsilon_{\textit{char}} = 0.2\sqrt{\frac{\pi}{3\sqrt{3}}}\cot \psi
\end{equation}
| (10) |
In addition, the
H value obtained from each sharp indenter can be converted into corresponding flow stresses, σ
f, by using Tabor’s well-known empirical relationship
90)
| \begin{equation}
\sigma_{f} = \frac{H}{C_{\psi}}
\end{equation}
| (11) |
where
Cψ is the constraint factor. Although the value of
Cψ is typically in the range of 2.6–3.0 for metallic materials in the fully plastic regime of indentations, it strongly depends on ψ in the elasto-plastic regime:
89)
| \begin{equation}
C_{\psi} = \frac{2}{3}\left[2 + \mathit{ln}\left(\frac{1}{3}\frac{E}{\sigma_{y}}\sqrt{\frac{\pi}{3\sqrt{3}}} \cot \psi \right) \right]
\end{equation}
| (12) |
where
E and σ
y are elastic modulus and yield strength, respectively. Lee
et al.88) estimated σ
y value for each condition using nanoindentation data obtained from ψ = 85°. Since sharp indenter with ψ = 85° can apply substantially low ε
char (∼ 0.014), it is reasonable to assume that the corresponding σ
f is close to σ
y, details of which are provided in Ref.
88).
Table 2 shows a summary of the
Cψ values calculated by
eq. (12) for each condition. If the calculated
Cψ is higher than 3,
Cψ = 3 was adopted instead of the calculated one, based on the assumption that a fully-plastic regime begins at
Cψ = 3.
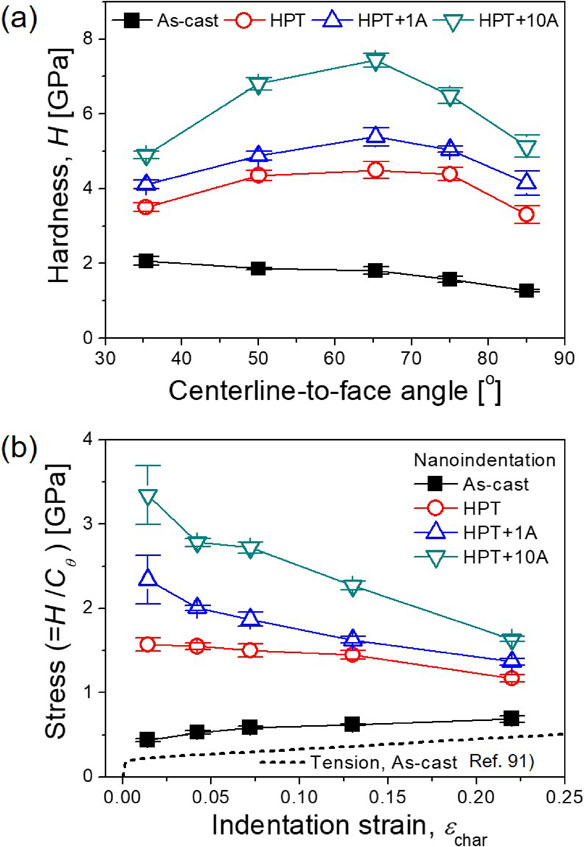

With eq. (10)–(12) and Table 2, H vs. ψ data in Fig. 7(a) can be successfully converted into stress vs. strain plots as shown in Fig. 7(b), where the tensile stress-strain curve for the as-cast HEA is also shown. Except for a slight discrepancy in stress, which may be due to the ISE, the derived the trend of stress change with respect to strain (or strain-hardening behavior) of the as-cast HEA sample agrees well with tensile results.91) It is interesting to find that the CoCrFeMnNi exhibits a transition from strain-hardening to strain-softening as grain size reduces from ∼40 µm (i.e., as-cast sample) to ∼40 nm (HPT sample). Similar to conventional nc metals and alloys, an extensive dynamic recovery, dynamic recrystallization, and the existence of residual internal stress in GBs could be considered as the possible mechanisms for the strain-softening phenomena in nc CoCrFeMnNi HEA. Figure 7(b) also revealed that the quantity of strain-softening increases with the annealing time, indicating that an additional mechanism may be activated for the annealed HPT samples. Considering that the fractions of annealing-induced second phases (especially for the intermetallic NiMn and FeCo phases) were reduced with increasing εchar, the deformation-assisted dissolution of the intermetallic phases could be the reason for the severe strain-softening behavior in the annealed HPT samples. The deformation-assisted destabilization of the second phases can be explained by taking into account the increase in the interface energy resulting from the dislocation accumulation and friction at the site.
4. Rate-Dependent Plasticity: Estimation of Deformation Mechanism
The rate-dependent plasticity such as strain-rate sensitivity and activation volume permits a better understanding of thermally-activated plastic deformation mechanisms. Nanoindentation testing offers the advantage of being able to analyze the rate-dependent plasticity with reliability, since it can quickly generate a large amount of data and hence statistical analysis is feasible. Strain-rate sensitivity (m) and activation volume (V*) can be estimated by nanoindentation tests in two different methods: multiple constant strain-rate (CSR) tests and single strain-rate jump (SRJ) tests. With the empirical relation between the uniaxial strain rate $\dot{\varepsilon }$ and the indentation strain rate $\dot{\varepsilon }_{i}$ (i.e., $\dot{\varepsilon } \approx \beta \dot{\varepsilon }_{i}$, where β is constant92,93)), m and V* values can be expressed at a given strain, ε, and temperature, T, by
| \begin{equation}
m = \left( \frac{\partial\,\mathit{ln}\,\sigma_{f}}{\partial\,\mathit{ln}\,\dot{\varepsilon}} \right)_{\varepsilon,T} {}= \left(\frac{\partial\,\mathit{ln}(H/C_{\psi})}{\partial\,\mathit{ln}(\beta \dot{\varepsilon}_{i})} \right)_{\varepsilon,T}
\end{equation}
| (13) |
and
| \begin{equation}
V^{*} = \sqrt{3} kT \left(\frac{\partial\,\mathit{ln}\,\dot{\varepsilon}}{\partial \sigma_{f}} \right)_{\varepsilon,T}{}\approx \sqrt{3}kT \left(\frac{\partial\,\ln (\beta \dot{\varepsilon}_{i})}{\partial (H/C_{\psi})} \right)_{\varepsilon,T},
\end{equation}
| (14) |
where
k is Boltzmann’s constant. Note that
Cψ and β are often taken as ∼3 and ∼0.01, respectively, but they may vary with the material and loading condition.
91,93) Therefore,
m and
V* values can be determined from the slope of a ln(
H/
Cψ) versus ln(
$\dot{\varepsilon }_{i}$) plot and the slope of the ln(
$\dot{\varepsilon }_{i}$) versus
H/
Cψ plot, respectively. An example is shown in
Fig. 8 that provides the variations in
m and
V* of CoCrFeMnNi HEA as a function of HPT turns.
31)

As shown in Fig. 8(a), the HPT process has a substantial effect on these rate-sensitive parameters, suggesting that the predominant deformation process in the HEA could be transformed by grain refinement. To better understand the effect of grain refinement on the deformation mechanism of HEAs, the m and V* values of HEAs from the literature31,52,94–104) are plotted as a function of grain size, d, in Fig. 9. For comparison purposes, the literature data for pure Ni and binary Ni alloys105–113) are also present in Fig. 9. The m and V* for those alloys are summarized in Table 3. Note that only the results for FCC HEAs are included in Fig. 9, since the variation in m value with d in BCC and HCP HEAs has not been extensively examined. For example, González-Masís et al.56) investigated the rate-dependent plasticity in the HPT-processed Ti–Nb–Zr–Ta–Hf system through nanoindentation technique. However, the effect of element addition rather than the effect of grain size on strain-rate sensitivity was mainly focused in their work; m value tends to decrease with increasing the number of elements (m ∼ 0.011 for TiNb and m ∼ 0.006 for TiNbZrTaHf).56)


For clarity, all the data in Fig. 9 are grouped into two separate ranges of d, i.e., ∼5–100 nm (nc range) and ∼4–200 µm (cg range). In the nc regime, the m values for FCC HEAs (∼0.016–0.07) are comparable to that for pure Ni (∼0.010–0.055), whereas in the cg regime, the m values show a significant discrepancy (∼0.007–0.06 for HEAs vs. ∼0.002–0.005 for Ni). These results indicate that the deformation mechanisms in nc HEAs and nc Ni are similar, whereas the deformation mechanism in cg HEA is considerably distinct from that in cg Ni. A similar conclusion can also be drawn from V* versus d plots in Fig. 9(c) and 9(d). The V* values for the conventional cg FCC metals and alloys are typically in the range of ∼100–1000 b3, corresponding to the dislocation forest cutting mechanism,114,115) as shown in Fig. 9(d). On the other hand, cg FCC HEAs exhibit significantly lower V* values (usually in the range of ∼10–100 b3), indicating that the short-range of barriers, which are responsible for thermal-activated deformation,105,114) are predominant. This might be due to the fact that HEAs have high lattice friction stress and hence the Peierls barrier to dislocation motion is much stronger than conventional FCC metals.97,116) In addition, the existence of chemical short-range ordering in the HEAs, which has been confirmed theoretically and/or experimentally,29–31) may also be responsible for its high friction stress and thus contribute to the low V* values in the cg HEAs.97,102,116) By contrast, the V* values for nc fcc HEAs and nc fcc metals are around ∼10 b3, suggesting that the deformation mechanism in the nc fcc HEAs is GB-mediated dislocation activity (e.g., dislocation nucleation and/or dislocation depinning at GBs105,106)) as in the conventional nc FCC metals. Thus, it is concluded that the rate-limiting deformation mechanism in FCC HEAs transforms from lattice atoms-dislocation interaction to GB-mediated plasticity as the d is reduced to nc regime.
5. Temperature-Dependent Plasticity: Estimation of Activation Energy
Since all mechanical properties such as H, m, and V* are highly dependent on testing temperature, nanoindentation tests at various temperatures can provide crucial information for high-temperature (HT) applications of HEAs. Figure 10 shows the HT nanoindentation results obtained from CoCrFeMnNi HEAs with cg and HPT-processed nc structures.117) As expected, HN of both nc and cg HEAs decreases with increasing T, but the slope of the ln(HN) versus 1/T plot is significantly changed at ∼473 K only for nc HEA (Fig. 10(a)). A similar transition can also be captured in the variation in m as a function of T (Fig. 10(b)); the value of m remains nearly constant (∼0.015) up to 423 K, then increases abruptly from 473 K onwards with T. Although sudden changes in HN and m values at ∼473 K indicate a possible transition in the deformation mechanism of nc HEA, it is challenging to confirm this mechanistic transition due to the lack of any substantial change in V* across the whole examined T range (Fig. 10(c)). These tendencies are in a good agreement with the data reported by Maier-Kiener et al.,98) despite a slight discrepancy in absolute values. Therefore, an investigation of the apparent activation energy, Q, is essential for a complete understanding of the thermally-activated deformation process. According to the Boltzmann-type constitutive law for temperature-dependent plastic strain rate, $\dot{\varepsilon } = \dot{\varepsilon }_{0} \textit{exp}( - \frac{Q}{kT})$, where $\dot{\varepsilon }_{0}$ is a pre-exponential constant and the barrier Q is described as the stress-dependent Gibbs free energy $\Delta \mathcal{G}$ for the activation of deformation. Considering that the entropy for deformation tends to be ignored due to its extremely small value, $\Delta \mathcal{G}$ is often assumed to be equal to the apparent activation enthalpy, $\Delta \mathcal{H}$.115,118) Then, $\Delta \mathcal{H}$ can be expressed as:115,118)
| \begin{equation}
\Delta \mathcal{H} = \frac{HV^{*}}{\sqrt{3}C_{\psi}}\frac{\partial (\mathit{ln}\,H)}{\partial (1/T)}
\end{equation}
| (15) |
Using
eq. (15) and the
T-dependent
H data shown in
Fig. 10(a), the
$\Delta \mathcal{H}$ for nc CoCrFeMnNi HEA at each testing temperature can be determined, and the change in
$\Delta \mathcal{H}$ with
T is displayed in
Fig. 10(d). For
T ≤ 473 K (∼ 0.3
Tm), nc CoCrFeMnNi HEA shows a relatively low
$\Delta \mathcal{H}$ value (∼0.5 eV). Since the activation barrier for the GB-mediated dislocation activities such as the emission of partial or perfect dislocations from GBs is expected as ∼0.7–1 eV,
105,119,120) the plastic deformation in nc CoCrFeMnNi HEA below a
T of 473 K may be primarily governed by such a mechanism. For
T > 473 K, however,
$\Delta \mathcal{H}$ of nc CoCrFeMnNi HEA abruptly increases to ∼1.8 eV. This relatively high
$\Delta \mathcal{H}$ value is similar to that of GB diffusion of Ni in CoCrFeMnNi HEA (i.e., ∼2.3 eV
121)), suggesting that GB diffusion becomes pronounced for
T > 473 K. This can be rationalized by considering the large volume fraction of non-equilibrium GBs in HPT-processed nc HEA.
36) Thus, the sharp change in the deformation behavior of nc HEA observed for
T above 473 K can be attributed to the enhanced plasticity due to GB diffusion.
6. Room-Temperature Nanoindentation Creep Behavior
Due to the large fraction of non-equilibrium GBs in the HPT-processed HEAs, the diffusion-related process such as creep deformation could be enhanced in the alloys even at relatively low temperatures such as RT.70,103) Therefore, the research of creep behavior at RT is crucial for evaluating the mechanical robustness of HPT-processed HEAs in a continuous mechanical load environment. Among various nanoindentation creep testing methods, the most popular by far is the constant-load method; the sample is quasi-statically loaded to a predetermined peak load, then the load is held constant, and the increase in h with holding time, thold, is recorded. This popularity is simply due to its close resemblance of the procedure to that in the conventional uniaxial creep test. From the change in h with t data, the variation in σf (converted from H using eq. (11)) as a function of t can be obtained. To determine $\dot{\varepsilon }_{i} = (dh/dt)/h$ for the creep regime, the displacement rate (dh/dt) is often calculated by fitting the h versus thold plot with an empirical equation:122,123)
| \begin{equation}
h(t_{\textit{hold}}) = h_{0} + At_{\textit{hold}}^{\kappa} + Bt_{\textit{hold}}
\end{equation}
| (16) |
where
h0 is the indentation depth at load-hold at peak load, and
A,
B, and κ are fitting constants. The steady-state creep strain rate,
$\dot{\varepsilon }_{i,ss}$ and the applied stress, σ
f, are usually correlated via an empirical power-law creep equation
$\dot{\varepsilon }_{i,ss} \propto \sigma_{f}^{n}$, where
n is the creep stress exponent. Therefore, the
n value can be determined by log-log plotting of σ
f against
$\dot{\varepsilon }_{i,ss}$.
Although a sharp indenter like a three-sided pyramidal Berkovich indenter is widely used for nanoindentation creep test, some critical differences in data between indentation creep and uniaxial creep have been reported not only for conventional metals and alloys,123,124) but also for HEAs.70,103) For example, Yu et al.103) examined the creep resistance of HPT-processed Al0.1CoCrFeNi HEA by nanoindentation equipped with a Berkovich indenter. Figure 11(a) shows the h versus thold plots obtained at the points of different distances from the disk center (r = 0 mm, 3 mm, and 5 mm). The h versus thold curves are somewhat analogous to the early stages of the typical high-temperature creep curves, including both transient and steady-state creep regimes. The amount of creep displacement increases from 4.12 nm to 12.08 nm from the center (r = 0 mm) to the edge (r = 5 mm), implying that the creep deformation of the HEA is indeed enhanced by grain refinement. As shown in Fig. 11(b), however, the estimated n values (n ∼ 83 for r = 0 mm, n ∼ 41 for r = 3 mm, n ∼ 29 for r = 5 mm) are unreasonably high, so that it is difficult to identify the underlying mechanism of creep deformation. This implausible creep behavior might arise from some critical issues related to the sharp tip geometry. Detailed explanations for these issues are introduced elsewhere.124)

To solve the issues related to sharp tip geometry, Lee et al.70) employed a spherical indenter to explore the creep behavior of the HPT-processed CoCrFeMnNi HEA. In spherical indentation, εchar in eq. (10) can be quantified as $0.2\sqrt{2hR - h^{2}} /R$ where R is the radius of the spherical indenter. As demonstrated in the inset of Fig. 12(a) and 12(b), creep deformation occurs even at RT in both cg and nc HEAs and, more importantly, the amount of creep strain (εcreep = ε − ε0, where ε0 is the strain at the onset of creep) clearly increases as Pmax increases. To estimate the $\dot{\varepsilon }_{i}$ for the spherical indentation, εcreep versus thold curves were fitted according to Garofalo’s mathematical fitting equation,125)
| \begin{equation}
\varepsilon_{\textit{creep}} = I(1 - e^{-\Phi t_{\textit{hold}}}) + \chi t_{\textit{hold}}
\end{equation}
| (17) |
where
I,
Φ, and χ are fitting constants. By differentiating the fitted equation with respect to
thold, the variations in
$\dot{\varepsilon }_{i}$ can be obtained as a function of
thold. As shown in the main plots of
Fig. 12(a) and
12(b),
$\dot{\varepsilon }_{i}$ versus
thold curves of both cg and nc HEAs suggests the possibility of a close approach to the steady-state condition (or quasi-steady-state, QSS). Based on the variations in
$\dot{\varepsilon }_{i,ss}$ with σ
f (or
P/π
C(2
hR −
h2) in spherical indentation) seen in
Fig. 13,
n was calculated to be 1 for nc HEAs and 3 for cg HEAs, implying that the governing mechanism of creep deformation transforms from dislocation-mediated mechanisms to diffusion-related processes as
d reduces to within the nanoscale regime. Since the influence of GB diffusion on
$\dot{\varepsilon }_{i,ss}$ of nc HEAs is substantially larger than that of lattice diffusion, GB diffusion and its related deformation mechanisms, such as Coble creep, GB sliding, GB migration, and GB rotation, mainly dominate the creep deformation of nc HEA. In addition, the estimation of creep rate in FCC-structured nc HEA and its comparison with that in conventional nc metal with an fcc structure (i.e., Ni) demonstrated that the creep resistance of nc HEA is significantly enhanced by sluggish diffusion in the HEAs.
7. Investigation of Hydrogen Effect on Mechanical Behavior
For practical applications of nc HEAs developed with the aid of HPT, it is crucial to demonstrate that their prominent mechanical performance is preserved even under a harsh environment such as a hydrogen atmosphere. Since the susceptibility of materials to hydrogen embrittlement (HE) is strongly correlated with their microstructure, the large fraction of GBs in nc HEAs may lead to significantly different HE behavior compared to cg HEAs. To shed light on this, Zhao et al.126) investigated the hydrogen absorption and its effect on the hardness of two nc HEAs (i.e., CoCrFeNi and CoCrFeMnNi) and compared the results with those obtained from cg counterparts. As shown in Fig. 14(a), a clear increase in HN upon hydrogen charging is observed in all cases. Importantly, the percentage increase in HN is much smaller in both nc HEAs (∼7%) whereas it is substantial in cg samples (∼57% for CoCrFeMnNi and ∼29% for CoCrFeNi). On the basis of these results, it is reasonable to speculate that the effect of hydrogen on ductility/toughness may be weaker in nc HEA than in cg HEA. Insights into the possible reasons can be gained by analyzing the deformation mechanisms inferred through the V* values. For the uncharged samples, V* values in the nc HEAs are in the range of ∼11–18 b3, whereas V* of the cg samples varies between ∼22 and 70 b3 (Fig. 14(b)), which is consistent with the literature data in Fig. 9(c) and Table 3. On the other hand, V* values obtained on hydrogen-charged samples are always lower than those of the uncharged ones, implying that the absorbed hydrogen increases the lattice friction stress for dislocation motion. Such an enhancement in the friction stress inhibits dislocation mobility, leading to an increase in hardness with a reduction in V*, which might eventually enhance the alloy susceptibility to HE. Such a contribution, however, would be negligible in nc HEAs, since the deformation in nc HEAs is mainly dominated by GB-mediated plasticity rather than by lattice atoms-dislocation interaction, as deduced from the above analysis on V*. As noted from Fig. 5(b) and 5(c), a similar trend also could be observed in dual-phase Al0.7CoCrFeNi HEA; hydrogen-induced hardening is significantly reduced after HPT processing for both FCC and BCC/B2 phases. Interestingly, the FCC phase shows much stronger hydrogen-induced hardening than the BCC/B2 phase. This is because the FCC phase absorbs much more interstitial hydrogen than BCC/B2.127) In addition, the FCC phase is relatively softer than the BCC/B2 phase, making it more amenable to hydrogen-induced solid solution strengthening.87,128)

8. Conclusions
Due to the extremely high straining, HPT processing can achieve exceptional grain refinement from cg to nc in various HEAs. To gain insights into the relationship between refined microstructure and mechanical behavior of HPT-processed HEAs, the nanoindentation technique has been widely employed under a variety of strain-rate and temperature conditions, allowing for exploring various mechanical properties of the local regions within an HPT disk. This review mainly focused on the results of nanoindentation research on HPT-processed HEAs with the following aspects:
-
(1)
The calculated HN values of HEAs increase with increasing HPT turns, which is mainly due to GB strengthening. Especially for the HPT-fabricated nanocomposite HEAs, the distinct role of constituent phases in their mechanical behavior could be additionally investigated through nanoindentation testing. Nevertheless, analyzing the change in elastic modulus is more successful than examining the change in hardness for detecting the phase transformation during post-process annealing.
-
(2)
It is feasible to estimate the constitutive stress-strain behavior for the large plastic regime of HPT-processed HEAs by performing a series of nanoindentation tests with a variety of sharp tips having different sharpness. It was revealed that annealing treatment on the HPT-processed CoCrFeMnNi HEA resulted in a significant strain-softening behavior, which may be attributed to the deformation-induced dissolution of the intermetallic phase.
-
(3)
To investigate the rate-dependent plastic deformation which is related with enhancement in ductility of ufg and nc materials processed by HPT, the m and V* values can be estimated by using nanoindentation tests. The m and V* values obtained suggested that GB-mediated dislocation activities are the predominant deformation mechanism in HEAs as in the conventional nc metals and alloys.
-
(4)
Through high-temperature nanoindentation tests, it is possible not only to measure temperature-dependent HN data but also to completely understand a thermally-activated plastic deformation process through estimating the activation energy. In the nc CoCrFeMnNi HEA, the contribution of GB diffusion to plasticity became pronounced for T > 473 K (∼ 0.3Tm).
-
(5)
Due to the large fraction of non-equilibrium GBs in nc HEAs processed by HPT, creep deformation can occur even at RT. For exploring creep mechanisms, the spherical indentation creep test is more reliable than the sharp indentation creep test. Although the creep deformation of CoCrFeMnNi HEA could be promoted by HPT processing, the resistance to creep in the nc HEA is superior to that of conventional nc Ni.
-
(6)
To examine nc HEA behavior in harsh service environments, the hydrogen effects on their mechanical behavior have been investigated through nanoindentation experiments.
Acknowledgements
The work at Chungnam National University was supported in part by research fund of Chungnam National University, and in part by the National Research Foundation (NRF) grant funded by the Korean government (MSIT) (No. 2021R1A4A1031494). The work at Hanyang University was supported by the NRF grant funded by the MSIT (No. 2022R1A5A1030054). This study at Oregon State University was supported by the National Science Foundation of the United States under Grant No. CMMI-2051205. The work at the University of Southampton was supported by the European Research Council under ERC Grant Agreement No. 267464-SPDMETALS.
REFERENCES
- 1) J.-W. Yeh, S.-K. Chen, S.-J. Lin, J.-Y. Gan, T.-S. Chin, T.-T. Shun, C.-H. Tsau and S.-Y. Chang: Adv. Eng. Mater. 6 (2004) 299–303. doi:10.1002/adem.200300567
- 2) B. Cantor, I.T.H. Chang, P. Knight and A.J.B. Vincent: Mater. Sci. Eng. A 375–377 (2004) 213–218. doi:10.1016/j.msea.2003.10.257
- 3) D.B. Miracle and O.N. Senkov: Acta Mater. 122 (2017) 448–511. doi:10.1016/j.actamat.2016.08.081
- 4) Z. Li, S. Zhao, R.O. Ritchie and M.A. Meyers: Prog. Mater. Sci. 102 (2019) 296–345. doi:10.1016/j.pmatsci.2018.12.003
- 5) H. Wang, Z. Hu, J. Cao, S. Zhang, T. Cheng and Q. Wang: Met. Mater. Int. 28 (2022) 514. doi:10.1007/s12540-021-01057-9
- 6) S.Y. Chen, Y. Tong, K.K. Tseng, J.W. Yeh, J.D. Poplawsky, J.G. Wen, M.C. Gao, G. Kim, W. Chen, Y. Ren, R. Feng, W.D. Li and P.K. Liaw: Scr. Mater. 158 (2019) 50–56. doi:10.1016/j.scriptamat.2018.08.032
- 7) R. Wang, Y. Tang, Z. Lei, Y. Ai, Z. Tong, S. Li, Y. Ye and S. Bai: Mater. Des. 213 (2022) 110356. doi:10.1016/j.matdes.2021.110356
- 8) F. Otto, A. Dlouhý, C. Somsen, H. Bei, G. Eggeler and E.P. George: Acta Mater. 61 (2013) 5743–5755. doi:10.1016/j.actamat.2013.06.018
- 9) B. Gludovatz, A. Hohenwarter, D. Catoor, E.H. Chang, E.P. George and R.O. Ritchie: Science 345 (2014) 1153–1158. doi:10.1126/science.1254581
- 10) M. Feuerbacher, M. Heidelmann and C. Thomas: Mater. Res. Lett. 3 (2015) 1–6. doi:10.1080/21663831.2014.951493
- 11) K.M. Youssef, A.J. Zaddach, C. Niu, D.L. Irving and C.C. Koch: Mater. Res. Lett. 3 (2015) 95–99. doi:10.1080/21663831.2014.985855
- 12) Y.J. Zhou, Y. Zhang, Y.L. Wang and G.L. Chen: Mater. Sci. Eng. A 454–455 (2007) 260–265. doi:10.1016/j.msea.2006.11.049
- 13) S.S. Nene, M. Frank, P. Agrawal, S. Sinha, K. Liu, S. Shukla, R.S. Mishra, B.A. McWilliams and K.C. Cho: Mater. Des. 194 (2020) 108968. doi:10.1016/j.matdes.2020.108968
- 14) P. Agrawal, S. Gupta, S. Shukla, S.S. Nene, S. Thapliyal, M.P. Toll and R.S. Mishra: Mater. Des. 215 (2022) 110487. doi:10.1016/j.matdes.2022.110487
- 15) Y. Shi, B. Yang, X. Xie, J. Brechtl, K.A. Dahmen and P.K. Liaw: Corros. Sci. 119 (2017) 33–45. doi:10.1016/j.corsci.2017.02.019
- 16) Y. Shi, B. Yang, P.D. Rack, S. Guo, P.K. Liaw and Y. Zhao: Mater. Des. 195 (2020) 109018. doi:10.1016/j.matdes.2020.109018
- 17) Y. Zhao, D.-H. Lee, M.-Y. Seok, J.-A. Lee, M.P. Phaniraj, J.-Y. Suh, H.-Y. Ha, J.-Y. Kim, U. Ramamurty and J.-i. Jang: Scr. Mater. 135 (2017) 54–58. doi:10.1016/j.scriptamat.2017.03.029
- 18) K.E. Nygren, S. Wang, K.M. Bertsch, H. Bei, A. Nagao and I.M. Robertson: Acta Mater. 157 (2018) 218–227. doi:10.1016/j.actamat.2018.07.032
- 19) M.H. Chuang, M.H. Tsai, W.R. Wang, S.J. Lin and J.W. Yeh: Acta Mater. 59 (2011) 6308–6317. doi:10.1016/j.actamat.2011.06.041
- 20) J. Wang, Y. Chen, Y. Zhang, W. Dai, Q. Xu, W. Li and Y. Liu: Mater. Des. 212 (2021) 110277. doi:10.1016/j.matdes.2021.110277
- 21) M.A. Hemphill, T. Yuan, G.Y. Wang, J.W. Yeh, C.W. Tsai, A. Chuang and P.K. Liaw: Acta Mater. 60 (2012) 5723–5734. doi:10.1016/j.actamat.2012.06.046
- 22) Z. Tang, T. Yuan, C.W. Tsai, J.W. Yeh, C.D. Lundin and P.K. Liaw: Acta Mater. 99 (2015) 247–258. doi:10.1016/j.actamat.2015.07.004
- 23) J. Rackwitz, Q. Yu, Y. Yang, G. Laplanche, E.P. George, A.M. Minor and R.O. Ritchie: Acta Mater. 200 (2020) 351–365. doi:10.1016/j.actamat.2020.09.021
- 24) O.N. Senkov, J.M. Scott, S.V. Senkova, F. Meisenkothen, D.B. Miracle and C.F. Woodward: J. Mater. Sci. 47 (2012) 4062–4074. doi:10.1007/s10853-012-6260-2
- 25) C. Lee et al.: Acta Mater. 160 (2018) 158–172. doi:10.1016/j.actamat.2018.08.053
- 26) Y. Dong, X. Gao, Y. Lu, T. Wang and T. Li: Mater. Lett. 169 (2016) 62–64. doi:10.1016/j.matlet.2016.01.096
- 27) P. Shi, W. Ren, T. Zheng, Z. Ren, X. Hou, J. Peng, P. Hu, Y. Gao, Y. Zhong and P.K. Liaw: Nat. Commun. 10 (2019) 489. doi:10.1038/s41467-019-08460-2
- 28) J.B. Seol, J.W. Bae, J.G. Kim, H. Sung, Z. Li, H.H. Lee, S.H. Shim, J.H. Jang, W.S. Ko, S.I. Hong and H.S. Kim: Acta Mater. 194 (2020) 366–377. doi:10.1016/j.actamat.2020.04.052
- 29) L. Li, Z. Chen, S. Kuroiwa, M. Ito, K. Yuge, K. Kishida, H. Tanimoto, Y. Yu, H. Inui and E.P. George: Acta Mater. 243 (2023) 118537. doi:10.1016/j.actamat.2022.118537
- 30) Z. He, Y. Guo, L. Sun, H.-L. Yan, X. Guan, S. Jiang, Y. Shen, W. Yin, X. Zhao, Z. Li and N. Jia: Acta Mater. 243 (2023) 118495. doi:10.1016/j.actamat.2022.118495
- 31) D.-H. Lee, I.-C. Choi, M.-Y. Seok, J. He, Z. Lu, J.-Y. Suh, M. Kawasaki, T.G. Langdon and J.-i. Jang: J. Mater. Res. 30 (2015) 2804–2815. doi:10.1557/jmr.2015.239
- 32) Q.H. Tang, Y. Huang, Y.Y. Huang, X.Z. Liao, T.G. Langdon and P.Q. Dai: Mater. Lett. 151 (2015) 126–129. doi:10.1016/j.matlet.2015.03.066
- 33) P. Shi, Y. Zhong, Y. Li, W. Ren, T. Zheng, Z. Shen, B. Yang, J. Peng, P. Hu, Y. Zhang, P.K. Liaw and Y. Zhu: Mater. Today 41 (2020) 62–71. doi:10.1016/j.mattod.2020.09.029
- 34) E.O. Hall: Proc. Phys. Soc. B 64 (1951) 747–752. doi:10.1088/0370-1301/64/9/303
- 35) N.J. Petch: J. Iron Steel Inst. 174 (1953) 25–28.
- 36) B. Schuh, F. Mendez-Martin, B. Völker, E.P. George, H. Clemens, R. Pippan and A. Hohenwarter: Acta Mater. 96 (2015) 258–268. doi:10.1016/j.actamat.2015.06.025
- 37) B. Schuh, B. Völker, J. Todt, N. Schell, L. Perrière, J. Li, J.P. Couzinié and A. Hohenwarter: Acta Mater. 142 (2018) 201–212. doi:10.1016/j.actamat.2017.09.035
- 38) R.Z. Valiev and T.G. Langdon: Prog. Mater. Sci. 51 (2006) 881–981. doi:10.1016/j.pmatsci.2006.02.003
- 39) A.P. Zhilyaev and T.G. Langdon: Prog. Mater. Sci. 53 (2008) 893–979. doi:10.1016/j.pmatsci.2008.03.002
- 40) I.-C. Choi and J.-i. Jang: Adv. Eng. Mater. 22 (2020) 1900648. doi:10.1002/adem.201900648
- 41) V.M. Segal, V.I. Reznikov, A.E. Drobyshevskiy and V.I. Kopylov: Russ. Metall. 1 (1981) 99–105.
- 42) P.W. Bridgman: Phys. Rev. 48 (1935) 825–847. doi:10.1103/PhysRev.48.825
- 43) Y. Saito, N. Tsuji, H. Utsunomiya, T. Sakai and R.G. Hong: Scr. Mater. 39 (1998) 1221–1227. doi:10.1016/S1359-6462(98)00302-9
- 44) G. Sakai, K. Nakamura, Z. Horita and T.G. Langdon: Mater. Sci. Eng. A 406 (2005) 268–273. doi:10.1016/j.msea.2005.06.049
- 45) A. Hohenwarter, A. Bachmaier, B. Gludovatz, S. Scheriau and R. Pippan: Int. J. Mater. Res. 100 (2009) 1653–1661. doi:10.3139/146.110224
- 46) Y. Harai, K. Edalati, Z. Horita and T.G. Langdon: Acta Mater. 57 (2009) 1147–1153. doi:10.1016/j.actamat.2008.10.046
- 47) R. Pippan, S. Scheriau, A. Taylor, M. Hafok, A. Hohenwarter and A. Bachmaier: Annu. Rev. Mater. Res. 40 (2010) 319–343. doi:10.1146/annurev-matsci-070909-104445
- 48) T.G. Langdon: Acta Mater. 61 (2013) 7035–7059. doi:10.1016/j.actamat.2013.08.018
- 49) K. Edalati and Z. Horita: Mater. Sci. Eng. A 652 (2016) 325–352. doi:10.1016/j.msea.2015.11.074
- 50) S.A.H. Kahnooj, M. Vaseghi and M. Sameezadeh: Met. Mater. Int. 28 (2022) 2646. doi:10.1007/s12540-022-01173-0
- 51) J. Gubicza, P.T. Hung, M. Kawasaki, J.K. Han, Y. Zhao, Y. Xue and J.L. Lábár: Mater. Charact. 154 (2019) 304–314. doi:10.1016/j.matchar.2019.06.015
- 52) Y. Zhao, X. Wang, T. Cao, J.K. Han, M. Kawasaki, J.-i. Jang, H.N. Han, U. Ramamurty, L. Wang and Y. Xue: Mater. Sci. Eng. A 782 (2020) 139281. doi:10.1016/j.msea.2020.139281
- 53) Q.H. Tang, Y. Huang, H. Cheng, X.Z. Liao, T.G. Langdon and P.Q. Dai: Mater. Des. 105 (2016) 381–385. doi:10.1016/j.matdes.2016.05.079
- 54) T.S. Reddy, I.S. Wani, T. Bhattacharjee, S.R. Reddy, R. Saha and P.P. Bhattacharjee: Intermetallics 91 (2017) 150–157. doi:10.1016/j.intermet.2017.09.002
- 55) P. Edalati, A. Mohammadi, M. Ketabchi and K. Edalati: J. Alloy. Compd. 884 (2021) 161101. doi:10.1016/j.jallcom.2021.161101
- 56) J. González-Masís, J.M. Cubero-Sesin, A. Campos-Quirós and K. Edalati: Mater. Sci. Eng. A 825 (2021) 141869. doi:10.1016/j.msea.2021.141869
- 57) P. Edalati, A. Mohammadi, M. Ketabchi and K. Edalati: J. Alloy. Compd. 894 (2022) 162413. doi:10.1016/j.jallcom.2021.162413
- 58) H. Shahmir, E. Tabachnikova, A. Podolskiy, M. Tikhonovsky and T.G. Langdon: J. Mater. Sci. 53 (2018) 11813–11822. doi:10.1007/s10853-018-2456-4
- 59) P. Edalati, R. Floriano, A. Mohammadi, Y. Li, G. Zepon, H.W. Li and K. Edalati: Scr. Mater. 178 (2020) 387–390. doi:10.1016/j.scriptamat.2019.12.009
- 60) P. Edalati, R. Floriano, Y. Tang, A. Mohammadi, K. Danielle Pereira, A. Ducati Luchessi and K. Edalati: Mater. Sci. Eng. C 112 (2020) 110908. doi:10.1016/j.msec.2020.110908
- 61) P. Edalati, A. Mohammadi, Y. Tang, R. Floriano, M. Fuji and K. Edalati: Mater. Lett. 302 (2021) 130368. doi:10.1016/j.matlet.2021.130368
- 62) Y. Lu, A. Mazilkin, T. Boll, N. Stepanov, S. Zherebtzov, G. Salishchev, É. Ódor, T. Ungar, E. Lavernia, H. Hahn and Y. Ivanisenko: Materialia 16 (2021) 101059. doi:10.1016/j.mtla.2021.101059
- 63) M.O. de Marco, Y. Li, H.-W. Li, K. Edalati and R. Floriano: Adv. Eng. Mater. 22 (2020) 1901079. doi:10.1002/adem.201901079
- 64) P. Edalati, Q. Wang, H. Razavi-Khosroshahi, M. Fuji, T. Ishihara and K. Edalati: J. Mater. Chem. A 8 (2020) 3814–3821. doi:10.1039/C9TA12846H
- 65) P. Edalati, X.F. Shen, M. Watanabe, T. Ishihara, M. Arita, M. Fuji and K. Edalati: J. Mater. Chem. A 9 (2021) 15076–15086. doi:10.1039/D1TA03861C
- 66) R.Z. Valiev, Y.V. Ivanisenko, E.F. Rauch and B. Baudelet: Acta Mater. 44 (1996) 4705–4712. doi:10.1016/S1359-6454(96)00156-5
- 67) M. Kawasaki, B. Ahn, P. Kumar, J.-i. Jang and T.G. Langdon: Adv. Eng. Mater. 19 (2017) 1600578. doi:10.1002/adem.201600578
- 68) W.C. Oliver and G.M. Pharr: J. Mater. Res. 7 (1992) 1564–1583. doi:10.1557/JMR.1992.1564
- 69) W.C. Oliver and G.M. Pharr: J. Mater. Res. 19 (2004) 3–20. doi:10.1557/jmr.2004.19.1.3
- 70) D.-H. Lee, M.-Y. Seok, Y. Zhao, I.-C. Choi, J. He, Z. Lu, J.-Y. Suh, U. Ramamurty, M. Kawasaki, T.G. Langdon and J.-i. Jang: Acta Mater. 109 (2016) 314–322. doi:10.1016/j.actamat.2016.02.049
- 71) W.D. Nix and H. Gao: J. Mechan. Phys. Solids 46 (1998) 411–425. doi:10.1016/S0022-5096(97)00086-0
- 72) G.M. Pharr, E.G. Herbert and Y. Gao: Annu. Rev. Mater. Res. 40 (2010) 271–292. doi:10.1146/annurev-matsci-070909-104456
- 73) R.W. Armstrong and P. Rodriguez: Philos. Mag. 86 (2006) 5787–5796. doi:10.1080/14786430600764872
- 74) R.W. Cahn and P. Haasen: Physical Metallurgy, 4th ed., (Cambridge University Press, Amsterdam, 1996).
- 75) D. Wu, J. Zhang, J.C. Huang, H. Bei and T.G. Nieh: Scr. Mater. 68 (2013) 118–121. doi:10.1016/j.scriptamat.2012.09.025
- 76) W.H. Liu, Y. Wu, J.Y. He, T.G. Nieh and Z.P. Lu: Scr. Mater. 68 (2013) 526–529. doi:10.1016/j.scriptamat.2012.12.002
- 77) E. Schafler, K. Simon, S. Bernstorff, P. Hanak, G. Tichy, T. Ungar and M.J. Zehetbauer: Acta Mater. 53 (2005) 315–322. doi:10.1016/j.actamat.2004.09.025
- 78) J. Gubicza, N.Q. Chinh, J.L. Lábár, S. Dobatkin, Z. Hegedus and T.G. Langdon: J. Alloy. Compd. 483 (2009) 271–274. doi:10.1016/j.jallcom.2008.07.200
- 79) M.J. Starink, X. Cheng and S. Yang: Acta Mater. 61 (2013) 183–192. doi:10.1016/j.actamat.2012.09.048
- 80) A. Heczel, M. Kawasaki, J.L. Lábár, J.-i. Jang, T.G. Langdon and J. Gubicza: J. Alloy. Compd. 711 (2017) 143–154. doi:10.1016/j.jallcom.2017.03.352
- 81) Z. Gao, Y. Zhao, J.M. Park, A.H. Jeon, K. Murakami, S. Komazaki, K. Tsuchiya, U. Ramamurty and J.-i. Jang: Scr. Mater. 210 (2022) 114472. doi:10.1016/j.scriptamat.2021.114472
- 82) S. Taheriniya, F.A. Davani, S. Hilke, M. Hepp, C. Gadelmeier, M.R. Chellali, T. Boll, H. Rösner, M. Peterlechner, C. Gammer, S.V. Divinski, B. Butz, U. Glatzel, H. Hahn and G. Wilde: Acta Mater. 208 (2021) 116714. doi:10.1016/j.actamat.2021.116714
- 83) K.L. Johnson: J. Mechan. Phys. Solids 18 (1970) 115–126. doi:10.1016/0022-5096(70)90029-3
- 84) S. Gangireddy, B. Gwalani, V. Soni, R. Banerjee and R.S. Mishra: Mater. Sci. Eng. A 739 (2019) 158–166. doi:10.1016/j.msea.2018.10.021
- 85) V. Maier-Kiener, B. Schuh, E.P. George, H. Clemens and A. Hohenwarter: Mater. Des. 115 (2017) 479–485. doi:10.1016/j.matdes.2016.11.055
- 86) S. Shim, J.-i. Jang and G.M. Pharr: Acta Mater. 56 (2008) 3824–3832. doi:10.1016/j.actamat.2008.04.013
- 87) D.-H. Lee, J.-A. Lee, M.-Y. Seok, U.B. Baek, S.H. Nahm and J.-i. Jang: Int. J. Hydrogen Energ. 39 (2014) 1897–1902. doi:10.1016/j.ijhydene.2013.11.060
- 88) D.-H. Lee, J.A. Lee, Y. Zhao, Z. Lu, J.Y. Suh, J.Y. Kim, U. Ramamurty, M. Kawasaki, T.G. Langdon and J.-i. Jang: Acta Mater. 140 (2017) 443–451. doi:10.1016/j.actamat.2017.08.057
- 89) K.L. Johnson: Contact Mechanics, (Cambridge University Press, 1985).
- 90) D. Tabor: The Hardness of Metals, (Oxford University Press, Oxford, 1951).
- 91) Z. Wu, H. Bei, G.M. Pharr and E.P. George: Acta Mater. 81 (2014) 428–441. doi:10.1016/j.actamat.2014.08.026
- 92) C.L. Wang, Y.H. Lai, J.C. Huang and T.G. Nieh: Scr. Mater. 62 (2010) 175–178. doi:10.1016/j.scriptamat.2009.10.021
- 93) V. Maier, K. Durst, J. Mueller, B. Backes, H.W. Höppel and M. Göken: J. Mater. Res. 26 (2011) 1421–1430. doi:10.1557/jmr.2011.156
- 94) S. Gangireddy, B. Gwalani, V. Soni, R. Banerjee and R.S. Mishra: Mater. Sci. Eng. A 739 (2019) 158–166. doi:10.1016/j.msea.2018.10.021
- 95) G. Laplanche, J. Bonneville, C. Varvenne, W.A. Curtin and E.P. George: Acta Mater. 143 (2018) 257–264. doi:10.1016/j.actamat.2017.10.014
- 96) W. Zhao, J.-K. Han, Y.O. Kuzminova, S.A. Evlashin, A.P. Zhilyaev, A.M. Pesin, J.-i. Jang, K.-D. Liss and M. Kawasaki: Mater. Sci. Eng. A 807 (2021) 140898. doi:10.1016/j.msea.2021.140898
- 97) Z. Wu, Y. Gao and H. Bei: Acta Mater. 120 (2016) 108–119. doi:10.1016/j.actamat.2016.08.047
- 98) V. Maier-Kiener, B. Schuh, E.P. George, H. Clemens and A. Hohenwarter: J. Mater. Res. 32 (2017) 2658–2667. doi:10.1557/jmr.2017.260
- 99) W. Huo, F. Fang, X. Liu, S. Tan, Z. Xie and J. Jiang: Appl. Phys. Lett. 114 (2019) 101904. doi:10.1063/1.5088921
- 100) M. Shabani, J. Indeck, K. Hazeli, P.D. Jablonski and G.J. Pataky: J. Mater. Eng. Perform. 28 (2019) 4348–4356. doi:10.1007/s11665-019-04176-y
- 101) X.B. Feng, W. Fu, J.Y. Zhang, J.T. Zhao, J. Li, K. Wu, G. Liu and J. Sun: Scr. Mater. 139 (2017) 71–76. doi:10.1016/j.scriptamat.2017.06.009
- 102) M. Komarasamy, N. Kumar, R.S. Mishra and P.K. Liaw: Mater. Sci. Eng. A 654 (2016) 256–263. doi:10.1016/j.msea.2015.12.063
- 103) P.F. Yu, H. Cheng, L.J. Zhang, H. Zhang, Q. Jing, M.Z. Ma, P.K. Liaw, G. Li and R.P. Liu: Mater. Sci. Eng. A 655 (2016) 283–291. doi:10.1016/j.msea.2015.12.085
- 104) S. Gangireddy, B. Gwalani and R.S. Mishra: Mater. Sci. Eng. A 736 (2018) 344–348. doi:10.1016/j.msea.2018.09.009
- 105) Y.M. Wang, A.V. Hamza and E. Ma: Acta Mater. 54 (2006) 2715–2726. doi:10.1016/j.actamat.2006.02.013
- 106) C.D. Gu, J.S. Lian, Q. Jiang and W.T. Zheng: J. Phys. D 40 (2007) 7440–7446. doi:10.1088/0022-3727/40/23/027
- 107) F. Dalla Torre, H. Van Swygenhoven and M. Victoria: Acta Mater. 50 (2002) 3957–3970. doi:10.1016/S1359-6454(02)00198-2
- 108) R. Schwaiger, B. Moser, M. Dao, N. Chollacoop and S. Suresh: Acta Mater. 51 (2003) 5159–5172. doi:10.1016/S1359-6454(03)00365-3
- 109) Y.M. Wang, A.V. Hamza and E. Ma: Appl. Phys. Lett. 86 (2005) 241917. doi:10.1063/1.1946899
- 110) F. Dalla Torre, P. Spätig, R. Schäublin and M. Victoria: Acta Mater. 53 (2005) 2337–2349. doi:10.1016/j.actamat.2005.01.041
- 111) T. Guo, P. Huang, K.W. Xu, F. Wang and T.J. Lu: Mater. Sci. Eng. A 676 (2016) 501–505. doi:10.1016/j.msea.2016.08.120
- 112) H. Li, H. Choo and P.K. Liaw: J. Appl. Phys. 101 (2007) 063536. doi:10.1063/1.2711411
- 113) C. Gu, J. Lian, Q. Jiang and Z. Jiang: Mater. Sci. Eng. A 459 (2007) 75–81. doi:10.1016/j.msea.2006.12.093
- 114) D. Caillard and J.L. Martin: Thermally Activated Mechanisms in Crystal Plasticity, (Pergamon, Amsterdam, 2003).
- 115) H. Conrad: Mater. Sci. Eng. A 341 (2003) 216–228. doi:10.1016/S0921-5093(02)00238-1
- 116) J. Moon, S.I. Hong, J.B. Seol, J.W. Bae, J.M. Park and H.S. Kim: Mater. Res. Lett. 7 (2019) 503–509. doi:10.1080/21663831.2019.1668489
- 117) D.-H. Lee, I.-C. Choi, G. Yang, Z. Lu, M. Kawasaki, U. Ramamurty, R. Schwaiger and J.-i. Jang: Scr. Mater. 156 (2018) 129–133. doi:10.1016/j.scriptamat.2018.07.014
- 118) J.R. Trelewicz and C.A. Schuh: Scr. Mater. 61 (2009) 1056–1059. doi:10.1016/j.scriptamat.2009.08.026
- 119) R.J. Asaro and S. Suresh: Acta Mater. 53 (2005) 3369–3382. doi:10.1016/j.actamat.2005.03.047
- 120) P. Gu, M. Dao, R.J. Asaro and S. Suresh: Acta Mater. 59 (2011) 6861–6868. doi:10.1016/j.actamat.2011.07.019
- 121) M. Vaidya, K.G. Pradeep, B.S. Murty, G. Wilde and S.V. Divinski: Sci. Rep. 7 (2017) 12293. doi:10.1038/s41598-017-12551-9
- 122) H. Li and A.H.W. Ngan: J. Mater. Res. 19 (2004) 513–522. doi:10.1557/jmr.2004.19.2.513
- 123) I.-C. Choi, B.-G. Yoo, Y.-J. Kim, M.-Y. Seok, Y. Wang and J.-i. Jang: Scr. Mater. 65 (2011) 300–303. doi:10.1016/j.scriptamat.2011.04.031
- 124) I.-C. Choi, B.-G. Yoo, Y.-J. Kim and J.-i. Jang: J. Mater. Res. 27 (2012) 3–11. doi:10.1557/jmr.2011.213
- 125) F. Garofalo: Fundamentals of Creep and Creep-Rupture in Metals, (Macmillan, New York, USA, 1965).
- 126) Y. Zhao, J.-M. Park, K. Murakami, S. Komazaki, M. Kawasaki, K. Tsuchiya, J.-Y. Suh, U. Ramamurty and J.-i. Jang: Scr. Mater. 203 (2021) 114069. doi:10.1016/j.scriptamat.2021.114069
- 127) R.P. Gangloff and B.P. Somerday: Gaseous Hydrogen Embrittlement of Materials in Energy Technologies, Volume 1, (Wood-head Publishing Limited, Cambridge, U.K., 2012).
- 128) Y. Zhao, D.-H. Lee, J.A. Lee, W.-J. Kim, H.N. Han, U. Ramamurty, J.-Y. Suh and J.-i. Jang: Int. J. Hydrogen Energ. 42 (2017) 12015–12021. doi:10.1016/j.ijhydene.2017.02.061


