Special Issue on Superfunctional Nanomaterials by Severe Plastic Deformation
Nanoscale Analysis of Solute Distribution in Ultrahigh-Strength Aluminum Alloys
2023 Volume 64 Issue 7 Pages 1441-1448
Details
2023 Volume 64 Issue 7 Pages 1441-1448
Nanoscale microstructural analysis and evaluation of mechanical properties were conducted on severely cold-rolled aluminum alloys. In order to examine the effect of alloying elements on microstructure and mechanical properties, Al–Cu–Mg, Al–Mg–Si and Al–Zn–Mg–Cu alloy sheets were prepared for systematic investigation. The SAXS and SANS were used to analyze the nanoscale microstructures in solution-treated and rolled samples of Al–Cu–Mg and Al–Zn–Mg–Cu alloys, and the results quantitatively revealed that nanoscale clusters are formed regardless of with or without rolling. HR-TEM, HAADF-STEM, thermal analysis, hardness and electrical conductivity measurements also suggested that the clusters are formed in cold-rolled samples. Mechanical property evaluations showed that strength generally increased, and ductility decreased with increasing cold-rolling reduction. The strength tended to increase with increasing solute content regardless of the alloy system.
This Paper was Originally Published in Japanese in J. JILM 71 (2021) 562–568.

Many studies have been conducted on the strengthening of aluminum alloys. For a long time, precipitation strengthening has been the main strengthening mechanism for aluminum alloys, but recent studies using severe plastic deformation (SPD) processes have shown that dislocation strengthening and grain refinement strengthening also play an important role in strengthening aluminum alloys.1–5) Related analyses of strengthening mechanisms6–15) and attempts to increase strength by combining SPD processing and precipitation12–14) have also been conducted. Particularly important results were reported in 2010. In this year, there were three reports on strengthening Al–Zn–Mg–Cu alloys (7075 and 7475 alloys) by high-pressure torsion (HPT).3–5) In all reports, the tensile strength was increased to about 1 GPa. Considering that the tensile strength of the conventional precipitation-strengthened material (7075-T6) is 570 MPa, a strength increase of about 75% is achieved by SPD. On the other hand, the ductility values varied widely among the reports in the range of 0–10% elongation. This may be due to differences in alloy composition, the process before HPT working, and the conditions of the HPT working process itself, but the cause of this difference is not clear.
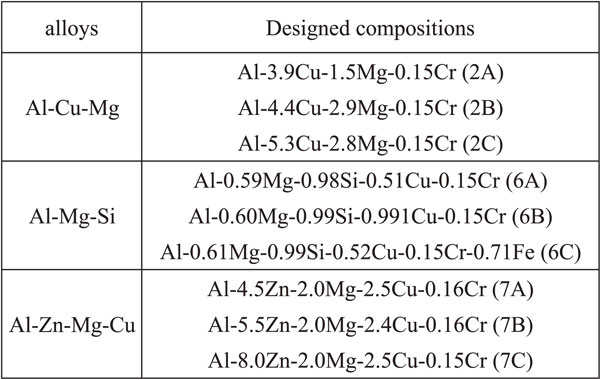
It has been suggested that “deformation-induced solute rearrangement” occurs in ultrahigh-strength aluminum alloys, which are strengthened more than conventional processes by SPD like HPT and severe cold rolling, in addition to increase of dislocation density and grain refinement.6) In this study, we attempted to clarify the microstructure required for ultrahigh strength and the process conditions necessary to achieve it by quantitatively analyzing the nano-scale microstructural changes caused by “deformation-induced solute rearrangement” using samples in which the alloy composition and process were systematically varied. This study was conducted as an integrated advanced research project of the Light Metal Educational Foundation, Inc., and was carried out using the original alloy samples of the sectional meeting on High-Strength Aluminum Alloys of the Japan Institute of Light Metals (JILM). The compositions of nine original alloys are shown in Table 1. In this study, nanoscale microstructural analysis and evaluation of mechanical properties were conducted on severely cold rolled specimens, in which the cold rolling reduction is 90%, of these alloys.
The microstructure that determines the strength of aluminum alloys includes zones and clusters with diameters of 10 nm or less. Therefore, scanning electron microscopy (SEM), which is relatively easy to prepare samples, does not have sufficient resolution, and transmission electron microscopy (TEM) and atom probe (AP) methods must be used. However, both methods require sample preparation, such as thinning and needling, for observation, and this hinders the understanding of the initial process of microstructure formation in aluminum alloys, where nanostructure formation progresses even at room temperature. In addition, since the sample geometry of both methods is different from that of the bulk, continuous in-situ observation of the microstructure is difficult. Small-angle X-ray or neutron scattering (hereinafter referred to as SAXS and SANS, respectively) are effective methods to supplement these weak points in microstructure observation. However, SAXS and SANS experiments are mainly conducted using large facilities such as SPring-8 and J-PARC, and it is difficult to obtain beam time for several days in a row. In order to study natural aging and its composition dependence in detail, it is necessary to make active use of laboratory equipment rather than relying solely on large facilities. Based on the above basic understanding, in this study, in order to achieve both “bulk shape” and “long-term measurement”, we utilized a laboratory high-energy SAXS system that can measure samples of about 1 mm in thickness in a transmission configuration and performed continuous measurement from within a few minutes to several days after solution treatment to determine the average size and volume fraction change from the initial aging stage, including the effect of cold rolling.
Among the samples listed in Table 1, the 2A and 7A samples with a thickness of 1 mm were used as starting samples for the measurements. After solution treatment at 480°C for 1 h, these specimens were immediately put into the SAXS apparatus without any processing to start the measurement. The solution treated specimens were cold-rolled to a thickness of about 0.2 mm subsequently after solution treatment, and SAXS measurements were also performed on these rolled specimens. The time required for cold rolling was about 10 min. SAXS measurements were performed using an apparatus optimized for Mo-Kα (Rigaku Nano-Viewer Mo specification).16) Depending on the aging temperature, one measurement was made for 30 minutes or 1 h, and continuous measurements were made for up to 2 days. Figure 1 shows the SAXS results of the 7A sample at room temperature. The scattering intensity increases with time in the region 1 < q < 4 nm−1 with and without rolling. This corresponds to the formation of a new nanostructure with a diameter of about 1 nm, where q = 4 sin θ/λ, λ: the wavelength of the X-rays. Furthermore, an inter-particle interference peak maximum appears around q = 2 nm−1, indicating that the number density of these nanostructures is very large.17) The time evolution of the nanostructure parameters obtained by fitting the results by these observations using a model applicable to profiles with peaks18) is shown in Fig. 2. At the beginning of the aging time (within 5 h), the particle size in the solution-treated sample is very small and the number density is very high, but the volume fraction is smaller than in the rolled sample. However, as aging proceeds, the increase in volume fraction is larger in the solution-treated sample, and after 150 h, the volume fractions of the two samples are almost equal, and the particle size of the solution-treated sample is slightly larger than that of the rolled sample after 10 h. Considering the room temperature aging and the spherical shape based on the profiles, the observed microstructure is considered to correspond to the GP zone,19) suggesting that the rolling process promotes zone formation in the early aging stage but suppresses coarsening in the later aging stage. In the aging processes at 65°C and 120°C, anisotropy of particle shape was observed in the rolled sample as aging progressed, which shows that the transition to the formation of the η′ phase was observed as a change in profile shape. On the other hand, the profile shape of the solution-treated sample was considered as a spherical shape during the entire aging process, and the formation of the η′ phase could not be identified from the profile shape. However, analysis by combining the results of SAXS and SANS indicates that the η′ phase was identified in the later stage of aging. The SANS samples were measured by overlapping 10 sheets of 1-mm-thick SAXS samples to avoid the influence of differences in quenching conditions and the other factors.

Effect of aging at room temperature on SAXS profile of 7A specimens. (a) without rolling, (b) after cold rolling.

Effect of aging at room temperature on structural parameters obtained from SAXS profiles of 7A specimens. (a) averaged diameter, (b) volume fraction, (c) number density of particles.
In the 2A sample shown in Fig. 3, almost spherical microstructure with a diameter of about 1 nm was formed in the initial stage of aging at room temperature, and the effect of rolling process on this microstructure formation could be observed. However, while the increase in profile strength in the rolled sample was almost stagnant immediately after rolling, the scattering strength in the unrolled sample reversed that of the rolled sample. The SAXS measurements on this sample are considered to observe Cu/Mg co-clustering20) through changes in Cu content. Figure 4 compares the accumulated volume fraction of co-clustering at room temperature and at 65°C. The accumulated volume fraction for the rolled specimens were found to be lower than those for the solution-treated specimens at both room temperature and 65°C aging, about 50% of that of the solution-treated sample at 65°C aging, indicating that the progression of co-clustering is suppressed by rolling. On the other hand, at 120°C aging, a change to a scattering profile of particles with an anisotropic shape was observed in the rolled sample in the middle stage of aging. The GPB zone in this alloy system has an anisotropic shape,20) indicating that the formation of the GPB zone is enhanced by rolling. The result of 190°C aging shows a transition to a profile with anisotropic particles even in the solution-treated sample, but this change begins after 30 minutes of aging for the rolled sample, whereas in the solution-treated sample, the transition to a profile with anisotropic particles is observed after more than 3 h of aging. Thus, as with the result of aging at 120°C, the acceleration of GPB zone formation by rolling was confirmed.

Effect of aging at room temperature on SAXS profile of 2A specimens. Lines: without rolling, symbols: after cold rolling.

Effect of cold rolling on accumulated volume fraction of particles. Solid lines: without rolling and aged at room temperature, dashed line: without rolling and aged at 65°C, ○: cold rolled and aged at room temperature, △: cold rolled and aged at 65°C. Specimens were aged for 24 h at each temperature.
As described above, the quantitative evaluation of the amount of microstructure formation by long-term in-situ observation in the laboratory high-energy SAXS is now possible. Further analysis of the present samples is underway in the hope of obtaining new strategies for the development of ultrahigh-strength aluminum alloys by severe cold rolling, which can be achieved by correlating these results with the results of detailed microstructure observation by TEM and mechanical properties.
How does the microstructure develop during the aging process in the alloys solution-treated and subsequently cold-rolled by 90%? It is well known that the dislocations, introduced by cold rolling, accelerates the aging and precipitation process. The reasons for this are thought to be the rapid diffusion of solute atoms through the dislocation core and the fact that the dislocations act as nucleation sites for precipitates. Furthermore, depending on the type of additional elements and aging conditions, the aging precipitation process may not only accelerate but exhibit a precipitation process different from that of solution-treated materials. In order to verify such changes in the aging precipitation process in detail, a multifaceted evaluation including transmission electron microscopy is indispensable.
The hardness and electric conductivity of Al–4.4Cu–2.9Mg–0.15Cr (2B sample) aged at 190°C are shown in Fig. 5.21) The specimens aged directly after solution treatment and those aged after solution treatment and subsequent cold rolling by 90% are hereafter referred to as T6 and T8 samples, respectively. From an approximate hardness of 80 HV after solution treatment, the hardness of the T6 samples increases to about 100 HV in the early aging stage and shows plateau till 3.6 ks (1 hr) of aging, followed by second plateau to 115 HV around 7.2 ks (2 hr) of aging. The hardness reaches a peak at about 172.8 ks (48 hr) of aging, and then decreases for further aging. The cause of the two plateaus in hardness increase is not clear, since there is no change in electric conductivity during the two plateaus. It is still under investigation. In the T8 samples, the work hardening appears by dislocations increased during cold rolling, and the hardness increases gradually by subsequent aging, showing peak hardness at 0.6 ks (10 min). The electric conductivity of the T8 samples increased earlier than that of the T6 samples. In the DSC curve shown in Fig. 6, the absence of cluster formation peaks in the as rolled (A.R.) sample suggests that clusters formed during rolling in the T8 sample. The peak of S′ phase precipitation shifts to the lower temperature by cold rolling, indicating that precipitation is accelerated. High resolution TEM images for 2B samples aged for 172.8 ks (46 hr) after solution treatment and aged for 21.6 ks (6 hr) after solution treatment and subsequent cold rolling by 90% are shown in Fig. 7.21) In the former, a transverse section of lath-like S′ phase with a diameter of about 5 nm was observed. In the latter, precipitates with a length of 8–10 nm were observed, which are also considered to be S′ phase, but confirmation by detailed investigation is needed.

Effect of aging time on hardness and electrical conductivity in Al–Cu–Mg alloy specimens (2B). Solution treated specimens (T6) and 90% cold-rolled specimens (T8) were aged at 190°C.

DSC curves in Al–Cu–Mg alloy specimens (2B). From top to bottom: solution treated (A.Q.), 90% cold-rolled (A.R.), 90% cold-rolled and subsequently aged at 190°C for 0.6 ks (T8).

Examples of TEM observation in Al–Cu–Mg alloy specimen (2B). (a) without rolling, aged at 190°C for 172.8 ks, (b) 90% cold-rolled, aged at 190°C for 21.6 ks.
Figure 8 shows the hardness and conductivity of Al–0.6Mg–1Si–0.5Cu alloy (sample 6A) solution-treated (T6) and 90% cold-rolled (90% cold-rolled) aged at 170°C.22) The solution treated sample exhibited a peak hardness of approximately 130 HV at 86.4 ks (24 hrs); 90% cold-rolling exhibited a significant increase in hardness and a peak hardness was reached at 1.8 ks (30 min).

Effect of aging time on hardness and electrical conductivity in Al–Mg–Si–Cu alloy specimens (6A). As solution treated specimens (T6) and 90% cold-rolled specimens (T8) were aged at 170°C.
The results of DSC measurements of solution-aged (A.Q.) and 90% cold-rolled (A.R.) samples, as well as those aged for 1.8 ks (30 min) or 86.4 ks (24 h) (T6 1.8 ks (30 min), T6 86.4 ks (24 h) and 90% cold-rolled 1.8 ks (30 min), respectively) are shown in Fig. 9. The DSC curve of the solution-treated sample aged for 1.8 ks (30 min) shows the presence of a dissolution peak of the β′′(L) phase at around 230°C. This indicates that precipitation of the β′′ phase began during aging for 1.8 ks (30 min). The larger peak of the β′′(L) phase dissolution in T6 86.4 ks shows larger amount of precipitates in the specimen aged for 86.4 ks than in the one aged for 1.8 ks (30 min). In the 90% cold-rolled sample, the dissolution peak of clusters appears slightly around 180°C, indicating that clusters are formed slightly during rolling.23) In addition, the precipitation peak of the β′(Q′) phase, which was observed in the solution-treated sample, no longer appears. The smaller precipitation peak of the β′′(L) phase in the 90% cold-rolled 1.8 ks material suggests that precipitation of the β′′(L) phase occurred during aging of 1.8 ks (30 min).

DSC curves in Al–Mg–Si–Cu alloy specimens (6A). From top to bottom: 90% cold-rolled and subsequently aged at 170°C for 1.8 ks, 90% cold-rolled (A.R.), solution-treated (A.Q.), solution treated and aged at 170°C (T6) for 1.8 ks, solution-treated and aged at 170°C (T6) for 86.4 ks.
The results of high-resolution TEM observations of precipitates found in the T6 1.8 ks (30 min) material are shown in Fig. 10.22) Figure 10(b) is an enlarged image of the framed area in Fig. 10(a), in which bright spots consistent with the crystal structure of the β′′ phase (a = 1.516 nm, b = 0.405 nm, c = 0.674 nm, β = 105.3°) are observed, indicating not only the formation of clusters but also the precipitation of β′′ phase has started. This result is consistent with the results of DSC measurements. The 90% cold rolling was found to have the following effects on the precipitation process: (1) the formation of clusters during rolling, (2) no transition to the β′(Q′) phase, and (3) acceleration of the precipitation process.

Examples of TEM observation in Al–Mg–Si–Cu alloy specimen (6A). (a) without rolling, aged at 170°C for 1.8 ks, (b) enlargement of β′′ phase indicated by box in (a).
Here we describe the results of evaluation of mechanical properties of aluminum alloys strengthened by cold rolling and summarize the results for each alloy system to discuss the effect of solute elements on strengthening. In this study, a rolling reduction of 90% (2.7 in terms of equivalent strain) was used as the standard condition to investigate the mechanical properties of the cold-rolled samples. The time required for cold rolling was about 40 minutes. A sample in peak aging condition (T6-treated material) was also prepared as a comparison for the rolled samples. Solution treatment was performed at a specified temperature for 1 h and the samples were subsequently quenched into water. Samples with a rolling reduction other than 90% were also prepared for selected alloy compositions. Tensile test specimens with a gage length of 12 mm, a width of 4.5 mm, and a thickness of 0.7 mm were prepared from the cold-rolled sheets in a direction parallel to the rolling direction. Tensile tests were conducted in a dry nitrogen gas atmosphere, mainly at a strain rate of 1.67 × 10⁻⁶ s−1. The specimens were stored at 0°C or less between cold rolling and tensile testing, except for the time required for specimen fabrication.
First, the results for the Al–Zn–Mg–Cu alloys (7A, 7B, and 7C) are shown. The alloy compositions of these samples were systematically varied with Zn additions of 4.5%, 5.5%, and 8%, respectively, while the additions of other elements were not varied.24) Figure 11 shows the results of tensile tests on samples that were solution annealed at 480°C and cold rolled by 90%. The 7A (4.5% Zn) and 7B (5.5% Zn) specimens exhibit tensile strength of 650 MPa or higher while maintaining ductility. The 7C (8% Zn) specimen, on the other hand, showed little ductility, and although its hardness was higher than the other samples, its tensile strength was comparable to the other samples. The 7A and 7B specimens were further subjected to rolling at higher reduction and tensile tests were conducted on 98% rolled specimens. Although their ductility was lower than that of 90% rolled specimens, their tensile strength increased to 700 MPa or higher.

Tensile properties of Al–Zn–Mg–Cu alloy specimens (7A, 7B, 7C) after 90% cold rolling.
In order to investigate the effect of solute amount before cold rolling on mechanical properties, a study was also conducted by varying the solution treatment conditions prior to cold rolling. Here, a 65% rolled samples of 7C (8% Zn) were used. The results of tensile tests are shown in Fig. 12.25) The strength tends to increase with solution treatment temperature. As shown in the figure, the tensile strength of the T6-treated alloy (solution treatment temperature: 480°C) is 570 MPa, which is lower than the strength of the cold-rolled specimen with solution temperature at 420°C that exhibits the lowest strength. Ductility also tends to improve with higher solution treatment temperatures.

Effect of solution treatment temperature on tensile properties in 7C specimen (8%Zn) after cold rolling.
For the 7A (4.5%Zn) alloy, the effect of post-rolling aging treatment was also examined. Aging at 120°C decreased the strength of the rolled specimen, while aging at 80°C increased the strength of the rolled specimens. However, the tensile strength did not exceed 700 MPa even after aging at 80°C.
Regarding the alloy composition of the Al–Cu–Mg alloys (2A, 2B, and 2C), the amount of Cu and Mg were varied, while the amount of the other elements were not varied. The results of tensile tests at an initial strain rate of 1.67 × 10⁻⁴ s−1 of the samples which were solution-treated and subsequently 90% cold-rolled are shown in Fig. 13.26) The figure also shows the results of 2024 alloy, a commercial Al–Cu–Mg base alloy. A comparison focusing on the sample solution-treated at 505°C shows little change in tensile strength when the alloy composition is changed. This may be because part of solute element was insoluble during solution treatment in the 2B and 2C alloys with higher solute content. Thus, solute solubility did not change even if the alloy composition was changed. This trend was also the same at a strain rate of 1.67 × 10⁻⁶ s−1, although ductility was higher at the lower strain rate. On the other hand, the 2024 alloy, in which the copper and magnesium contents are intermediate between those of alloys 2A and 2B, shows higher strength than these samples. The strengthening in 2024 alloy may be affected by the other alloying elements, manganese, zirconium, titanium, vanadium, etc. A comparison of the effect of solution treatment temperature on alloys 2B and 2C showed that a decrease in the temperature reduced both tensile strength and ductility. The decrease in ductility may be due to an increase in the volume fraction of the second phase.

Stress-stain curves obtained by tensile tests with initial strain rate of 1.67 × 10⁻⁴ s−1 of Al–Cu–Mg alloy specimens (2A, 2B, 2C) after 90% cold rolling. Results of 2024 commercial alloy are also shown for comparison. Value after specimen name indicates temperature of solution treatment, which was performed just before cold rolling.
In the Al–Mg–Si alloys, 6B and 6C, copper and iron contents were varied from the base alloy, 6A, with excess Si composition. The solution treatment temperature was 540°C and the cold rolling reduction was 90%, and the specimens aged after the solution treatment, T6 condition, were also prepared. From the results of tensile tests, 6B with higher copper content had the highest strength in both cold-rolled and T6-treated samples, while 6C with higher iron content than 6A had the same strength as 6A.27) The strength of the cold-rolled and T6 samples did not differ significantly.
The correlation between the content of alloying elements generally considered to be essential (hereinafter referred to as “main alloying elements”) and mechanical properties was examined for the samples used in this study. The total amount (mol%) of main alloying elements, zinc, magnesium, copper and silicon, added to each alloy was used as the total solute content, and the relationship between hardness and the total solute content is plotted in Fig. 14. This figure shows that hardness has a good correlation with the total solute content. The total solute content here is the total amount added based on the alloy composition, not the actual amount of main alloying elements in solid solution after solution treatment. The Al–Cu–Mg alloys, 2B and 2C, are plotted on the side of higher total solute content, but as already mentioned, the actual solute content in these two alloys is considered to be the same as in the 2A alloy. Although the horizontal axis of this figure is not strictly quantitative, it can be assumed that the amount of solid solution of the main alloying elements during cold rolling is almost proportional to the hardness, since the samples were manufactured under the same conditions of ingot purity and manufacturing process. A similar trend was observed in the plot of tensile strength vs. total solute content. On the other hand, the correlation between ductility and the total solute content was not clear, and the ductility of the Al–Cu–Mg alloys is lower than that of the Al–Mg–Si and the Al–Zn–Mg–Cu alloys. The effects of texture development and shear banding during severe cold rolling may have some effects on the ductility of cold-rolled specimens, which should be investigated in the future.

Vickers hardness vs. total solute content plots for 90% cold-rolled specimens.
The SAXS and SANS were used to analyze the nanoscale microstructures in solution-treated and rolled samples of Al–Cu–Mg and Al–Zn–Mg–Cu alloys, and the results quantitatively revealed that nanoscale clusters are formed regardless of with or without rolling and that the formation of the clusters is significantly enhanced by cold rolling. HR-TEM, HAADF-STEM, hardness, thermal analysis, and electrical conductivity measurements also suggest that the clusters are formed in cold-rolled samples when they are held at room temperature for a very short time during or after cold rolling. Mechanical property evaluations showed that strength generally increased, and ductility decreased with increasing cold-rolling reduction. The strength of the cold-rolled material tended to increase as the amount of added alloying elements increased. The total solute content dependence of hardness and tensile strength of the 90% cold-rolled specimens of all the alloy systems used in the present study was evaluated, and the strength tended to increase with increasing solute content regardless of the alloy system.
These results suggest that the severe cold rolling causes solute rearrangement, resulting in the formation of a large number of nanoclusters of about 1 nm in size, and that this is the main cause of the strength increase due to cold rolling. Although details of solute rearrangement by cold working has not been understood, this study reveals that such a phenomenon generally occurs in heat-treatable type aluminum alloys like Al–Cu–Mg, Al–Mg–Si and Al–Zn–Mg–Cu alloys, and that controlling this phenomenon may improve the mechanical properties of the alloys processed with severe cold rolling. Although there are still some issues to be studied, such as understanding the dominant factors of ductility and clarifying the effect of aging after cold rolling on mechanical properties, further investigation of the relationship between mechanical properties and solute elements under various alloy compositions and process conditions will enable optimization of process conditions to realize ultra-high aluminum alloys in the future.
The results of this research were supported by the Light Metal Educational Foundation, Inc. as an Integrated Advanced Research Project in 2019. The authors would like to express their deepest gratitude to the Light Metal Educational Foundation, Inc. The authors would also like to express their deepest gratitude to all those who cooperated with us.