Abstract
The image analysis tensile test method was applied to obtain true stress–true strain curves at elevated temperature in Ti–6Al–4V alloy. A CCD camera successfully captured the profile change of a specimen during the tensile test. Minimum radius and neck curvature can be calculated from the profile, then used to determine true strain and true stress after necking using Bridgman’s equation. True stress–true strain curves up to a strain of 0.8 were obtained in the high temperature tensile test at 850°C. The true stress–true strain curves show work hardening at a strain rate of 0.2 s−1 and dynamic restoration at a strain rate of 0.01 s−1 in the tensile test at 850°C. On the other hand, in compression tests, the true stress–true strain curves show steep decrease in true stress after yielding. This might be due to the effect of barreling of the specimen, rather than any metallurgical structural change. The image analysis tensile test method is applicable to obtain accurate high–temperature true stress–true strain curves at elevated temperature up to large strain extent.
This Paper was Originally Published in Japanese in J. JSTP 62 (2021) 177–182.
1. Introduction
Pure titanium and titanium alloys exhibit outstanding specific strength and corrosion resistance, making them prevalent choices for highly reliable aircraft components.1–3) In recent years, carbon fiber-reinforced plastic composites (CFRPs) have gained popularity in the construction of airframes and engine parts, aimed at reducing aircraft fuel consumption.4,5) Nonetheless, the demand for titanium remains robust due to its remarkable corrosion resistance and coefficient of thermal expansion. Various titanium alloys exist, with Ti–6Al–4V standing out for its exceptional mechanical and high-temperature strength properties.1) Consequently, it finds extensive use in general structural materials, as well as in aircraft bolts, fan blades, and fan cases for engines.
Aircraft component manufacturing commonly employs forging methods. Recently, the demand for forged titanium alloys for aircraft has surged in tandem with the increased use of titanium alloys. However, working with Ti alloys presents challenges due to their difficult machinability. Moreover, titanium alloys are frequently employed in applications requiring high precision and reliability.6)
The evaluation of forgeability at high temperatures often relies on a high-temperature uniaxial compressive test as a standard method. Nevertheless, this method yields uneven strain distribution within the sample due to friction between the sample and the processing anvil.7) Consequently, when friction is substantial, achieving uniform deformation and obtaining accurate true stress–strain curves becomes problematic.8) To address this, studies have explored the impact of friction between the compressive test specimen and the anvil, as well as flow stress analyses using inverse methods.9–14)
In contrast, a tensile test provides an accurate true stress–true strain curve until the point of uniform deformation is reached. However, the strain at uniform deformation is relatively small, and once necking begins, signifying the end of uniform deformation, the stress triaxiality within the neck area increases. Consequently, a true stress–true strain curve cannot be accurately obtained. Additionally, the specimen size during tensile tests tends to be large, making it challenging to achieve temperature uniformity. Consequently, uniaxial compressive tests are generally preferred for measuring high-temperature stress–strain curves.
Bridgman proposed a true stress calibration equation that accounts for neck shape in uniaxial tensile deformation, expressing nominal stress σn, average stress σav, and true stress σt as follows:
| \begin{equation}
\sigma_{n} = \frac{P}{\pi a_{0}^{2}}
\end{equation}
| (1) |
| \begin{equation}
\sigma_{av} = \frac{P}{\pi a^{2}}
\end{equation}
| (2) |
| \begin{equation}
\sigma_{t} = \cfrac{\sigma_{av}}{\biggl(1 + \cfrac{2R}{a}\biggr)\ln \biggl(1 + \cfrac{a}{2R}\biggr)}
\end{equation}
| (3) |
Here, P represents the applied load, a corresponds to the minimum cross-sectional radius of the specimen neck, a0 signifies the initial minimum cross-sectional radius, and R denotes the radius of the neck curvature. Additionally, σav represents the average stress, which is a stress value that does not account for changes in stress triaxiality following necking. When we derive the values of the minimum cross-sectional radius a of the neck and the radius of the neck curvature R from eq. (3), it becomes possible to compute the true stress. Furthermore, true strain εt can be calculated using the formula:
| \begin{equation}
\varepsilon_{t} = \ln\left(\frac{a_{0}^{2}}{a^{2}} \right)
\end{equation}
| (4) |
Enami et al. previously described a method for calculating true stress using an intermittent tensile test, in which the diameter is measured intermittently.16,17) In contrast, Murayama et al. developed an image analysis-based tensile test method that continuously measured the minimum cross-sectional radius a and the radius of neck curvature R until specimen fracture. They demonstrated the feasibility of obtaining a true stress–true strain curve until fracture at room temperature, employing Bridgman’s equation.18) This innovative method involved the use of two 2-megapixel charge-coupled device (CCD) cameras installed within a tensile test machine, allowing for continuous and precise in situ monitoring of specimen shape changes.
However, it’s worth noting that the application of the image analysis tensile test method at elevated temperatures has not yet been explored, and a reliable approach for obtaining true stress–strain curves at high temperatures remains unestablished.
Hence, the primary objective of this study is to illustrate the effectiveness of a high-temperature image analysis-based tensile test method for obtaining highly accurate true stress–true strain curves of titanium alloys under high-temperature conditions. To provide a meaningful comparison, given that compressive testing is a commonly employed high-temperature method, we initially conducted both compressive and tensile tests using the image analysis technique at room temperature. This served to validate the effectiveness of the tensile test. Subsequently, we performed identical tests utilizing the image analysis method at elevated temperatures, thereby verifying the utility of the high-temperature image analysis-based tensile test.
2. Experimental Procedure
In this study, we selected a Ti–6Al–4V alloy, which is a representative titanium alloy, as our test material. The chemical compositions of the test materials are presented in Table 1. Figures 1(a) and (b) provide the dimensions of the tensile and compressive test specimens, respectively. The tensile test specimens were 120 mm in length, featured an M10 grip section, a 20 mm long parallel section, and a 7 mm diameter in the parallel section. Conversely, the compressive test specimen measured 12 mm in length and 8 mm in diameter.

Table 1 Chemical composition of the Ti–6Al–4V alloy used in this study (wt.%).
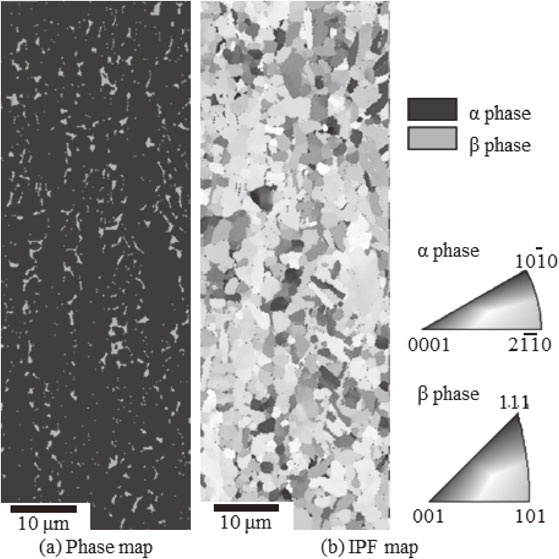
Figures 2(a) and (b) display phase and inverse pole figure (IPF) maps, respectively, obtained through scanning electron microscopy–electron backscatter diffraction (SEM–EBSD) analysis of the test material at room temperature. These observations were conducted on Section L of the compressive test specimen. The average particle size measured 2.3 µm, with the ratios of α to β phases at 94.3% and 5.7%, respectively, and the crystal grains exhibiting equiaxed morphology.
To conduct the tensile and compressive tests, we employed a compact multidirectional thermomechanical simulator, manufactured by Fuji Electronic Industrial Co., Ltd. This device comprises heating, processing, and data recording mechanisms. The heating mechanism utilizes a direct-current resistance heating system capable of rapid heating at a rate of 200 K/s and features a swift cooling function. Both heating and processing operations were performed within a vacuum chamber. Data, including load measurements via a load cell, stroke displacement measurements via a differential transformer, and temperature measurements using a thermocouple, were all collected through a PC.
The specimens underwent heating from room temperature to 850°C at a rate of 10 K/s and were maintained at 850°C for 5 minutes. Following the isothermal holding period, a tensile test was conducted while maintaining a constant true strain rate of 0.01 s−1 or 0.2 s−1. To achieve this, the strain rate was controlled by gradually reducing the stroke displacement rate (crosshead speed) to maintain a constant true strain rate in the longitudinal (tensile) direction. A schematic diagram of the image analysis-based tensile test method is illustrated in Fig. 3(a). It incorporates a CCD camera (Keyence CV-200M) and an image analyzer (Keyence CV-5500). The application of energized light and dark regions created a clear outline of the specimen, even without backlighting. Furthermore, because the post-test specimen shape was axisymmetric, high-temperature image analysis was accomplished using a single CCD camera. Figure 3(b) delineates the measurement region of the specimen captured by the CCD camera utilizing the image analysis tensile test method. To meticulously assess the sample’s shape during the test, we established 238 measurement lines with intervals of approximately 0.1 mm. In the tensile test, the data acquired by the CCD camera included the diameter 2a of both the entire R and gauge sections of the specimen, as depicted in Fig. 3(a). The data sampling rate was approximately 34 ms. We obtained the shape change (profile) of the entire specimen by connecting the cross-sectional radii of each point. Subsequently, the minimum cross-sectional radius a was extracted, and the radius of neck curvature R was calculated before and after the minimum cross-sectional radius. To facilitate a comparison, a compressive test was also conducted. For the compressive test, we utilized a previously described thermomechanical simulator, employing a tungsten carbide anvil as the compression pedestal. Image analysis was performed, and the barrels on both sides of the sample were measured based on the diameter data captured using the CCD camera. The true strain εt in the compressive test was calculated using the formula:
| \begin{equation}
\varepsilon_{t} = \ln \left(\frac{l_{0}}{l}\right)
\end{equation}
| (5) |
where l0 is the initial height of the sample and l is the sample height during compression deformation. The true stress in the compressive tests is calculated as follows:
| \begin{equation}
\sigma_{t} = \frac{P}{\pi a_{\textit{max}}^{2}}
\end{equation}
| (6) |
where amax is the maximum cross-sectional radius of the sample obtained via image analysis.
We conducted tensile and compressive tests, incorporating image analysis, on a sample of ultralow-carbon steel (Fe–0.0016% C) at room temperature. The ultralow-carbon steel underwent processing to create specimens following normalization at 900°C for 1 hour. The specimen dimensions matched those of the previously mentioned Ti–6Al–4V alloy, with a strain rate set at 0.01 s−1. In the case of the compressive tests, we employed silicon nitride anvils and carbon-based lubricants. To facilitate comparison, we conducted compressive tests both with and without lubrication.
3. Results and Discussion
Figure 4 illustrates the shape changes observed during the compressive test of ultralow-carbon steel at room temperature. In this figure, the horizontal axis represents coordinates along the compression axis, while the vertical axis represents the diameter. The profiles at 5, 15, 25, 44, and 54 seconds after the start of processing are displayed. The specimen’s height was determined based on the change in the thermomechanical simulator’s stroke position. A comparison between scenarios with and without lubrication revealed no substantial profile differences up to 15 seconds into processing. However, differences became evident after 25 seconds, with significant distinctions at 44 and 54 seconds. Lubrication consistently resulted in a shorter maximum diameter compared to non-lubricated conditions, effectively suppressing barreling. With lubrication, the outer diameter was only approximately 0.2 mm longer than that calculated under the assumption of uniform deformation, signifying nearly uniform deformation and clear lubrication effects.

Figure 5 presents the stress-strain curve derived from both compressive and tensile tests conducted on ultralow-carbon steel at room temperature. The enlarged view in Fig. 5 indicates a yield stress of 120 MPa in both pressurized and tensile tests with lubrication. When comparing lubricated and non-lubricated conditions in the compressive test concerning deformation stress, it was evident that deformation stress was lower under non-lubricated conditions due to the increased maximum diameter caused by barreling. True strain values up to 0.5 demonstrated close agreement between the deformation stress in the tensile and lubricated compressive tests. This agreement substantiates the calculation of true stress–true strain curves based on Bridgman’s equation (eq. (3)) following necking. However, as true strain surpassed 0.5, necking rates accelerated, resulting in increased deformation stress exceeding that of the compressive test due to the higher true strain rate derived from true strain (eq. (4)). Consequently, within the range of constant true strain rate within the neck (up to a true strain of 0.5 in this instance), deformation stresses from both tensile and lubricated compressive tests exhibited close correlation. Consequently, deformation stress was necessitated in both tensile and lubricated compressive tests. While compressive testing can be effectively conducted with lubrication at room temperature, achieving proper lubrication at high temperatures presents challenges. In this regard, the tensile test, which does not rely on lubrication, is considered superior to the compressive test.

Figure 6 illustrates the profile changes of the specimen during the tensile test conducted at a processing temperature of 850°C and a true strain rate of 0.01 s−1, as captured by a CCD camera for the Ti–6Al–4V alloy sample. The horizontal axis signifies coordinates in the tensile direction of the specimen, while the vertical axis represents the specimen’s cross-sectional radius. At time zero (0 s), the gauge section spanned between 3 mm and 23 mm. The specimen extended to the left due to tensile deformation. Time in Fig. 6 denotes the duration from the initiation of tensile deformation. Within the gauge section, the cross-sectional radius uniformly decreased until 15 seconds, after which necking occurred and progressed from 15 seconds onward. Major necking was evident until 57.1 seconds, just prior to fracture. This continuous monitoring of gauge section shape changes, even at elevated temperatures, enabled the ongoing measurement of specimen profile changes up to just before fracture.

Figure 7(a) displays the temporal change in the minimum cross-sectional radius a of the gauge section obtained through image analysis. Uniform deformation occurred within the first 15 seconds, with necking commencing afterward. After 55 seconds, the radius began decreasing rapidly, signifying accelerated necking. Figure 7(b) illustrates the time change in true strain calculated using eq. (4). Beyond 55 seconds, true strain exhibited a sharp increase concurrent with rapid necking. The true strain at fracture measured approximately 1.36, allowing measurement up to significant strain levels. Here, the true strain rate experienced a sharp rise at 55 seconds. Thus, the true strain rate was assumed nearly constant up to 54 seconds, and the data collected up to that point were employed. The true strain approximated 0.8. With an average true strain rate of 0.015 s−1 and a relatively constant true strain rate, it was feasible to obtain the true stress–true strain curve for the image analysis tensile test of the Ti–6Al–4V alloy at 850°C.
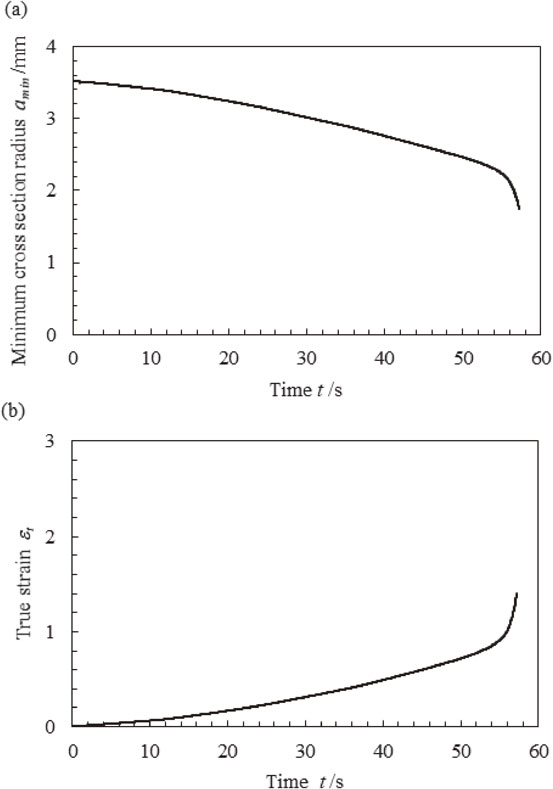
Figure 8 illustrates the temporal changes in the radius of curvature R at the neck. The radius of curvature was not calculated up to 35 seconds, as necking had not yet occurred or the radius was extremely small at a true strain of 0.4. As the radius of curvature up to 35 seconds greatly exceeded the radius of the specimen’s gauge section, the denominator of eq. (3) was approximately 1, aligning the average and true stresses. Subsequently, the radius of curvature, recorded 35 seconds after the initiation of tension, exhibited an exponential decrease. This continuous calculation of the minimum cross-sectional radius and radius of curvature facilitated the application of Bridgman’s equation.

Figure 9 depicts the true stress–true strain curve, along with nominal stress and the true stress calculated as previously described, offering a comparison. The dashed line highlights a true strain of 0.8 or higher, where the true strain rate exceeded 0.015 s−1. The yield stress, consistently measured at 68 MPa, did not differ significantly from other stress values. Post-yielding, nominal stress decreased monotonically due to declining load. In contrast, true stress exhibited only a slight decline, a notable departure from the substantial reduction observed in the compressive test. The minor reduction in true stress may be attributed to dynamic recovery rather than dynamic recrystallization. Additionally, the results of the tensile test contrasted with Roy, Cai, and Yamamoto et al.’s compressive test results at strain rates of 0.01–3 s−1. Given the simplicity of shape changes and strain distribution uniformity, the tensile test yielded a more accurate true stress–true strain curve compared to the compressive test.
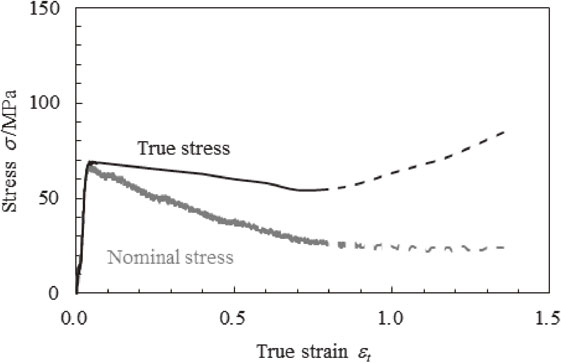
Figure 10 offers a comparison of the compressive and tensile tests. In the compressive test, true stress significantly decreased after yielding but started to rise when true strain exceeded 0.4. The increase in true stress, despite a constant true strain rate of approximately 0.01 s−1 up to a true strain of 1.3, was not attributed to strain rate. Instead, it was influenced by friction, resulting in a lack of contact area expansion between the sample and the anvil in the early stages of compression (up to a strain of 0.4), causing central expansion in the compressive direction due to barreling. Conversely, in the later stages of deformation, the contact area significantly increased, leading to higher deformation loads and stress. At 850°C, the elevated true stress in the latter half was due to increased contact area between the sample and the anvil, not work hardening. In the tensile test, true stress exhibited a slight decline, markedly different from the compressive test. The minor drop in true stress suggested dynamic recovery, as dynamic recrystallization was improbable. Roy et al. presented a true stress–true strain curve based on a compressive test at 850°C and 0.01 s−1.19) Their study also witnessed a significant decrease in true stress post-yielding, aligning with the findings of this study. Furthermore, Cai et al.20) reported a decrease in true stress after yielding across the full strain rate range of 0.0005–1 s−1, indicating work hardening. Yamamoto et al.21) reported a true stress–true strain curve at a strain rate of 3 s−1 but suggested that work hardening persisted even at strain rates 10 to 100 times higher than those observed in this study (a strain rate of 3 s−1). However, accurate determination of true stress in compressive deformation is hindered by non-uniform specimen deformation, stemming from friction and internal strain non-uniformity. Consequently, establishing a correlation between the stress-strain curve and metallographic changes such as work hardening, dynamic recovery, and recrystallization is challenging. Therefore, the observed softening phenomenon reported by Roy, Cai, and Yamamoto et al. might not be attributable to work hardening based on metallographic histology.

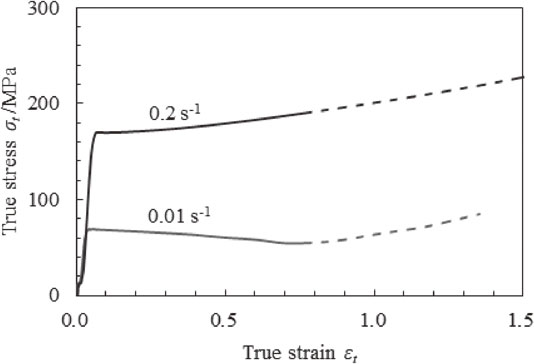
Figure 11 presents the true stress-true strain curve obtained from conducting a tensile test at true strain rates of 0.01 s−1 and 0.2 s−1. Even at 0.2 s−1, the true strain rate experienced a significant increase, with a true strain of 0.8 or higher marked by the dashed line. The yield stress at 0.2 s−1 measured 164 MPa, approximately 2.4 times that at 0.01 s−1. Furthermore, stress did not decrease at 0.2 s−1 but continued to rise from yield to fracture. These results diverged significantly from the compressive test results reported by Roy, Cai, and Yamamoto et al. at strain rates of 0.01–3 s−1. Considering the simplicity of the shape change and the uniformity of the strain distribution, the tensile test was considered to have obtained a more accurate true stress-true strain curve than that derived from the compressive test.
4. Conclusion
In this study, we applied an image analysis strength test method to a high-temperature tensile test of a Ti–6Al–4V alloy, yielding the following noteworthy results:
-
(1)
Continuous measurement of the specimen’s shape change was achieved, allowing us to obtain the minimum cross-sectional radius a and radius of neck curvature R. This image analysis tensile test method proved effective for high-temperature tensile tests.
-
(2)
Our ability to observe the neck until just before fracture enabled us to calculate both the true stress post-necking and the true stress based on Bridgman’s equation. Consequently, we obtained a remarkably precise true stress–strain curve up to a true strain of 0.8, where the true strain rate remained nearly constant.
-
(3)
Comparing the true stress–true strain curve of the Ti–6Al–4V alloy obtained through conventional compressive testing at 850°C, which displayed a stress decrease immediately after yielding across a wide range of strain rates, with the image analysis of the tensile test, showed a stark difference. In the compressive test, stress reduction occurred due to the influence of barreling.
-
(4)
The high-temperature image analysis of the tensile test results remained unaffected by friction or temperature distribution. Furthermore, in terms of achieving a uniform strain distribution within the sample, this test delivered a more precise true stress–true strain curve up to significant strain extents compared to the compressive test.
Acknowledgments
This research was conducted under the Strategic Innovation Promotion Program (SIP), Phase 1: “Innovative Structural Materials, Development of heat-resistant material creation technology for aircraft engines using innovative processes”; and SIP, Phase 2, “Material revolution with integrated material development system”.
REFERENCES
- 1) JSTP: Fundamentals of Titanium and Its Working, (CORONA PUBLISHING CO., LTD., Tokyo, 2008) pp. 4–7.
- 2) M. Niinomi, T. Kobyashi and I.A. Akmoulin: J. JILM 42 (1992) 605–613. doi:10.2464/jilm.42.605
- 3) T. Choda: J. JILM 65 (2015) 460–465. doi:10.2464/jilm.65.460
- 4) N. Shimizu: Rev. Laser Eng. 38 (2010) 603–608. doi:10.2184/lsj.38.603
- 5) M. Nakajima: J. Jpn. Soc. Precis. Eng. 75 (2009) 941–944. doi:10.2493/jjspe.75.941
- 6) T. Choda, H. Oyama and S. Murakami: Kobe Steel Eng. Rep. 64(2) (2014) 28–32.
- 7) J. Rasti, A. Najafizadeh and M. Meratian: Int. J. ISSI 8(1) (2011) 26–33.
- 8) S.K. Samanta: Int. J. Fract. 11 (1975) 301–313. doi:10.1007/BF00038897
- 9) Y.P. Li, E. Onodera, H. Matsumoto and A. Chiba: Metall. Mater. Trans. A 40 (2009) 982–990. doi:10.1007/s11661-009-9783-7
- 10) R. Ebrahimi and A. Najafizadeh: J. Mater. Process. Technol. 152 (2004) 136–143. doi:10.1016/j.jmatprotec.2004.03.029
- 11) A. Yanagida and J. Yanagimoto: Seisan-Kenkyu 55 (2003) 514–516. doi:10.11188/seisankenkyu.55.514
- 12) K. Osakada, T. Kawasaki and K. Mori: CIRP Ann. 30 (1981) 135–138. doi:10.1016/S0007-8506(07)60910-X
- 13) K. Shin, S. Chi and N. Kim: J. Mech. Sci. Tech. 24 (2010) 639–648. doi:10.1007/s12206-010-0110-4
- 14) Y. Yoshida: J. JILM 68 (2018) 266–273. doi:10.2464/jilm.68.266
- 15) P.W. Bridgman: Studies in Large Plastic Flow and Fracture, (McGrawHill, New York, 1952) pp. 9–32.
- 16) K. Enami and K. Nagai: Tetsu-to-Hagané 91 (2005) 712–718. doi:10.2355/tetsutohagane1955.91.9_712
- 17) K. Enami and K. Nagai: Tetsu-to-Hagané 91 (2005) 285–291. doi:10.2355/tetsutohagane1955.91.2_285
- 18) N. Murayama, S. Torizuka, T. Hanamura and M. Imagumbai: Tetsu-to-Hagané 98 (2012) 415–424. doi:10.2355/tetsutohagane.98.415
- 19) S. Roy and S. Suwas: J. Alloy. Compd. 548 (2013) 110–125. doi:10.1016/j.jallcom.2012.08.123
- 20) J. Cai, J. Shi, K. Wang, F. Lib, W. Wang, Q. Wang and Y. Liu: Int. J. Mater. Res. 108 (2017) 527–541. doi:10.3139/146.111514
- 21) S. Yamamoto and C. Ouchi: Tetsu-to-Hagané 72 (1986) 595–602. doi:10.2355/tetsutohagane1955.72.6_595