2. Experimental Procedure
2.1 Sample preparation
Samples were prepared by hand layup. Isophthalic unsaturated polyester was impregnated into glass fiber comprising strand mat (CM) and roving cloth (RH) to form seven layers (CM/RH/CM/RH/CM/RH/CM). This was used to form 220 mm × 300 mm × 5 mm plates. In addition to the samples for flexural strength measurement, mass measurement samples of 50 mm × 50 mm × 5 mm were cut from the plates to measure continuously the mass change. In addition, waterproofing material (Araldite manufactured by Hartzman Japan, Kobe, Japan) was applied to the cut surface of each sample because exposed fibers in the cross section of the sample would be a route for moisture penetration.17)
2.2 Solution immersion test
In a MH environment, we conducted immersion tests to evaluate the degradation characteristics using a calcium hydroxide solution adjusted to pH 10.5, which was the highest pH among the investigation results. Although it was reported that groundwater temperature varies from 281 K to 292 K depending on the environment,18,19) the water temperature in the MH was evaluated as 288 K, which is equivalent to groundwater temperature. Four levels of temperature conditions were used including 313 K, 333 K, and 353 K, which represent accelerated conditions. The temperature of the aqueous solution was controlled within ±2 K using a constant temperature/humidity chamber (ESPEC Corp., Osaka, Japan) and a programmable low-temperature constant temperature/humidity chamber (Toyo Seiki Co., Tokyo, Japan). The samples and solutions were placed in airtight containers to prevent dissolution of carbon dioxide from the atmosphere, and immersion tests were conducted. The maximum immersion time was 2012 h, and pH measurements and solution changes were performed at 100-h intervals from the start of immersion until 200 h, and at 200-h intervals until 1200 h. Immersed samples were collected after 200 h, 500 h, and 2012 h, and mass measurements and bending tests were performed. The mass was measured to the nearest 0.1 mg using an Amidia ATY224 (Shimadzu Corporation, Kyoto, Japan).
2.3 Sample observation
2.3.1 Observation of samples before and after immersion test
The surfaces of the samples before and after the immersion test were observed using an optical microscope. Some of the samples were planed using a precision rotary cutter, and the cut surfaces were smoothed by beam processing using a cross-section polisher (IB-19520CCP, JEOL Ltd., Tokyo, Japan), followed by cross-sectional observation using a scanning electron microscope (SEM) (Zeiss Ultra55, Carl Zeiss Co., Ltd., Tokyo, Japan).
2.3.2 Observation of aqueous solution entry pathways
To estimate the diffusion path of the aqueous solution, we attempted ink staining and visualization using elemental analysis of the sample cross section. In the ink staining method, the samples were immersed in a staining solution comprising a water-soluble ink (PILOT Corporation, Tokyo, Japan) dissolved in calcium hydroxide solution at 30% by volume for 200 h at 333 K, and then the surfaces were observed. In the elemental analysis, it was difficult to detect calcium from the calcium hydroxide solution due to the strong background of calcium contained in the glass fiber, so the glass fiber was immersed in a mixed solution of 4% potassium carbonate and 1% potassium bicarbonate adjusted to pH 10.37, and elemental analysis was performed using potassium as a marker. The mixed solution was then immersed in a mixture of 4% potassium carbonate and 1% potassium bicarbonate at pH 10.37. After immersion in the mixture at 333 K for 200 h, point analysis was performed using SEM-energy dispersive X-ray spectroscopy (EDS) (Quantax 400 EDS, Bruker, Yokohama, Japan).
2.4 Bending test
After the immersion test, the samples were placed in an environment of 296 ± 2 K, 50 ± 10% RH for 16 h, and five 10 mm × 100 mm × 5 mm bend samples were excised. Bending tests were conducted in accordance with JIS K 7171 using a precision universal testing machine (Autograph AG-Xplus 50 kN, Shimadzu Corporation, Kyoto, Japan) at the test speed of 2 mm/min, distance of 80 mm between fulcrum points, and a support radius of R5.
3. Results and Discussion
3.1 Results of sample observation
3.1.1 Change in appearance before and after immersion in solution
The changes in surface conditions are shown in Fig. 3. Before the immersion test, coarse scratches were noticeable, but after the immersion test, the scratches became relatively shallow and pore-like bumps of approximately 0.2 mm in diameter were observed on the entire surface of the sample. These are thought to be the result of accelerated hydrolysis of the resin in the areas of the sample surface in contact with the aqueous solution, which is presumably accelerated by the alkali.11,13,20) Figure 4 shows the changes in the appearance of the samples after immersion in the test solution at 353 K. A yellowish discoloration of the samples was observed as the test time elapsed. The yellowing of the samples over time clearly indicates that chemical changes have progressed. In addition, white streaks with random orientations were observed in the results after 2012 h, which are assumed to be the glass fibers in the CM layer. It can be inferred that moisture reached at least the topmost glass fiber layer, and that moisture penetrated the resin-fiber interface and dissolved the interface.

Figure 5 shows the results of secondary electron images of a GFRP cross-section using the SEM. The white curve in Fig. 5 shows the exfoliated area at the resin-fiber interface, which can be seen in both CM and RH glass fiber layers. Figure 6 shows the back scattered electron image of a magnified view of the delaminated area in Fig. 5(B). In Fig. 6, the delaminated area can be observed as a black curve, confirming that it is formed along the fiber. Delamination at the resin-fiber interface was observed even before the immersion test and did not increase significantly after 2012 h. Furthermore, the delamination was not concentrated in a specific layer, but was distributed over the entire cross-section of the sample. Therefore, the delamination observed here was mainly caused by shrinkage stress during resin curing, without distinction between CM and RH. The delaminated areas formed in this case are non-uniform penetration paths due to capillary action, as opposed to uniform diffusion paths through the resin in the case of a moisture penetration pattern such as that through capillary action.

Figure 7 shows the appearance of new samples before and after immersion in the solution after they were fractured by the bending test. In both samples, a fracture progressed from the tensile side in the flexural test. The cross-sectional photographs in Fig. 7 show that the fracture progressed in a staircase-like pattern, and glass fibers protruding from the resin were observed. The top view shows a white discolored area around the crack, which is assumed to be an area where the fiber and resin have delaminated, indicating that the glass fiber protrusion occurred over a wide area and that the adhesion at the resin-fiber interface was degraded.
3.1.4 Observation results after ink staining
Figure 8 shows the observation results of the sample surface after ink staining. Since the ink adhered to the glass fiber surface inside the sample, this indicates that the resin-fiber interface was the preferential route for the aqueous solution to penetrate. However, the resin-fiber interface was stained only when the glass fiber was partially exposed from the sample surface.
3.1.5 SEM-EDS analysis immersion in potassium mixed solution
Figure 9 shows the analysis targets using SEM-EDS. In Figs. 9(a) and 9(b), potassium is detected at a depth of approximately 10 µm from the surface layer of the new sample. In the area including continuous defects from the sample surface layer in Fig. 9(b), potassium is detected to a depth of 60 µm in the vicinity of the defects. In Fig. 9(c), potassium is detected at a depth of approximately 10 µm from the sample surface layer as in Figs. 9(a) and 9(b). However, no potassium is detected in the vicinity of the defects due to the absence of a continuous penetration path from the sample surface despite the presence of defects in the sample interior. These observations confirm the existence of a uniform penetration path from the sample surface layer into the bulk resin and non-uniform diffusion through defects such as delamination at the resin-fiber interface. From the above results of the ink staining test and potassium detection, it can be inferred that the non-uniform diffusion pathway, although not large in proportion, quickly penetrates deep inside the sample and serves as a starting point for uniform diffusion to begin from inside the resin. Such non-uniform diffusion pathways are thought to be the cause of statistical variation in mass change and bending strength change.
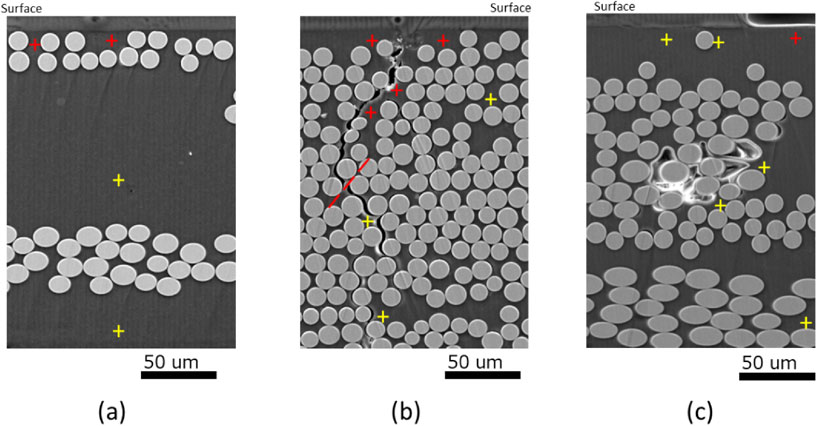
Figure 10 shows the change in mass after the end of immersion. The mass of all samples increased after 2012 h compared to that before the test. After 500 h, a decrease in mass was observed presumably due to elution of residual bubbles in the resin and non-uniform penetration through the resin-fiber interface, suggesting a complex mass behavior. The mass-change behavior is considered to be complex due to the effects of residual bubbles inside the resin and non-uniform penetration through the resin-fiber interface.
3.3 Change in bending strength
The change in residual flexural strength (RS) is shown in Fig. 11. The plot is the average of the measured values of five samples. It is clear that the decrease in RS is greater at higher temperatures, but the increase in RS is observed at the earlier stages of the test at 288 K and at the beginning of the 313 K conditions.
3.4 Penetration of aqueous solution into sample
The penetration of aqueous solution into the sample causes degradation of the glass fiber, resin, and resin-fiber interface, so its behavior is important for estimating the degradation behavior of GFRP. The degree of penetration of the aqueous solution can be estimated from the change in mass. The initial stage of the immersion test, which exhibits a linear increase in mass in Fig. 10, is a region where the mass increases in proportion to the square root of time according to Fick’s law, making it possible to derive an apparent diffusion coefficient. If the diffusion of moisture in resin follows Fick’s law, the diffusion equation is expressed as follows, where D is the diffusion coefficient, c is the material concentration, x is the direction of plate thickness, and t is time.
| \begin{equation*}
\frac{\partial c}{\partial t} = D\frac{\partial^{2}c}{\partial x^{2}}
\end{equation*}
|
Assuming a flat plate of thickness 2L and that the surface concentration is kept at c0, the diffusion equation can be transformed by the Laplace transform into the following equation.22)
| \begin{align*}
c &= c_{0}\sum_{n = 0}^{\infty}(-1)^{n}\,\mathit{erfc}\left\{\frac{(2n + 1)L - x}{2\sqrt{Dt}}\right\} \\
&\quad + c_{0}\sum_{n = 0}^{\infty}(-1)^{n}\,\mathit{erfc}\left\{\frac{(2n + 1)L + x}{2\sqrt{Dt}}\right\}
\end{align*}
|
The relationship between the amount of substance Mt, diffused by time t and concentration c is given by the following equation.
| \begin{equation*}
M_{t} = \int_{-L}^{L}c(t)\,dx
\end{equation*}
|
The above equations can be summarized as follows.
| \begin{align*}
M_{t} &= \int_{-L}^{L}c(t)\,dx\\
& = 4c_{0}\sqrt{Dt} \left[i\,\mathit{erfc}(0) + 2\sum_{n = 1}^{\infty}(-1)^{n}\,i\,\mathit{erfc}\left\{\frac{nL}{\sqrt{Dt}}\right\}\right]
\end{align*}
|
where water absorption M∞ = 2Lc0 at t = ∞. Furthermore, it can be summarized as follows.
| \begin{equation*}
\frac{M_{t}}{M_{\infty}} = 2\sqrt{\frac{Dt}{L^{2}}} \left[\frac{1}{\sqrt{\pi}} + 2\sum_{n = 1}^{\infty}(-1)^{n}\,i\,\mathit{erfc}\left\{\frac{nL}{\sqrt{Dt}}\right\}\right]
\end{equation*}
|
The first half of diffusion can be regarded as a proportional expression of the square root of time, and the diffusion coefficient can be derived from the test time, mass, and sample thickness.17,23)
| \begin{equation*}
\frac{M_{t}}{M_{\infty}} =
\begin{cases}
\qquad\qquad \qquad 2\sqrt{\dfrac{Dt}{L^{2}\pi}}, & \text{$0 \leq t \leq t_{0.5}$}\\
1 - \dfrac{8}{\pi^{2}} \cdot \exp\left[-\dfrac{\pi^{2}Dt}{4L^{2}}\right], & \text{$t_{0.5} \leq t \leq t_{\infty}$}
\end{cases}
\end{equation*}
|
The respective diffusion coefficients are derived by substituting the maximum mass measured during the test period and the results of the mass measurement at 200 h for the equation at 0 ≤ t ≤ t0.5 for each condition of the immersion test. The results are given in Table 1. These derived results are comparable to those of previous studies,21,23–25) indicating that the water absorption behavior of GFRP follows Fick’s law of diffusion, at least in the initial stage of the test. From the ink staining test and elemental analysis after immersion in the potassium mixture, it can be inferred that defects that serve as pathways for non-uniform diffusion, such as capillary action, occur in continuous defects from the sample surface, and their effects appear only immediately after immersion in the solution. Therefore, the primary mode of water penetration into GFRP is uniform diffusion of water in the resin, and non-uniform and rapid water penetration such as capillary action occurs only under limited conditions where defects such as delaminated resin-fiber interfaces are continuously present from the sample surface. Although the influence of defects such as the resin-fiber interface on water penetration is limited, as shown in Fig. 8, the resin-fiber interface is the preferential target of degradation due to moisture arriving through uniform diffusion. As shown in Fig. 9, solute ion potassium is detected at approximately 10 µm on the sample surface layer, but the water content reaches 60% under the test conditions of 333 K for 200 h, and the solvent water penetrated deep into the resin bulk. Water, the solvent, penetrated deep into the bulk of the resin. Therefore, the solute ions have a lower diffusion coefficient in the bulk of the resin than the solvent, and their effect is delayed from the mass change and limited to the surface layer of the sample in the measurement range in this study.

Table 1 Calculation results of diffusion coefficient of water in GFRP at each temperature.
Assuming defect-free GFRP, the water absorption behavior of a sample can be estimated by diffusion according to Fick’s law, and it is possible to estimate degradation characteristics from the water absorption behavior. For example, in GFRP with an epoxy resin matrix, a correlation between weight gain due to water absorption and residual strength was observed.15) However, as shown in Fig. 12, no clear proportional relationship is observed between the increase in mass and the decrease in flexural strength in this study. This is due to the preferential degradation of the resin-fiber interface as confirmed in Fig. 8, the parallel progression of mass loss due to the elution of low molecular weight components accompanying hydrolysis, and the fact that the measured flexural strength at 288 K and 313 K is higher than the initial flexural strength, as shown in the results of the flexural strength measurements at 288 K and 313 K. In Fig. 11, no post-hardening is observed in the test results at 333 K and 353 K. It is possible that the hardening reaction was completed during the 200 h immersion test. In the case of GFRP with a vinyl ester matrix, post-curing at 353 K for 16 h increased the flexural strength by approximately 20%,26) and in the case of GFRP with an epoxy matrix, a salt spray test at 313 K for 1000 h increased the tensile strength by approximately 10%.27) Therefore, it is necessary to verify the effect of moisture diffusion on property degradation based on Fick’s law by clarifying the relationship between mass change and flexural strength in samples that have been confirmed to have completed post-curing.

The RS measurement results shown in Fig. 11 show no decrease in RS at 288 K, the MH environment, but rather an increase. Therefore, the degradation behavior cannot be estimated by extrapolating an approximate curve to the measurement results under 288 K conditions. Consequently, in this study, the change in flexural strength under 288 K conditions was estimated based on Arrhenius law from the degradation behavior under multiple temperature conditions, including accelerated degradation conditions at higher temperatures.
If the degradation of a sample is solely due to water diffusion, the degradation behavior is based on the power law, but in this study, the application of the power law is not appropriate because of the large influence of hydrolysis. Therefore, we decided to use a logarithmic approximation that fits well with the results of RS measurements under temperature conditions of 313 K to 353 K, as shown in Fig. 13.
3.6.1 Estimation using logarithmic approximation
In this study, we applied Heitmann’s property estimation equation,28) which uses a logarithmic function to account for the induction period of moisture diffusion into the composite. The property estimation equation is shown in the following equation.
| \begin{equation*}
P = P_{0} - f(T)\ln\left(\frac{t}{\tau}\right)
\end{equation*}
|
Here, P is the characteristic value, P0 is the initial characteristic value, f(T) is the slope of the experimental equation for characteristic change, and t is the immersion time. Term τ is the time required for sufficient water to penetrate the FRP to start degradation and is referred to as the induction period. When α, β, γ, and δ are constants, τ and f(T) are described by the following equations.
| \begin{equation*}
\ln\left(\frac{1}{\tau}\right) = \alpha - \frac{\beta}{T}
\end{equation*}
|
| \begin{equation*}
\ln(f(T)) = \gamma - \frac{\delta}{T}
\end{equation*}
|
The Arrhenius plots for τ and f(T) are shown in Fig. 14 and Fig. 15, respectively. Time t1/2 to reach 50% RS at 288 K is calculated using each of the derived constants, and time t1/2 is calculated to be 21 years. The coefficients for each temperature and the estimated results are given in Table 2. The logarithmic approximation is sometimes used to predict long-term degradation based on short-term test results. However, it has the problems that the initial value cannot be included in the estimation because the intensity at the 0-h point asymptotically approaches infinity, and the estimation is not based on degradation mechanisms such as diffusion and chemical reaction.29) In the estimation in this study, as shown in Fig. 15, f(T), which indicates the rate of degradation, is smaller at higher temperatures, a result that is reversed from the general degradation phenomenon. This may be due to a problem in the application of the logarithmic approximation described above. For more appropriate estimation, it is desirable to increase the number of measurement points in the initial stage of the test and to have a test period of one year or longer.


Table 2 Calculation results of slope (F(t)), incubation period (τ), and time until flexural strength is reduced by half (t1/2).
To eliminate the problem of f(T) being smaller at higher temperatures, a method such as the Time Shift Factor27) can be used to estimate f(T) based on the Arrhenius law from the ratio of the time required for f(T) to decrease to a given RS for each temperature condition. This method focuses on a specific time until the RS drops to an arbitrary value rather than the change over time, making it difficult to express the degradation behavior as a function, but it can address the problem of a small number of measurement points. In this study, t1/2 at 288 K is calculated based on the Arrhenius law by considering the inverse of the time until the RS drops to 50% as the degradation rate, and the result is derived as 16.3 years.
Based on the above, the period until the RS of hand layup material with 7 glass fiber layers and 5 mm thickness is reduced by half is estimated to be 16.3 years to 21.0 years at 288 K and pH 10.5. Compared to the GFRP sluice gate used in an actual environment where neutral conditions are presumed, and which had been in use for more than 30 years and showed no significant degradation,30) the weak alkaline conditions in this study clearly show the effects of chemical degradation, as indicated by the color change in Fig. 4. Although the range of influence of alkali ions is limited to the surface layer of the sample as shown in Fig. 9, the estimation of RS degradation is also considered reasonable because the degradation of the sample surface layer, which is the fracture starting point, is considered to have a significant influence on the reduction in flexural strength.


