Materials Processing
Effects of Sulfur Adsorption on Surface Tension of Liquid Copper
2025 Volume 66 Issue 3 Pages 353-357

Details
2025 Volume 66 Issue 3 Pages 353-357
We investigated the effects of temperature and sulfur adsorption on the surface tension of liquid copper using the oscillating droplet method in combination with electromagnetic levitation. At low temperatures, the surface tension of liquid copper decreased with increasing sulfur activity due to sulfur adsorption. However, at high temperatures, the surface tension approached that of pure state value of liquid copper regardless of the sulfur activity owing to the exothermic nature of sulfur adsorption. This led to an initial increase followed by a decrease in the surface tension with increasing temperature. We successfully described the surface tension of liquid copper as a function of temperature and sulfur activity using the Szyszkowski equation. Additionally, we estimated the enthalpy and entropy changes associated with sulfur adsorption on liquid copper.
This Paper was Originally Published in Japanese in Journal of Japan Institute of Copper 63 (2024) 184–188. The English of the abstract and the captions for tables and figures have been modified. Some minor errors in units, numerical values, and eq. (8) have been corrected.

Relationship between surface tension, temperature, and sulfur activity of liquid copper evaluated from experimental results using the Szyszkowski equation, corresponding to eq. (8), with the measurement plots.
The surface tension of liquid copper is a crucial parameter for understanding and controlling various phenomena, such as melt-free-surface topographical changes, Marangoni convection, wetting, and bubble nucleation and flow in melts during high-temperature melt processes such as brazing and casting. Accurate measurement of the surface tension of liquid copper requires accounting for the strong surface-active effects of sulfur [1, 2].
Sulfur impurities in copper originate from CuFeS2 in copper ores and copper sulfate solutions used during electrolytic refining. Previous studies [1, 2] on the effects of sulfur adsorption on the surface tension of liquid copper have focused on high sulfur activities, neglecting the low sulfur activities typical of commercial copper. Furthermore, the effect of sulfur adsorption on the temperature dependence of the surface tension of liquid copper remains unclear, mainly because previous measurements have been conducted at low temperatures. Further, the surface-active effects of atmospheric oxygen, present as a gas-phase impurity, must be considered during the measurements [2–15].
In this study, we employed electromagnetic levitation (EML) to measure the surface tension of liquid copper at temperatures exceeding those previously explored [12–17]. This technique prevents sample contamination by supporting materials, even at high temperatures. This study aimed to elucidate the temperature dependence as well as the effect of sulfur activity on the surface tension of liquid copper across a broader range of temperature than previously investigated.
We used two types of copper samples with nominal purities of 99.9999 at% (6N Cu, JX Advanced Metals Co., Japan) and 99.99 at% (4N Cu, Kojundo Chemical Lab. Co. Ltd., Japan) in this study. The 6N Cu samples were 2-mm cubes, while the 4N Cu samples were cylinders measuring ϕ3 mm × 5 mm. Table 1 shows the concentrations of major impurities in these samples determined by glow discharge mass spectrometry. Notably, the sulfur content in 6N Cu was below the detection limit, while 4N Cu contained ∼20 at. ppm of sulfur.
;%0A%09%09%09newWindow.document.open();%0A%09%09%09newWindow.document.write('<img src=%22./Graphics/MT-D2024010tab01.jpg%22>');%0A%09%09%09newWindow.document.close();%0A%09%09)
The sample surfaces were chemically cleaned in a 2.8-w/v% Nital solution using an ultrasonic cleaner, followed by acetone rinsing. The cleaned 6N and 4N Cu samples were sulfurized by sealing them with a high-purity sulfur (99.99 at%) in a container at room temperature. The sulfur content in the samples was controlled by varying the exposure time with the sulfur reagent during sealing from 0 to 120 h. After sulfurization, the samples were cleaned with acetone and 400–600 mg of the samples were placed on a quartz glass holder in the EML setup.
The atmosphere inside the EML chamber was replaced with an Ar–He–10 vol% H2 gas mixture, which has a nominal dew point lower than −193 K. The oxygen partial pressure ($P_{\text{O}_{2}}$) of the gas mixture at the chamber inlet was ∼2.0 × 10⁻²⁴ Pa, measured using a zirconia-type oxygen sensor operating at 1008 K. The sulfurized samples were electromagnetically levitated simultaneously and melted into a single droplet in the presence of the gas mixture at a flow rate of 2 L·min−1. The droplet temperature was controlled by adjusting the partial pressures of Ar and He gases having different thermal conductivities using a monochromatic pyrometer. The emissivity setting of the pyrometer was adjusted such that the plateau temperature of the liquid phase during sample melting was equal to the equilibrium melting point of copper (1358 K). Once the droplet temperature stabilized, its oscillation was monitored from above using a high-speed video (HSV) camera at 500 fps for 16.4 s. The levitated droplet was then immediately quenched with He gas at a flow rate of 20 L·min−1 to retain the sulfur content even after solidification. The sulfur content of the solidified sample was analyzed using the oxygen stream combustion–infrared absorption method. Further details on the EML facility are available in a previous report [13].
The frequencies of surface oscillations (m = 0, ±1, and ±2 for the l = 2 mode) and those of the center of gravity (m = 0 and ±1 for the l = 1 mode) were determined from the time-sequential data of the HSV images using fast Fourier transform (FFT). The analysis accounted for apparent rotations caused by phase differences between m = +1 and m = −1 and m = +2 and m = −2, alongside actual rotations [18, 19]. The surface tension of liquid copper was calculated from these frequencies using the Rayleigh equation [20] and the Cummings and Blackburn calibration [21]. The density of liquid copper used in the calculation was determined using Brillo et al.’s equation (eq. (1)) [22]:
| \begin{equation} \rho = 7900 - 0.7650(T - 1357), \end{equation} | (1) |
where ρ indicates the density [kg·m−3] and T denotes the temperature [K].
The surface tension of liquid copper is influenced by $P_{\text{O}_{2}}$ because oxygen acts as a strong surfactant. However, at the melting point, the effect of $P_{\text{O}_{2}}$ on the surface tension decreases when $P_{\text{O}_{2}} < {\sim} 10^{ - 11}$ Pa, despite increased oxygen adsorption at low temperatures [7–11]. To clarify the effect of sulfur adsorption on the surface tension of liquid copper without oxygen adsorption, we reduced $P_{\text{O}_{2}}$ to less than 10−11 Pa by establishing gas-phase equilibrium between H2 and H2O.
| \begin{equation} \text{H$_{2}$(g)} + \frac{1}{2}\text{O$_{2}$(g)} \rightleftarrows \text{H$_{2}$O(g)}, \end{equation} | (2) |
| \begin{equation} \Delta G_{\text{H${_{2}}$O}}^{\circ} = - 246\,535 + 54.94T\quad [\text{J${\cdot}$mol$^{-1}$}]\ [24]. \end{equation} | (3) |
The partial pressure of water vapor ($P_{\text{H}_{2}\text{O}}$) in the Ar–He–10 vol% H2 gas mixture was calculated as ∼5 × 10⁻² Pa using Sonntag’s equation [25] based on a nominal dew point of approximately −193 K. This value is significantly lower than the partial pressure of hydrogen ($P_{\text{H}_{2}} \approx 10^{4}$ Pa) in the Ar–He–10 vol% H2 gas mixture, suggesting that the $P_{\text{H}_{2}\text{O}}/P_{\text{H}_{2}}$ ratio remains constant across temperatures. Consequently, $P_{\text{O}_{2}}$ was calculated to be less than 10−11 Pa at <2000 K based on the temperature dependence of the standard Gibbs energy for H2O (g) formation and the measured $P_{\text{O}_{2}}$ value of ∼2.0 × 10⁻²⁴ Pa using the zirconia-type oxygen sensor operating at 1008 K. Thus, we measured the surface tension of liquid copper at <2000 K.
Figure 1 illustrates how the surface tension of liquid copper varies with changes in temperature and sulfur content. The sulfur content in the sample was analyzed after surface-tension measurements. The measured sulfur content (at. ppm) is indicated on several representative surface-tension plots for easy reference. We successfully measured the surface tension across a wide temperature range (1240–1990 K), including undercooling conditions.

Surface tension of liquid copper free from oxygen adsorption as a function of temperature and sulfur content. (online color)
The surface tension of liquid 6N Cu with the sulfur content below the detection limit (○), decreases linearly with increasing temperature, aligning well with our previous results for the surface tension of liquid copper with 99.98 at% purity containing <1 at. ppm sulfur and free from oxygen adsorption [16].
When the sulfur content is increased to 11 ± 5 at. ppm (□ and ■), the surface tension becomes lower than that of liquid 6N Cu at low temperatures. However, with increasing temperature, the surface tension increases, gradually approaching that of liquid 6N Cu and becoming nearly equivalent the surface tension of liquid 6N Cu at >1600 K. This is because sulfur desorbs from the melt surface at high temperatures owing to the exothermic nature of its adsorption, although sulfur adsorption reduces the surface tension of liquid copper at low temperatures. Therefore, the surface tension measured at high temperatures represents the pure-state surface-tension values in the absence of sulfur and oxygen adsorption. Results further reveal that the surface tension of liquid 4N Cu (■) is slightly lower than that of sulfurized 6N Cu at low temperatures, despite equivalent sulfur contents in these samples (11 ± 5 at. ppm).
Further increase in the sulfur content decreases the surface tension of liquid copper at low temperatures, but the value invariably aligns with those of liquid 6N Cu as the temperature increases, regardless of the sulfur content. Furthermore, sulfurized samples exhibit almost identical surface tension–temperature relationships when the sulfur content is consistent, regardless of initial purity levels (4N or 6N Cu) prior to sulfurization.
We measured the surface tension of liquid copper as a function of temperature and sulfur content using the oscillating droplet method with EML under conditions involving negligible effect of oxygen adsorption. To numerically describe the effects of temperature and sulfur activity on the surface tension of liquid copper as well as determine the changes in enthalpy and entropy during sulfur adsorption on liquid copper, we employed the Szyszkowski equation [23]:
| \begin{equation} \sigma^{\text{P}} - \sigma = RT\varGamma_{\text{S}}^{\text{sat}}\ln(1 + k_{\text{ad}}a_{\text{S}}), \end{equation} | (4) |
where σP is the pure-state surface tension of liquid copper [10−3 N·m−1], σ denotes the surface tension of liquid copper with sulfur adsorption, R represents the gas constant [8.314 J·K−1·mol−1], $\varGamma_{\text{S}}^{\text{sat}}$ indicates full-coverage sulfur adsorption on liquid copper [mol·m−2], kad represents the equilibrium constant for sulfur adsorption from the melt ($\underline{\text{S}} \rightleftarrows \text{S}_{\text{ad}}$), and aS denotes sulfur activity. Assuming that the liquid sample is a dilute sulfur solution, aS is defined as the molar fraction of sulfur. The Szyszkowski equation effectively describes the effect of surfactants on the surface tension of several metallic melts [12–16, 26].
4.1 Evaluation of the relationship between surface tension, temperature, and sulfur activity for liquid copperAt low temperatures, as shown in Fig. 1, the surface tension of liquid copper decreased with increasing sulfur content owing to sulfur adsorption. However, even at high sulfur contents, the surface tension of liquid copper approached that of liquid 6N Cu, with no detectable sulfur, at higher temperatures due to sulfur desorption. Additionally, the surface tension of liquid 6N Cu decreased linearly with increasing temperature and aligned with the previously reported pure-state surface-tension value of liquid copper, unaffected by oxygen adsorption [16]. We described the temperature dependence of the pure-state surface tension of liquid copper, unaffected by sulfur and oxygen adsorption, using a least-squares approach based on the obtained plots for 6N Cu and sulfurized Cu at high temperatures shown in Fig. 1:
| \begin{equation} \sigma^{\text{P}} = 1319 - 0.234 \cdot (T - 1358)\quad [10^{-3}\,\text{N${\cdot}$m$^{-1}$}], \end{equation} | (5) |
where the intercept (1319 × 10−3 N·m−1) corresponds to the surface tension of copper at the melting temperature (1358 K).
$\varGamma_{\text{S}}^{\text{sat}}$ can be evaluated using the Gibbs adsorption isotherm:
| \begin{equation} \varGamma_{\text{S}}^{\text{sat}} = - \frac{1}{RT}\cdot\frac{\mathrm{d}\sigma}{\mathrm{d}\ln a_{\text{S}}}\ [\text{mol${\cdot}$m$^{-2}$}]. \end{equation} | (6) |
Figure 2 shows the surface tension with respect to the aS of liquid samples free of oxygen adsorption at ∼1400 K. A dashed line indicates σP for comparison. Data reported by Base et al. [1] and Monma et al. [2] are also included for reference. The surface tension of liquid copper decreases with increasing aS, similar to the results reported by Base et al. and Monma et al. Given that the gradient of surface tension with respect to aS stabilizes at ln aS ≈ −5.5 (corresponding to a sulfur content of 4100 at. ppm) and $\varGamma_{\text{S}}^{\text{sat}}$ is unaffected by temperature, $\varGamma_{\text{S}}^{\text{sat}}$ can be evaluated to be 1.121 × 10⁻⁵ mol·m−2 using eq. (6).

Surface tension of liquid copper measured at 1397 ± 10 K as a function of sulfur activity. (online color)
Figure 3 illustrates a van’t Hoff plot showing the relationship between ln kad and the reciprocal of the temperature (1/T) derived from eq. (4) using σP, $\varGamma_{\text{S}}^{\text{sat}}$, and the surface tension of molten sulfurized samples, as depicted in Fig. 1. The ln kad values calculated from the surface tension of molten, sulfurized 4N Cu and 6N Cu samples exhibit a good linear relationship with 1/T. This indicates a consistent sulfur adsorption mechanism across the samples regardless of aS and temperature. The temperature dependence of kad can be linearly approximated using the least-squares method for the plots:
| \begin{equation} \ln k_{\text{ad}} = 1.617 \times 10^{4}T^{-1} - 1.492. \end{equation} | (7) |
The ln kad values calculated from the surface tension of molten, nonsulfurized 4N Cu samples (■) lie slightly above the line predicted using eq. (7). Table 1 shows that 4N Cu contains sulfur and other impurities such as Ag, Te, and Se, which have a surface-active effect on liquid copper. The surface-active effects of these additional impurities could have become more pronounced in nonsulfurized 4N Cu, leading to higher calculated ln kad values.

van’t Hoff plot for the equilibrium constant of sulfur adsorption (kad) on liquid copper. Change in the standard enthalpy for sulfur adsorption is calculated to be $\Delta H^{\circ}_{\text{ad}} = - 134.4$ kJ·mol−1 from the slope of the line determined using the least-square approach for the plots. (online color)
Combining the derived values of σP, $\varGamma_{\text{S}}^{\text{sat}}$, and kad for liquid copper, we can now describe the surface tension of liquid copper as a function of temperature and aS using the Szyszkowski equation [23]:
| \begin{align} \sigma &= 1319 - 0.234(T - 1358) - 1.121 \times 10^{-2}RT\\ &\quad \times \ln [1 + \{\exp(1.617 \times 10^{4}T^{-1} - 1.492)\} \cdot a_{\text{S}}]\\ &\quad [10^{-3}\,\text{N${\cdot}$m$^{-1}$}]. \end{align} | (8) |
This equation well reproduces our measurement results on the effects of temperature and aS on the surface tension of liquid copper, as illustrated by the solid line in Fig. 4.
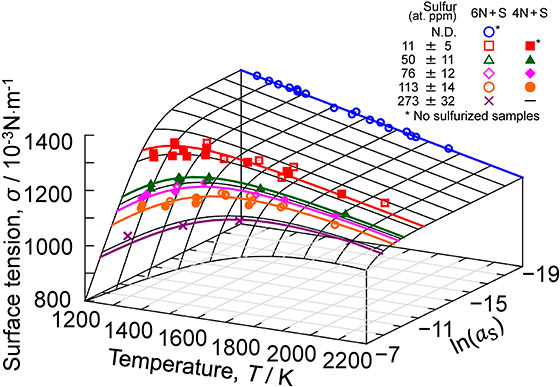
Relationship between surface tension, temperature, and sulfur activity of liquid copper evaluated from experimental results using the Szyszkowski equation (eq. (8)), with the measurement plots. (online color)
A good linear relationship between ln kad and 1/T for molten, sulfurized samples (Fig. 3) allowed us to determine the change in the standard enthalpy for sulfur adsorption on liquid copper as $\Delta H^{\circ}_{\text{ad}} = - 134.4$ kJ·mol−1 based on the slope obtained using eq. (7) according to the following van’t Hoff equation:
| \begin{equation} \frac{\partial (\ln k_{\text{ad}})}{\partial (1/T)} = - \frac{\Delta H_{\text{ad}}^{\circ}}{R}. \end{equation} | (9) |
The negative value of $\Delta H^{\circ}_{\text{ad}}$ confirms that sulfur adsorption on liquid copper is exothermic.
The standard Gibbs energy for sulfur adsorption on liquid copper ($\Delta G^{\circ}_{\text{ad}}$), corresponding to each plot of Fig. 3, can be calculated using the following equation:
| \begin{equation} \Delta G_{\text{ad}}^{\circ} = - RT\ln k_{\text{ad}}. \end{equation} | (10) |
The calculated results of $\Delta G^{\circ}_{\text{ad}}$ presented in Fig. 5 confirm that sulfur adsorbs onto the melt surface within the measurement temperature range, as indicated by the negative value of $\Delta G^{\circ}_{\text{ad}}$. From the slope of $\Delta G^{\circ}_{\text{ad}}$ vs. temperature, linearly approximated using the least-squares method, the change in the standard entropy for sulfur adsorption on liquid copper ($\Delta S^{\circ}_{\text{ad}}$) is estimated to be −12.93 J·mol−1·K−1. This value closely aligns with the calculated results of −12.40 J·mol−1·K−1 using eqs. (7) and (10). The discrepancy between these values is attributed to the more significant influence of uncertainty in the surface tension measurements affecting the calculations for Fig. 5 compared to those for Fig. 3.

Temperature dependence of changes in the Gibbs energy for sulfur adsorption on liquid copper. Change in the standard entropy for sulfur adsorption was calculated to be $\Delta S^{\circ}_{\text{ad}} = - 12.93$ J·mol−1·K−1 from the slope of the line determined using the least-square approach for the plots. (online color)
The surface tension of molten, sulfurized copper was measured in a levitated state using EML across a wide temperature range (1240–1990 K), including undercooling conditions. We found that sulfur adsorption decreased the surface tension of liquid copper at low temperatures, while at high temperatures, the surface tension increased, approaching that of pure state value due to sulfur desorption. The measurements revealed the temperature dependence of the pure-state surface tension of liquid copper, which was free from the effects of sulfur and oxygen adsorption. The full-coverage sulfur adsorption on liquid copper ($\varGamma_{\text{S}}^{\text{sat}}$) was deduced using the Gibbs adsorption isotherm. Furthermore, the temperature dependence of the equilibrium constant of sulfur adsorption on liquid copper (kad) was evaluated using the Szyszkowski equation. Consequently, the surface tension of liquid copper was expressed as a function of temperature and sulfur activity. Additionally, changes in the standard enthalpy and entropy for sulfur adsorption on liquid copper were derived from kad.
This study was partially funded by research grants from the Japan Institute of Copper for the years 2022 and 2023. Part of this study was also financially supported by JSPS KAKENHI under Grant No. JP20H02453.