Abstract
Commercially pure titanium rolled sheets with different grain sizes of 20, 50, and 80 µm were applied to tensile tests to investigate the effects of grain size on the relationship between mechanical properties and activities of slip systems. While the ductility was independent of grain size, the activity of first order pyramidal slips and second order pyramidal slips decreased with decreasing grain size. In addition, grain boundary sliding was found to contribute to ductility when the grain size was small. Prismatic slips were activated in all of the specimens when yielded. Activity of pyramidal slips increased with increasing strain and decreased with decreasing grain size. Tensile tests were interrupted and slip lines were observed after the unloading in this study. Yield stress increment was observed when reloaded in interrupted tensile tests, but not in immediate reloading tensile tests. We found room temperature strain aging in pure titanium sheets. Yield stress increment increased with increasing strain.
This Paper was Originally Published in Japanese in J. JILM 74 (2024) 421–426.
1. Introduction
Titanium (Ti) has high specific strength, high ductility, and high corrosion resistance, and is therefore widely used in the aerospace industry, medical and dental implants, etc. [1–3]. Ti is generally classified into two types: α-Ti and β-Ti. α-Ti is mainly used for industrial applications. Here, α-Ti has a hexagonal close-packed (HCP) structure. Therefore, investigating the deformation mechanism in Ti with an HCP structure is required to further improve its strength and ductility. The main slip system of Ti is $\{ 10\bar{1}0\} \langle 11\bar{2}0\rangle $ prismatic slip (PS) [4]. However, the activation of PS by itself is insufficient for the von Mises criterion that five independent slip systems are required to deform a crystal to any arbitrary shape, and therefore never explain the excellent ductility of Ti. Pyramidal slips: $\{ 10\bar{1}1\} \langle \bar{1}\bar{1}23\rangle $ first order pyramidal ⟨c + a⟩ slip (FPCS) [5] and $\{ 11\bar{2}2\} \langle \bar{1}\bar{1}23\rangle $ second order pyramidal ⟨c + a⟩ slip (SPCS) [6] must be individually or simultaneously activated for the strain in the c-axis direction, as well as $\{ 10\bar{1}2\} $ twinning, $\{ 11\bar{2}1\} $ twinning, $\{ 11\bar{2}2\} $ twinning [7] and $\{ 10\bar{1}1\} $ twinning [8].
Paton et al. [9] performed c-axis compression tests on pure Ti single crystals with oxygen contents of 0.056–0.07 at% at temperatures ranging from 298 to 1073 K, and reported that PS was activated at all the test temperatures. Naka et al. [10] performed c-axis compression tests on pure Ti single crystals with oxygen contents of 0.15–0.70 at% at temperatures ranging from 77 to 700 K, and reported that the critical resolved shear stress (CRSS) for PS increased with increasing oxygen content in the specimens. They also concluded that FPCS plays a role in the deformation of Ti polycrystals especially at high temperatures, since it contributes to 60% of the c-axis compression strain at 673 K and 90% at 1073 K. Minonishi et al. [5] performed room-temperature tensile tests on commercial purity Ti with an oxygen content of 0.25 at% and a mean grain size of 30 µm, and reported that FPCS was activated. Furthermore, TEM observations suggest that the source of FPCS is grain boundaries. In addition, Minonishi et al. [6] performed c-axis compression tests on pure Ti single crystals with an oxygen content of 0.5 at% at temperatures ranging from 300 to 1100 K, and reported that SPCS was activated through slip line analysis and TEM observations.
Recently, Wang et al. [11] performed tensile tests at room temperature on commercially pure Ti with an oxygen content of 0.48 at% and a mean grain size of less than 100 µm using a high-energy X-ray microscope, and reported that the CRSS for PS, $\{ 0001\} \langle 11\bar{2}0\rangle $ basal slip (BS), and $\{ 10\bar{1}2\} $ twins were 96 ± 18 MPa, 127 ± 33 MPa, and 225 MPa, respectively. They also suggested that the CRSS for FPCS was expected to be more than 240 MPa and FPCS was activated as a secondary slip. Arima et al. [12] performed tensile tests on rolled pure Ti sheets with an oxygen content of 0.42 at% and a mean grain size of 280 µm at room temperature, and reported that FPCS, SPCS, and $\{ 11\bar{2}2\} $ twins occurred from grain boundaries after slip line observations. Thus, many studies on slip systems in Ti have been reported; however, the relationship between slip activities and mechanical properties is unclear in polycrystalline Ti. In addition, the slip and twin activities must be related to grain boundaries; however, the relationship is also unclear.
In this study, room temperature tensile tests on rolled pure Ti sheets with different crystal grain sizes were performed to investigate the relationship between the slip activities and mechanical properties in Ti. Room temperature strain aging was observed during slip line observations in this study. Since similar behaviors have not been reported previously, we also investigated the effects of grain size and strain amount on room temperature strain aging.
2. Experimental Procedures
JIS Class 1 rolled pure Ti sheets (TP270) were rolled by 0.2 mm per pass at 373 K, and the final rolling reduction was 70%. The rolled sheets were vacuum sealed in a quartz tube using a rotary pump and then annealed at 1023 K for a holding time ranging from 0.3 to 40 ks. Normal direction (ND) plane was mechanically polished using emery papers (#150–1000), and finished to a mirror surface with a buff polishing machine using a chemical polishing solution (colloidal silica suspension:ammonia solution:hydrogen peroxide solution = 94:3:3). In addition, the mirror-polished sheets were etched three times with a solution (nitric acid:hydrofluoric acid:water = 1:2:17) for 3 s, and the mean grain size was measured by the intercept method. Figure 1 shows the relationship between the annealing time and the mean grain size. Three types of Ti sheets with different mean grain sizes were applied to tensile tests: T20 (the grain size was 18–22 µm and the annealing time was 0.3 ks), T50 (54–73 µm and 10 ks), and T80 (76–85 µm and 30 ks).

Figure 2 shows a schematic illustration of a dog-bone-type specimen for tensile tests with a gauge section of 2 × 3 × 15 mm3, and the tensile direction was parallel to the rolling direction (RD). To identify crystal orientations of ND planes before tensile tests, EBSD (electron backscatter diffraction patterns) analysis was performed using a field emission type scanning electron microscope (JEOL Ltd. JIB-4601F) and TSL OIM Analysis 7 (TSL Solutions Corporation).
Tensile tests were performed using a Shimadzu tensile testing machine (Shimadzu Corp. AGS-10KNX) at room temperature and an initial strain rate of $\dot{\varepsilon } = 1.1 \times 10^{ - 3}$/s (crosshead speed = 1 mm/min). The number of specimens used for the tensile test was 5 for T20, 6 for T50, and 4 for T80. The strain was calculated using the gauge length.
Slip lines were observed on the ND plane with an optical microscope. The activated slip system was identified using the direction of the slip lines and the crystal orientation of grains analyzed by the EBSD measurements before tensile tests. Since the mechanical properties such as strength depend on the oxygen content in Ti, the content in as-received, rolled, and annealed Ti sheets were measured using an oxygen and nitrogen analyzer (HORIBA Ltd. EMGA-820). The oxygen content in all the sheets was constant at approximately 0.11 at%. Figure 3 shows (0002) and $(10\bar{1}0)$ pole figures of (a) T20, (b) T50, and (c) T80. Rolled Ti sheets have been reported to have a texture with the c-axes inclined 20 to 30 degrees from the ND to the transverse direction (TD) [13]. A similar split texture was also observed in this study. On the other hand, the intensity was found to decrease with decreasing grain size. The texture intensity has been reported to increase with increasing annealing time in rolled Ti sheets [14], corresponding to the results of this study. The grain growth of crystal grains with preferred orientations probably occurs with increasing annealing time and leading to the high texture intensity.

3. Results and Discussion
3.1 Stress-strain curve
Figure 4 shows nominal stress-nominal strain curves of T20, T50, and T80. The horizontal arrows in Fig. 4 indicate the 0.2% proof stress σ0.2. Necking occurred after the maximum stress σmax, and the crack slowly propagated and fractured at the point indicated by × in all the specimens. σ0.2, σmax, and σf were 160 MPa, 275 MPa, and 61% in T20. T20 showed a rapid work hardening after yielding, then deformed at nearly constant stress and finally fractured. σ0.2 of T50 was 156 MPa smaller than that of T20. The curve of T50 differs from that on T20 and shows work hardening. T50 reached at σmax of 319 MPa, and then fractured at εf of 60%. σ0.2 of T80 was 146 MPa smaller that of T50. After yielding, T80 shows a similar curve to that of T50 and fractured at εf of 57%. σ0.2 increased with decreasing grain size, while εf of all the specimens was nearly constant and at approximately 60%. In addition, σmax increased due to strain aging: 377 MPa in T20, 384 MPa in T50, and 390 MPa in T80. The details will be described later.

Figure 5 shows the grain size dependence of σ0.2, σmax, and εf. The results of rolled pure Ti sheets with different oxygen contents are also shown for comparison [15, 16]. In the range of oxygen content, σ0.2 increases with decreasing grain size. On the other hand, the effect of grain size on εf was found to be small in the grain size ranging from 20 to 80 µm.
3.2 Frequency of each activated slip system
Figure 6 shows optical micrographs of T20, T50, and T80 after tensile tests. Slip lines caused by PS, FPCS, SPCS, and BS were observed in all the specimens. PS slip lines were more clearly observed than other slip lines. Also, a large number of PS slip lines were observed throughout grains even at small strains. FPCS and SPCS slip lines were also clear but were observed in local areas of grains. BS slip lines were finer, and the observed area was limited, compared to other slip systems. Figure 7 shows the relationship between the frequency of activated slips and the nominal strain ε of T20, T50, and T80. Here, the frequency of activated slips was defined as the ratio of the number of grains with slip lines to the number of observed grains. In Fig. 7, PS, FPCS, SPCS, and BS are indicated by □, ○, △, and ◇. T20, T50, and T80 are indicated by symbols in white, gray, and black. The frequency of PS was approximately 90% in T50 and T80 after yielding. On the other hand, the frequency was approximately 60% in T20; however, it increased and approached that in T50 and T80 at ε = 15%. The frequency of FPCS and SPCS was low at yielding but increased with increasing strain. Also, they decreased with decreasing grain size. The frequency of BS was less than 5% regardless of grain size. Twins were slightly observed in T20 and T50, as shown in Fig. 8, but the frequency was 5% and the area fraction was only 3% of grains.

FPCS and SPCS activities are in this study consistent with the previous study reported by Arima et al. [12]. However, FPCS was found to be activated at a stress which is approximately 200 MPa lower than that reported by Wang et al. [11]. The stress probably depends on the oxygen content in Ti.
3.3 The influence of active slip systems on ductility
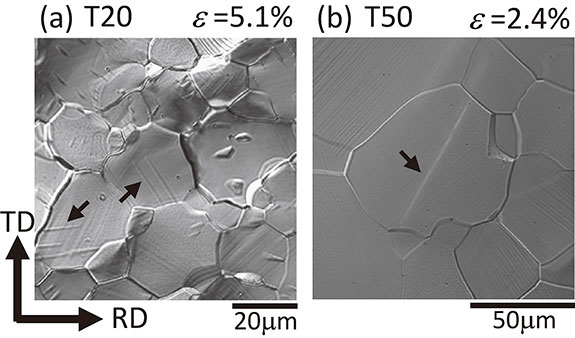
The total frequency of pyramidal slip systems and BS at the maximum strain was 40% in T20, 45% in T50, and 90% in T80, as shown in Fig. 7. Here, the frequency of BS activity was low and less than 5% in all the specimens. Thus, pyramidal slips were more activated with increasing strain in most grains of T80, while the frequency was nearly half in T50 and T20. However, the difference in ductility was small, as shown in Fig. 5. Therefore, other deformation mechanisms except the activation of FPCS and SPCS must contribute to the ductility of T20 and T50. Figure 9 shows optical micrographs of T20, T50 and T80, before and after tensile tests. Compared to the microstructure before and after tensile tests, many steps indicated by the arrows were observed at the grain boundaries in T20 (Fig. 9(b)) and T50 (Fig. 9(d)) after tensile tests. In contrast, similar steps were scarcely observed at grain boundaries in T80 (Fig. 9(f)). In other words, slips within grains solely cause deformation when the grain size is around 80 µm in pure Ti. On the other hand, grain boundary sliding occurs before pyramidal slips are activated and contributes to ductility when the grain size is small. Therefore, T20 deformed at almost constant flow stress as shown in Fig. 4 since the frequency of grain boundary sliding increased. Furthermore, the grain boundary sliding activity was observed immediately after yielding at ε = 0.27% in T20, but not until ε = 35.6% in T50. Therefore, T50 showed similar deformation behaviors to T80 since grain boundary sliding began to activate at a high strain.

Interrupted tensile tests were performed to investigate the activated slip systems at any strains in this study. All the specimens were found to show strain aging at room temperature. As an example, nominal stress-nominal strain curves of T50 are shown in Fig. 10. Figure 10(a) shows a typical stress-strain curve of T50 obtained from conventional tensile tests. Figure 10(b) shows a typical stress-strain curve obtained from interrupted tensile tests to repeatedly unload and reload at any strain in order to observe slip lines. The numbers in Fig. 10 show the time interval between unloading and reloading. Slip lines were observed in the time interval ranging between 1.1 and 65.3 ks after unloading, and then the yield stress increased by approximately 5 to 40 MPa in reloading. As a result, the maximum stress shown in Fig. 10(b) was approximately 100 MPa larger than that shown in Fig. 10(a). Therefore, in order to investigate the effect of the time interval on the stress increment, reloading was performed immediately after unloading in T50 with an intermediate grain size. Figure 10(c) shows a stress-strain curve obtained from the interrupted tensile test without time interval. The curve was similar to Fig. 10(a) and no stress increment was observed. Therefore, strain aging was found to occur even at room temperature. Figure 11 shows the relationship between the yield stress increment Δσ and time interval. Plots in white, gray, and black correspond to T20, T50, and T80. The plot size represents the magnitude of the strain; small: 3% or less; medium: 3 to 20%; and large: 20% or more. Figure 11 shows that a large stress increment was observed even after short time intervals. In addition, the higher strains were relatively distributed at higher Δσ. Figure 12 shows the proportional relationship between the nominal strain and Δσ. Here, the plots for T20, T50, and T80 have the same proportional relationship, showing that the effect of grain size on strain aging at room temperature is small. The stress after reloading was found to increase with increasing strain when the time interval was 1.1 ks or more.

Donoso et al. [17] performed tensile tests on rolled pure Ti sheets at temperatures ranging from 555 to 630 K and observed strain aging at a strain of 0.02. Also, the stress after reloading increased by approximately 5 to 10 MPa with increasing aging time. They concluded that the stress increment occurs by the pinning of oxygen atoms to dislocations due to the Cotterell atmosphere. Δσ and its strain observed in this study were close to those reported by Donoso et al. Dislocation densities increased with increasing strain, and oxygen atoms locked dislocations, resulting in a larger stress increment. Donoso et al. reported that strain aging occurred at test temperatures of 555 K or higher. On the other hand, we found that pure Ti exhibits strain aging even at room temperature.
Donoso et al. reported the diffusion coefficient D of oxygen in pure Ti was 1 × 10⁻¹⁸–1 × 10⁻¹⁷ m2/s at 555–630 K. On the other hand, David et al. [18] estimated that D at room temperature is less than 1 × 10⁻¹⁹ m2/s, which is less than 1/10 of the value reported by Donoso et al. In general, in a single diffusion, the diffusion distance of an atom is expressed as x = (2Dt)1/2. When D = 1 × 10⁻¹⁹ m2/s is used, x is equal to 1.5 × 10⁻⁸ m = 41 a (a: lattice constant = 0.359 nm) at 1.1 ks which is the shortest time interval in this study. If t = 1 s is assumed when reloaded immediately after unloading, x is calculated to be 4.5 × 10⁻¹⁰ m = 1.3a: a is the atomic spacing of Ti. When oxygen atoms are distributed at equal intervals in Ti, oxygen atoms must be distributed at intervals of approximately 10a at an oxygen content of 0.11 at%. Consequently, oxygen atoms could sufficiently lock dislocations in crystals within 1.1 ks after unloading. Therefore, oxygen atoms lock many dislocations introduced by slip deformation in Ti, resulting in that strain aging similar to that reported by Donoso et al. was observed even at room temperature.
In addition to prismatic slip, pyramidal slip systems were also activated in pure Ti. The correlation between strain aging and the slip systems of locked dislocations will be discussed in the near future.
4. Conclusion
Tensile tests were performed on rolled pure Ti sheets (0.11 at%O) to investigate the activated slip systems and their influence on mechanical properties. The main results are summarized below.
-
(1)
In specimens with grain sizes of 20–80 µm, the 0.2% proof stress decreased with decreasing grain size, but ductility did not change significantly.
-
(2)
In all the specimens, prismatic slips were activated at yield points. The frequency of primary and secondary pyramidal slip activity increased with increasing strain, while that of pyramidal slip activity decreased with decreasing grain size. The frequency of basal slip activity was low.
-
(3)
Strain aging was observed at room temperature, and the stress after reloading increased with increasing strain.
Acknowledgements
This study was financially supported by The Light Metal Educational Foundation. The authors are very grateful for the support.
REFERENCES
- 1) S. Jha, C. Szczepanski, R. John and J. Larsen: Deformation heterogeneities and their role in life-limiting fatigue failures in a two-phase titanium alloy, Acta Mater. 82 (2015) 378–395. doi:10.1016/j.actamat.2014.08.034
- 2) M. Geetha, A. Singh, R. Asokamani and A. Gogia: Ti based biomaterials, the ultimate choice for orthopaedic implants – A review, Prog. Mater. Sci. 54 (2009) 397–425. doi:10.1016/j.pmatsci.2008.06.004
- 3) X. Liu, P. Chu and C. Ding: Surface modification of titanium, titanium alloys, and related materials for biomedical applications, Mater. Sci. Eng. R 47 (2004) 49–121. doi:10.1016/j.mser.2004.11.001
- 4) S. Farenc, D. Cailland and A. Couret: An in situ study of prismatic glide in α titanium at low temperatures, Acta Mater. 41 (1993) 2701–2709. doi:10.1016/0956-7151(93)90139-J
- 5) Y. Minonishi and S. Morizono: {1122} ⟨1123⟩ slip in titanium, Scr. Metall. 16 (1982) 427–430. doi:10.1016/0036-9748(82)90166-1
- 6) Y. Minonishi, H. Numakura and M. Koiwa: ⟨1123⟩{1011} slip in titanium polycrystals at room temperature, Scr. Metall. 20 (1986) 1581–1586. doi:10.1016/0036-9748(86)90399-6
- 7) F. Rosi, F. Perkins and L. Seigle: AIME Trans. 206 (1956) 115.
- 8) N. Paton and W. Backofen: Trans. TMS-AIME 245 (1969) 1369.
- 9) N. Paton and W. Backofen: Plastic deformation of titanium at elevated temperatures, Metall. Trans. 1 (1970) 2839–2847. doi:10.1007/BF03037822
- 10) S. Naka, A. Lasalmonie, P. Costa and L. Kubin: The low-temperature plastic deformation of α-titanium and the core structure of a-type screw dislocations, Philos. Mag. A 57 (1988) 717. doi:10.1080/01418618808209916
- 11) L. Wang, Z. Zheng and H. Phukan: Direct measurement of critical resolved shear stress of prismatic and basal slip in polycrystalline Ti using high energy X-ray diffraction microscopy, Acta Mater. 132 (2017) 598–610. doi:10.1016/j.actamat.2017.05.015
- 12) R. Arima, M. Watanabe, M. Tsushida, H. Kitahara and S. Ando: Abstracts of the Conference of JIM, ISIJ and JILM Kyusyu Branches, (2017) P43.
- 13) J. Won, C. Park, S. Hong and C. Lee: Deformation anisotropy and associated mechanisms in rolling textured high purity titanium, J. Alloy. Compd. 651 (2015) 245–254. doi:10.1016/j.jallcom.2015.08.075
- 14) D. Molodov, C. Bollmann and G. Gottstein: Impact of a magnetic field on the annealing behavior of cold rolled titanium, Mater. Sci. Eng. A 467 (2007) 71–77. doi:10.1016/j.msea.2007.02.084
- 15) M. Deguchi, S. Yamasaki, M. Mitsuhara, H. Nakashima, G. Tsukamoto and T. Kunieda: Tensile Deformation Behaviors of Pure Ti with Different Grain Sizes under Wide-Range of Strain Rate, Materials 16 (2023) 529. doi:10.3390/ma16020529
- 16) D. Liu, G. Huang, G. Gong, G. Wong and F. Pan: Influence of different rolling routes on mechanical anisotropy and formability of commercially pure titanium sheet, Trans. Nonferrous Met. Soc. China 27 (2017) 1306–1312. doi:10.1016/S1003-6326(17)60151-1
- 17) J. Donoso and R. Reed-Hill: Static strain-aging in commercial purity alpha titanium, Metall. Trans. A 8 (1977) 945–948. doi:10.1007/BF02661577
- 18) D. David, E. Garcia, X. Lucas and G. Beranger: Etude de la diffusion de l’oxygene dans le titane α oxyde entre 700 °C et 950 °C, J. Less-Common Met. 65 (1979) 51–69. doi:10.1016/0022-5088(79)90152-8