Original Article
Chemical characteristics of hadal waters in the Izu-Ogasawara Trench of the western Pacific Ocean
2018 Volume 94 Issue 1 Pages 45-55
Details
2018 Volume 94 Issue 1 Pages 45-55
Vertical profiles of potential temperature, salinity, and some chemical components were obtained at a trench station (29°05′N, 142°51′E; depth = 9768 m) in the Izu-Ogasawara (Bonin) Trench in 1984 and 1994 to characterize the hadal waters below ∼6000 m depth. We compared portions of both the 1984 and 1994 profiles with nearby data obtained between 1976 and 2013. Results demonstrated that the hadal waters had slightly higher potential temperature and nitrate and lower dissolved oxygen than waters at sill depths (∼6000 m) outside the trench, probably due to the effective accumulation of geothermal heat and active biological processes inside the trench. The silicate, iron, and manganese profiles in 1984 showed slight but significant increases below ∼6000 m depth, suggesting that these components may have been intermittently supplied from the trench bottom. Significant amounts of 222Rn in excess over 226Ra were detected in the hadal waters up to 2675 m from the bottom, reflecting laterally supplied 222Rn from the trench walls.
The hadal zone below a depth of ∼6000 m is regarded as one of the last frontiers of oceanography, as its inaccessibility has severely restricted scientific investigation (e.g., ref. 1). There have been very few studies on the chemical characteristics of hadal waters in the world’s oceans. This has been partly due to the limited capability of common hydrocast steel wire, which could not be safely reeled out more than ∼6000 m, and therefore could not be used to reach the hadal zone. In addition, most underwater instruments have not had pressure ratings to depths below ∼6000 m.
In their pioneering work on the hadal waters, Mantyla and Reid2) succeeded in hadal water sampling at ∼10000 m depth by applying specially designed free-vehicle instruments for the measurement of hydrographic properties (temperature, salinity, dissolved oxygen, and nutrients) in the Marianas Trench area (11–13°N, 142–146°E) of the western Pacific Ocean. They showed that the characteristics of the hadal waters were almost the same as those of the deep water at between 5000 and 7000 m depth, suggesting that the trench is filled uniformly with water that is almost identical to that at the sill depth. This contrasts with the conventional idea that the hadal zone has been isolated for a long time and thus has unique water characteristics.
Nozaki et al.3) confirmed the above view by measuring the same hydrographic parameters as above in two hadal water columns near Japan: the Izu-Ogasawara (Bonin) Trench (29°05′N, 142°51′E; bottom depth: 9768 m) and the Japan Trench (38°46′N, 144°08′E; bottom depth: 7530 m). They suggested that the trench water is rather freely exchanged by isopycnal mixing with the bottom water overlying the Northwest Pacific abyssal plain. The timescale for the renewal and vertical mixing of the trench water was estimated to be ∼5 years or less, because they showed that the vertical profile of 228Th, which was regarded to be nearly equal to its parent 228Ra, was almost constant in the trench water below 6000 m depth (as shown in Fig. 4 in their paper). Since 228Ra is supplied from the underlying sediment, the vertically constant nature of its profile suggests that the renewal and vertical mixing in the trench water should take place over a shorter period than its half-life of 5.7 years.
The main purpose of this paper is to further advance geochemical studies in the hadal zone by using time-series observations and the first measurement of 222Rn above the trench bottom. In 1994, we revisited the Izu-Ogasawara Trench station to repeat the geochemical measurements in the hadal zone. We supplement and advance the previous study3) on the Izu-Ogasawara Trench station by showing not only additional data for the 1984 samples but also the data from the repeated measurements made in 1994. By combining the 1984 and 1994 data, we examine the hadal homogeneity in greater detail and identify any existing temporal variations in the hadal zone.
Finally, because we considered that the hadal water could be more clearly characterized by comparisons with hydrographic data at nearby stations with bottom depths of ∼6000 m, we also performed comparisons against the data from the 1976 INDOPAC-II Expedition4) along the 28–29°N latitude and the data from the 2004 and 2013 CLIVAR-GO-SHIP Programs (https://cchdo.ucsd.edu/) along the east–west WOCE-P2 line (30°N).
Figure 1 shows the location of all stations in this paper, together with a summary of their surrounding bathymetry. The main station of this study (called AN1), located at (29°05′N, 142°51′E) in the Izu-Ogasawara Trench, was occupied on August 23–30, 1984, during the KH-84-3 cruise of R/V Hakuho Maru (I). The station AN1 was re-occupied as station LM2 on October 4–6, 1994, during the KH-94-3 cruise of R/V Hakuho Maru (II).

Bathymetric maps showing the location of station AN1 (LM2) in the Izu-Ogasawara Trench, together with the locations of reference stations.
Water samples for the measurement of chemical components (except for trace metals) were taken using Niskin bottles (General Oceanics) with reversing thermometers. During the KH-84-3 cruise, the bottles were attached to a tapered steel wire (9 mm diameter at the top and 14 mm at the end of its 14000 m total length) for the deep (>6000 m) hydrocast (water sampling) and to a steel wire (6 mm diameter with a length of 10000 m) for the shallow (<6000 m) hydrocast. During the KH-94-3 cruise, a titanium wire (6.4 mm diameter with a length of 12000 m) was used for all hydrocasts.
On board the ships, salinity (dimensionless) was measured using an Autolab salinometer with a precision of ±0.003. Potential temperature and potential density were calculated according to Bryden5) and Millero and Poisson,6) respectively. The precision (±standard deviation) of potential temperature values was estimated to be ±0.01 °C. Dissolved oxygen was measured by a modified Winkler’s titration method with a precision of ±1 µmol/kg.7),8) Nutrients (silicate, nitrate, and phosphate) were measured with an automatic spectrophotometric analyzer having a precision of ±1%. Radon-222 (half-life: 3.8 days) was extracted from a 20 L seawater sample and measured on board the ship according to Gamo and Horibe9) with a precision of ±2 dpm/100 kg. The sample was sealed in a glass bottle to measure 222Rn again as 226Ra (half-life: 1600 years) after the radioactive equilibrium between 226Ra and 222Rn was established.
Some of the previous data collected at nearby locations during the INDOPAC-II Expedition in 1976,4) during the CLIVAR and GO-SHIP programs in 2004 and 2013, and during other R/V. Hakuho-Maru cruises between 1979 and 1982,10) were also considered for comparison. Figure 1 and Table 1 show all the stations that are considered and discussed in this paper.
| Station No. | Latitude | Longitude | Depth/m | Date of observation | Name of Cruise or Program | Research vessel |
|---|---|---|---|---|---|---|
| AN1 | 29°05′N | 142°51′E | 9768 | August 23–30, 1984 | KH-84-3 | R/V Hakuho Maru (I) |
| LM2 | 29°04.8′N | 142°50.0′E | 9738 | October 4–6, 1994 | KH-94-3 | R/V Hakuho Maru (II) |
| IN-II-8 | 28°57.5′N | 143°48.0′E | 5862 | May 9, 1976 | INDOPAC-II | R/V Thomas Washington |
| IN-II-9 | 28°16.0′N | 142°48.7′E | 4949 | May 10, 1976 | INDOPAC-II | R/V Thomas Washington |
| AL8 | 29°59.3′N | 144°09.4′E | 5785 | July 22, 1979 | KH-79-3 | R/V Hakuho Maru (I) |
| AL9 | 29°58.8′N | 145°44.3′E | 5843 | July 24–25, 1979 | KH-79-3 | R/V Hakuho Maru (I) |
| CY16 | 30°02.6′N | 146°53.3′E | 6257 | June 13, 1980 | KH-80-2 | R/V Hakuho Maru (I) |
| CE25 | 30°07.3′N | 146°49.3′E | 6268 | March 12–13, 1982 | KH-82-1 | R/V Hakuho Maru (I) |
| CLIVAR-28 | 30°00.2′N | 142°15.3′E | 5855 | June 25, 2004 | CLIVAR (WOCE-P02) | R/V Melville |
| CLIVAR-29 | 30°00.0′N | 142°42.9′E | 8405 | June 26, 2004 | CLIVAR (WOCE-P02) | R/V Melville |
| CLIVAR-30 | 30°00.0′N | 143°10.6′E | 5953 | June 26, 2004 | CLIVAR (WOCE-P02) | R/V Melville |
| CLIVAR-31 | 29°59.9′N | 143°46.0′E | 5493 | June 27, 2004 | CLIVAR (WOCE-P02) | R/V Melville |
| CLIVAR-32 | 30°00.4′N | 144°19.4′E | 5677 | June 27, 2004 | CLIVAR (WOCE-P02) | R/V Melville |
| GOSHIP-27 | 30°00.0′N | 142°15.3′E | 5849 | April 12, 2013 | GOSHIP (WOCE-P02) | R/V Melville |
| GOSHIP-28 | 30°00.0′N | 142°42.9′E | 8556 | April 12, 2013 | GOSHIP (WOCE-P02) | R/V Melville |
| GOSHIP-29 | 30°00.0′N | 143°10.7′E | 6005 | April 13, 2013 | GOSHIP (WOCE-P02) | R/V Melville |
| GOSHIP-30 | 30°00.0′N | 143°46.2′E | 5491 | April 13, 2013 | GOSHIP (WOCE-P02) | R/V Melville |
| GOSHIP-31 | 30°00.0′N | 144°19.2′E | 5709 | April 13, 2013 | GOSHIP (WOCE-P02) | R/V Melville |
Clean seawater samples for trace metal analysis were collected in 1984 using the specially designed non-metallic TRAMS sampler.11),12) This sampler consists of a bellows-type flexible bag made of low-density polyethylene. The bag was initially folded, with its small dead space filled with pure water. A messenger actuated the sampler to accommodate seawater samples by stretching the bag at a desired depth. The TRAMS samplers were attached on the steel wires in series similar to the Niskin bottle hydrocast; however, each TRAMS sampler automatically extended a long (∼1 m) polyethylene suction tube toward the horizontal direction upstream from the hydrocast wire just before the sampling, in order to avoid contamination from the wire.
On recovery of the TRAMS samplers, seawater samples were divided into two portions in a shipboard clean laboratory: one was acidified after filtration through a 0.45-µm Nuclepore membrane filter, and the other was acidified without filtration. This process allowed the separate measurement of dissolved (D) and total dissolvable (TD) trace metals (iron (Fe), manganese (Mn), zinc (Zn), and copper (Cu)) by atomic absorption spectrometry with a precision of ±1–3%.12)–14)
Figures 2a–f show the vertical profiles of potential temperature, salinity, dissolved oxygen, silicate, nitrate, and phosphate at stations AN1 and LM2, together with those at two nearby INDOPAC-II stations (IN-II-8 and IN-II-9). The AN1 data were referred from the onboard report “Preliminary data of the Hakuho Maru KH-84-3 (Antares) expedition by Ocean Research Institute, University of Tokyo” (unpublished), and the LM2 data were referred from the onboard report “Preliminary data of the Hakuho Maru KH-94-3, Leg.II (Leo Minor) expedition by Ocean Research Institute, University of Tokyo” (unpublished).

Vertical profiles of potential temperature (a), salinity (b), dissolved oxygen (c), silicate (d), nitrate (e), and phosphate (f) at station AN1 in 1984 and station LM2 in 1994, together with the data at the reference INDOPAC-II stations 8 and 9.4)
The vertical profiles were very similar between AN1 and LM2, except for those of phosphate (Fig. 2f), which showed large systematic shifts of 0.2–0.3 µmol/kg below ∼1000 m depth, probably due to some problems in standardization.
Strictly speaking, slight differences between AN1 and LM2 were observed also for salinity and silicate. The averaged values of salinity below 6000 m depth (Fig. 2b) were 34.687 and 34.698 for AN1 and LM2, respectively. This systematic shift was larger than the precision for salinity measurement, and was also thought to be derived from a standardization problem.
In contrast, silicate profiles in the hadal zone (Fig. 2d) did not show a systematic shift but instead seemed to change shape between AN1 and LM2, which will be discussed in Section 3.3.
Except for silicate, the extreme uniformity of the hadal seawater was generally recognized from constant profiles of salinity (34.687 ± 0.002), dissolved oxygen (165.7 ± 0.7 µmol/kg), nitrate (35.1 ± 0.3 µmol/kg), and phosphate (2.39 ± 0.04 µmol/kg). The average values and standard deviations in the above parentheses are all for the AN1 data only. The potential density as a dimensionless σθ value (not shown) was also nearly constant (27.788 ± 0.002) below 6000 m depth at AN1, indicating that the vertical stability is extremely low inside the trench.
It is noteworthy, however, that potential temperature (Fig. 2a) in the hadal zone showed a slightly increasing trend with depth at both AN1 and LM2. This point will be discussed below in more detail.
3.2. Characterization of the hadal water from potential temperature and dissolved oxygen data.The uniqueness of trench seawater was exaggerated from the comparison of vertical profiles between the trench station (AN1 and LM2) and the nearby control stations (IN-II-8 and IN-II-9). If we compare the potential temperature values at ∼6000 m depth (Fig. 2a), the trench station showed slightly higher values (by ∼0.02 °C) than the control station (IN-II-8). A similar deviation was recognized in the dissolved oxygen values at ∼6000 m depth (Fig. 2c); the trench station showed slightly but significantly lower oxygen values (∼5 µmol/kg lower) than the control station.
The higher and lower values of potential temperature and dissolved oxygen, respectively, at ∼6000 m depth over the hadal zone were supported by the CLIVAR and GO-SHIP data gathered across the Izu-Ogasawara Trench between 142.3°E and 144.3°E along the 30°N line. As shown in Fig. 1 and Table 1, the CLIVAR station 29 (depth = 8405 m, observed in 2004) and the GO-SHIP station 28 (depth = 8556 m, observed in 2013) were at nearly the same location above the Izu-Ogasawara Trench. They were located ∼60 miles north of our trench station (AN1 and LM2).
Figures 3 and 4 show composite profiles of the potential temperature and dissolved oxygen for the CLIVAR stations 28–32 and the GO-SHIP stations 27–31. Although the deepest layers of the CLIVAR and GO-SHIP observations were limited to ∼6000 m even above the trench, it is apparent that the trench stations (CLIVAR-29 and GO-SHIP-28) showed higher potential temperature by ∼0.02 °C (Figs. 3a and 4a) and lower dissolved oxygen by 3–4 µmol/kg (Figs. 3b and 4b) at a depth of ∼6000 m, compared with those at the abyssal plain stations east of the trench (CLIVAR-30, 31, 32 and GO-SHIP-29, 30, 31). The stations CLIVAR-28 and GO-SHIP-27 west of the trench had similar profiles to those at CLIVAR-29 and GO-SHIP-28, respectively, showing the westward extension of the trench water characteristics.
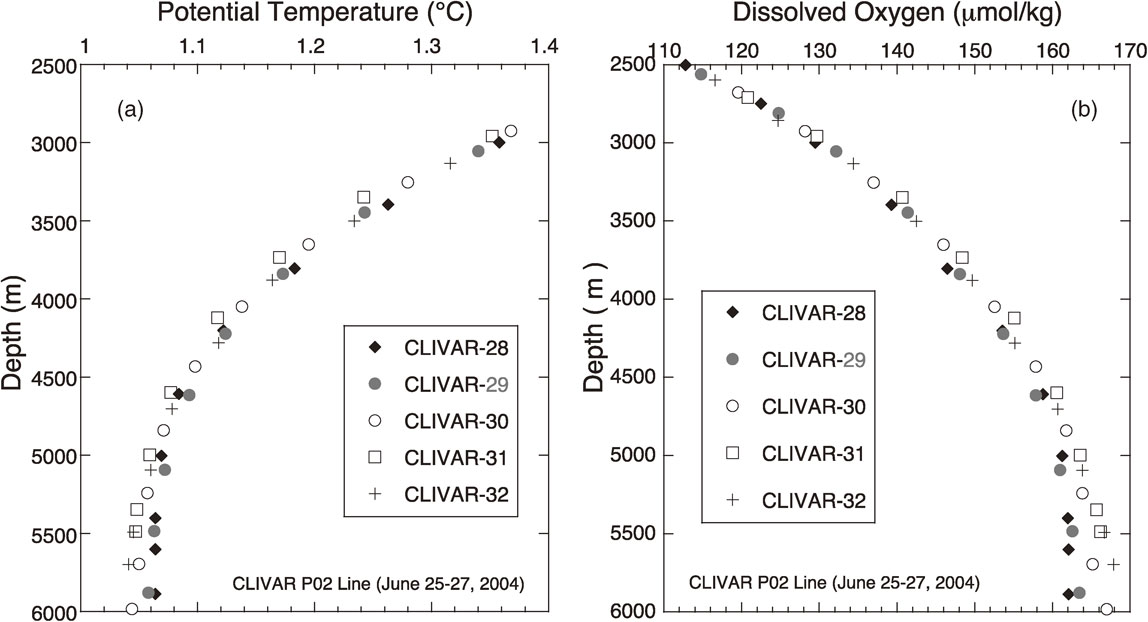
Vertical profiles of potential temperature (a) and dissolved oxygen (b) at the CLIVAR stations 28–32 observed in 2004.

Vertical profiles of potential temperature (a) and dissolved oxygen (b) at the GO-SHIP stations 27–31 observed in 2013.
The finding that the sill-depth potential temperature was higher at the trench stations AN1, LM2, CLIVAR-29, and GO-SHIP-28 than at the other nearby stations (Figs. 2a, 3a, and 4a) might reflect effective accumulation of crustal heat flow in the hadal zone. The gradual increase of potential temperature with depth at AN1 and LM2 (Fig. 2a) is suggestive of upward heat flux from the trench bottom.
A moderate level of heat flux (20–120 mW/m) has been observed from the subducting Pacific plate across the Japan Trench (between 142°E and 146°E) due to upward heat transfer from the plate.15) Although no heat flow data are currently available from the Izu-Ogasawara Trench bottom, there have been a few measured values of between 38 and 58 mW/m from the Chishima and the Japan Trenches (34–42°N) below a depth of 7300 m.16) A similar level of heat flow could reasonably be expected for the AN1 and LM2 station, where the same Pacific plate is subducting similarly as the Chishima and the Japan Trenches.
Taira et al.17) and Taira18) obtained highly precise profiles of potential temperature in the Mariana Trench at 11°23′N (Challenger Deep) and the Izu-Ogasawara Trench at 34°N, respectively. They used a special CTD made of a titanium pressure housing with the pressure rating of 12000 m depth, which was attached to the end of a titanium armored cable with a length of 12000 m. At both locations, downward increases of potential temperature (0.0006–0.0009 °C/1000 decibar) were observed below ∼7000 m depth, which were regarded as the contribution of geothermal heating.17),18)
It is uncertain why the slope of temperature increase in the hadal zone at AN1 and LM2 (∼0.008 °C/1000 m, Fig. 2a) was an order of magnitude higher than those observed at 11°23′N and 34°N.17),18) Since the data at AN1 and LM2 were obtained using reversing thermometers with less precision than the CTD, the more precise observation using CTD at AN1 is desirable to confirm the difference of the temperature slope.
The lower value of dissolved oxygen or de-oxygenation inside the trench might be associated with greater biological activity in the trench water and trench bottom sediment. Recent studies19)–22) have elucidated the existence of higher biomass in hadal water columns. Glud et al.21) found that the oxygen consumption rate in the surface sediment of the Challenger Deep, Mariana Trench, is 1.8 times higher than that of ordinary 6000 m depth sediment. Higher biological activities in hadal zones were also observed at the Izu-Ogasawara Trench (34°N) and the Tonga Trench (23°S)22) in the western Pacific. Such higher oxygen consumption in hadal water columns together with that in surface sediments may be also the case for the station AN1 area, where no observational data are available at the present stage.
If the O2 deficiency of ∼5 µmol/kg in the trench water is due to in situ oxidation of organic matter, increases of nitrate and phosphate of ∼0.6 and ∼0.04 µmol/kg, respectively, must accompany the O2 decrease according to the Redfield ratio.23) This seems to be true for nitrate, as shown in Fig. 2e, where the nitrate values at ∼6000 m depth were higher by ∼1 µmol/kg at AN1 and LM2 than that at IN-II-8. If we discard the phosphate data at LM2 in Fig. 2f, the phosphate value at ∼6000 m depth at AN1 was higher by 0.1–0.2 µmol/kg than that at IN-II-8, although the data scattering is large among AN1, IN-II-8, and IN-II-9. More precise and accurate data will advance the discussion quantitatively in future.
3.3. Behaviors of silicate and trace metals.It is of interest that the silicate profiles showed a slight difference between 1984 and 1994 (Fig. 2d). The profile in 1984 (at AN1) had a broad minimum at about 6000 m depth and a gradual increase by ∼8 µmol/kg from ∼6000 m depth to the bottom. In contrast, the profile in 1994 (at LM2) was almost constant through the hadal zone. This change of the hadal silicate profiles between 1984 and 1994 seems conceivable, judging from the renewal timescale of less than ∼5 years as estimated by Nozaki et al.3) for the hadal water of the Izu-Ogasawara Trench. The discrepancy between AN1 and LM2 may be due to some transient events in 1984 that disturbed the homogeneous conditions in the hadal water column.
One possibility is a temporary increase of the northward inflow of the Antarctic Bottom Water (AABW) around the sill-depth (∼6000 m), which could supply seawater with a relatively low silicate content. However, as shown in Figs. 2c and 2e, there were no other AABW signatures such as high dissolved oxygen or low nitrate, which would be expected to accompany a low silicate signature from AABW.
Another possibility is associated with an episodic flux of pore fluids from bottom sediment. For example, a few months after the 2011 M9.0 Tohoku-Oki Earthquake near the Japan Trench (38°N, 143°E), significant re-suspension of bottom sediment and deep fluid venting along the earthquake faults were recognized as anomalies of light transmission (turbidity),24) chemical components such as 13C-enriched methane,24) and 3He-enriched helium25) in the bottom waters. These results strongly suggest that the inner trench zone should have become a disturbed field characterized by temporal changes due to subduction-induced crustal deformation.
Although no silicate data are available on sedimentary pore fluids from the Izu-Ogasawara Trench bottom, high silicate concentrations in pore fluids have been commonly observed in some other subduction zones south of Japan. The northward Philippine Sea plate subducts under the Japanese Islands along the Nankai Trough and the Sagami Trough (see Fig. 1a). At ODP Hole 808 (32°21′N, 134°57′E; depth = 4675 m) along the Nankai Trough accretionary prism, an averaged silicate concentration of 710 ± 190 µmol/kg, significantly higher than the bottom seawater value of 150 µmol/kg, was detected in porewaters of the surface sediment between 3 and 348 m below the seafloor (mbsf).26) At a biological colony site (35°00′N, 139°14′E; depth = 1160 m) along the Sagami Trough, silicate concentrations of 874 µmol/kg and 419 µmol/kg, significantly higher than the background bottom water value of ∼140 µmol/kg, were observed for sedimentary pore-waters at 0.2 mbsf27) and shimmering seepage waters taken just above the bottom,28) respectively. These previous data suggest that sedimentary pore fluids at subduction zones have a much higher Si content than that of bottom seawater; thus, a significant amount of fluid seepage from the trench bottom might temporarily increase the Si concentration of the bottom water as observed at AN1 (Fig. 2d).
Such a bottom flux is also suggested by trace metal data. Figure 5 shows vertical profiles of four trace metals, Fe, Mn, Zn, and Cu at AN1 in 1984,12)–14) where both TD and D values are plotted. The D-values were nearly constant in the hadal zone for all the trace metals. Although the TD-values were also constant for Zn and Cu, TD-Fe and TD-Mn showed significant increases below ∼7000 m depth. There was no change in the D fraction but an increase in the TD fraction, which could be explained by a supply of particulate Fe and Mn from the bottom and/or slopes of the trench.14)

Similar Fe and Mn anomalies have been observed in other locations. Nakayama et al.29) reported sharp increases of TD-Fe and TD-Mn in a hadal zone of the Japan Trench, reaching maximum values of 113 nM and 12 nM, respectively, at ∼10 m above the bottom at station LM9 (40°26′N, 144°29′E; depth = 7375 m) on October 16, 1994. These profiles, apparently indicating a transient supply or suspension of Fe and Mn from the trench bottom sediment, were assumed to be earthquake precursors or post-earthquake signatures, because two large earthquakes, the Hokkaido-Toho-Oki Earthquake (43°22′N, 147°40′E; M8.2) and the Sanriku-Haruka Oki Earthquake (40°27′N, 143°43′E; M7.6), occurred 12 days before and 73 days after the LM9 observation, respectively.
Large TD-Mn anomalies have also been observed just after an eruption of a submarine volcano and after a submarine earthquake in the Sagami Trough subduction zone, suggesting Mn-rich pore fluid emanation associated with these tectonic events. Values of TD-Mn as high as ∼80 nM were measured at a western Sagami Bay station (35°00′N, 139°16′E; depth = 1400 m), a day after the eruption of a nearby submarine volcano, Teishi Knoll (34°59′N, 139°08′E; depth: ∼100 m) in July 1989.29) An abrupt increase of TD-Mn up to ∼100 nM in bottom seawater was observed also along the Sagami Trough just after a nearby submarine earthquake (M5.8) on April 21, 2006.30) The observation was achieved using an in situ Mn analyzer31) deployed on the sea bottom (35°00′N, 139°13′E) with a depth of 1150 m, ∼7 km northward from the epicenter.
The simultaneous increases of silicate, TD-Fe, and TD-Mn observed at AN1 in this study, although the correlation is still qualitative, may suggest the involvement of some tectonic events associated with the Pacific Plate subduction and/or arc volcanisms west of the trench. By referring to a database of the Japan Meteorological Agency on the past earthquakes around Japan (http://www.data.jma.go.jp/svd/eqdb/data/shindo/index.php), we compiled in Table 2 all the nearby earthquake records detected at the land observatories in two Ogasawara Islands, Chichi-jima (27°05′N, 142°13′E) and Haha-jima (26°40′N, 142°09′E) with a seismic intensity (Japanese scale) of 1 or above.
| Date | Epicenter | Depth | Magnitude | Seismic Intensity | |
|---|---|---|---|---|---|
| N | E | (km) | |||
| Aug. 20, 1983 | 27°57′ | 142°25′ | 65 | M5.9 | 2 |
| Jan. 1, 1984 | 33°37′ | 136°50′ | 388 | M7.0 | 4 |
| Mar. 6, 1984 | 29°21′ | 139°12′ | 452 | M7.6 | 4 |
| Apr. 24, 1984 | 30°52′ | 138°50′ | 407 | M6.2 | 3 |
| Jun. 13, 1984 | 31°27′ | 139°47′ | 0 | M5.9 | (<1) |
| Aug. 23–30, 1984 | Observation at Station AN1 | ||||
| Apr. 4, 1985 | 28°16′ | 139°54′ | 458 | M6.4 | 2 |
| Jun. 6, 1985 | 28°43′ | 140°19′ | 50 | M5.2 | 1 |
| Jun. 7, 1985 | 29°05′ | 140°18′ | 33 | M5.0 | 1 |
| Jul. 3, 1985 | 27°17′ | 140°20′ | 498 | M5.8 | 1 |
| Aug. 17, 1985 | 28°02′ | 140°46′ | 56 | M4.9 | 1 |
| Aug. 18, 1985 | 28°35′ | 142°06′ | 8 | M4.4 | 1 |
| Aug. 12, 1993 | 26°46′ | 141°31′ | 34 | M4.3 | 1 |
| Apr. 11, 1994 | 27°20′ | 143°05′ | 43 | M4.2 | 1 |
| Jun. 11, 1994 | 27°57′ | 142°13′ | 147 | M5.0 | 2 |
| Jun. 14, 1994 | 27°44′ | 141°45′ | 152 | M4.7 | 1 |
| Oct. 4–6, 1994 | Observation at Station LM2 | ||||
| Jan. 29, 1995 | 29°23′ | 141°48′ | 95 | M5.4 | 1 |
| Mar. 18, 1995 | 29°19′ | 141°29′ | 145 | M4.5 | 1 |
| Apr. 17, 1995 | 27°36′ | 142°28′ | 1 | M5.4 | 2 |
| Jun. 17, 1995 | 27°24′ | 142°53′ | 0 | M4.8 | 1 |
| Aug. 15, 1995 | 27°26′ | 142°49′ | 12 | M4.3 | 1 |
| Oct. 2, 1995 | 29°12′ | 139°27′ | 440 | M5.9 | 2 |
Table 2 contrasts the earthquake levels before the AN1 observation with those before the LM2 observation, clearly indicating that the former was higher in seismic activities. Three big earthquakes (M > 6) occurred between January and April in 1984, with a seismic intensity of 3 or 4 at the Ogasawara Islands. Although the earthquake on June 13, 1984, was relatively small in magnitude, it caused tsunamis at the Izu islands and southern coasts of Japan.32) There is a possibility that the relatively active seismicity around station AN1 before its observation in August 1984 may have caused chemical anomalies in silicate, TD-Fe, and TD-Mn, whereas the low seismic activity before the LM2 observation may have kept the hadal water column in a relatively uniform condition.
At the present stage, it is uncertain whether or not the above hypothesis is true. Further data accumulation is absolutely necessary. It is desirable to conduct frequent and detailed observations on both water columns and sedimentary pore fluids inside the trench at and around station AN1, using not only research vessels and submersibles but also in situ instruments to be deployed for long-term monitoring in the hadal environment.
3.4. Excess Rn-222 profile.Dissolved 222Rn in seawater is a mixture of i) 222Rn in radioactive equilibrium with 226Ra dissolved in seawater, and ii) 222Rn emanated from bottom sediment. The radioactivity of the former 222Rn is the same as that of 226Ra in seawater, because the half-life of 222Rn (3.8 days) is sufficiently small compared with that of 226Ra (1600 years) to establish a radioactive equilibrium between both radionuclides. The latter 222Rn is originated from 226Ra in bottom sediment, and is called “excess 222Rn”, which is calculated by subtracting the radioactivity of 226Ra from that of the total 222Rn. In the ocean, the excess 222Rn is usually detected only in seawater generally less than 100–200 m above the bottom sediment, (e.g., ref. 9), due to its short half-life.
The excess 222Rn profile at AN1 is shown in Fig. 6, together with those at nearby control stations CY16, CE25, AL8, and AL9,9),33) the locations of which are shown in Fig. 1 and Table 1. The excess 222Rn values at AN1 decreased to almost zero at heights of 38 and 47 m above the bottom, but reverted to ∼10 dpm/100 kg at 73 m above the bottom, and were maintained at the level of 5–10 dpm/100 kg with little decrease up to 2692 m from the bottom (except for a zero value at 2400 m from the bottom). This profile was quite unusual, completely different from those at nearby control stations, where the excess 222Rn showed an exponential decrease (as almost straight lines in semi-logarithmic plots as Fig. 6) against the distance from the bottom, as expected from a simple vertical eddy diffusion model.34)

Vertical profiles of excess 222Rn at station AN1 and at four nearby stations plotted against the distance from the bottom in logarithmic order. Two straight lines are arbitrarily drawn for CY16 and CE25 data.9)
For the excess 222Rn observed at 2692 m above the bottom at AN1 to have been supplied only from the trench bottom sediment, there would need to have been extraordinary vigorous vertical mixing with a time scale of only several days through the hadal zone. This is quite unrealistic and also inconsistent with the silicate, Fe, and Mn profiles at AN1, which showed vertical variations (Figs. 2d and 5). Therefore, we must assume the existence of some horizontal Rn supplies, possibly by isopycnal eddy diffusion, from the inside walls of the trench over the water column up to 2692 m above the bottom. Such a horizontal flux of 222Rn from the bottom slope has been similarly observed in the Japan Sea as a mid-depth 222Rn maximum.35)
The finding of the 222Rn flux from the trench walls implies the existence of lateral fluxes for other chemical components in the hadal zone. The anomalies of silicate, TD-Fe and TD-Mn discussed in the previous section might have originated not only from the trench bottom but also its side walls.
Detailed water geochemistry of the hadal zone of the Izu-Ogasawara Trench (29°05′N, 142°51′E; depth = 9768 m) was investigated in 1984 and 1994, and can be summarized as follows:
(1) By comparing our data with those from nearby stations (29°–30°N, 143°–147°E), it was shown that the trench water below ∼6000 m depth has a higher potential temperature (by about 0.02 °C) and is poorer in dissolved oxygen (by about 5 µmol/kg).
(2) No vertical and temporal variation in potential temperature, dissolved oxygen, and nitrate, was detected below a depth of 6000 m from the observations in 1984 and 1994. However, silicate, Fe, and Mn were found to increase with depth below ∼6000 m in 1984, suggesting that some tectonic events occurred to cause transient supplies of these elements from the trench bottom.
(3) More frequent and/or time-series observations for water geochemistry are needed in the hadal zone to clarify potential linkages between chemical variations in trench waters and nearby seismic activities.
(4) Unusual excess 222Rn was detected at depths as high as 2692 m above the trench bottom, indicating the existence of lateral 222Rn supplies from the trench walls. Such horizontal flux should be taken into consideration for studies in chemical interaction between the hadal water column and bottom sediment.
The authors wish to thank Y. Kato for providing information about a special adapter for the wire clamp of Niskin bottles, which enabled the hadal hydrocast using a thick steel wire from a winch on the R/V Hakuho Maru (I). Thanks are also due to the officers and crew of R/V Hakuho Maru (I and II) for their kind cooperation with the water sampling, and to S. Goda and Y. Nakaguchi, who measured nutrients during the cruises. M. Yamano gave useful information on heat flow studies in the trenches of the western Pacific. Critical comments from two anonymous reviewers were useful to improve the initial manuscript. This study was partly supported by grants-in-aid for Scientific Research (A) (Nos. 23253001 and 16H02701) from the Ministry of Education, Culture, Sports, Science and Technology, Japan.