ABSTRACT
Objectives: The purpose of this study was to clarify the diagnostic accuracy of the mobile assessment of varus thrust using inertial measurement units (IMUs).
Methods: A total of 80 knees in 49 patients were enrolled in this study. On visual analysis of gait to determine the presence or absence of varus thrust, 23 knees were assigned to the Present group, 17 to the Ambiguous group, and 40 to the Absent group. The peak knee varus angular velocities (PVVs), measured by quantitative gait analysis using nine-axis IMUs, were compared between these three groups. A receiver operating characteristic curve for the relationship between the visual assessment of varus thrust (Present and Ambiguous) and the measured PVV was created, and the cut-off PVV for visualized varus thrust was determined as the highest point for both sensitivity and specificity.
Results: The mean PVVs were significantly different between the three groups (Present, 47.7 ± 8.2 degree/s, Ambiguous, 34.1 ± 10.5 degree/s, and Absent, 28.1 ± 8.3 degree/s, respectively, ANOVA P=0.000). The PVV cut-off value for visualized varus thrust was 28.1 degree/s, yielding a sensitivity of 0.957 and a specificity of 0.579.
Conclusions: A PVV <28.1 degree/s is useful for ruling out varus thrust during gait. This quantitative varus thrust assessment method using IMUs has clinical utility as a screening test.
INTRODUCTION
Varus thrust is an established abnormal motion in the coronal plane seen in knee osteoarthritis (OA). This abnormality is a phenomenon in which the knee varus alignment experiences a lateral dynamic worsening during the initial stance phase. Numerous studies have found that varus thrust is correlated with radiographic severity, disease progression, and clinical symptoms in knee OA. Varus thrust is a mechanical risk factor for medial compartment knee OA1) and is assessed visually as being present or absent. The prevalence of varus thrust, visualized during gait, ranged from 16–51% in previous cohort studies.1,2,3)
Attempts at a quantitative measurement of varus thrust using gait analysis have been reported. The current gold standard for gait analysis is a multiple camera-based motion capture system combined with ground reaction force plates.4,5,6) Previous gait research has shown that a quantifiable varus thrust was associated with increases in both the peak knee varus angle and the peak varus angular velocity in the early stance phase.5,6,7) These previous studies had the advantage of being able to precisely quantify the extent of varus thrust. Notably, however, the quantification methods used in these studies would be difficult to apply clinically because of the costs and the more restrictive measurement environments in hospitals. Consequently, there have been no studies of varus thrust from the viewpoint of clinical application. If we could identify varus thrust before it becomes noticeable, it would be possible to treat patients with physical therapy at an early stage. A simple and more practical measurement system for varus thrust would be readily adopted in clinical examinations of the knee if it became available.
Inertial measurement sensor units (IMUs) that contain accelerometers, gyroscopes, and magnetometers are small, low-cost, and portable devices that can be readily applied to individual patients in the clinical setting. A quantitative assessment of varus thrust measured by accelerometers has been reported previously. Gait analysis using IMUs allows not only the evaluation of spatiotemporal gait parameters from measurements of acceleration and angular velocity, but also an estimation of the three-dimensional knee joint angular deviation by measuring the orientation of one IMU attached to the thigh and another IMU attached to the shank.8,9,10,11,12,13,14) The clinical applications of these devices are undergoing continuous development.
The aim of the present study was to propose a methodology for the mobile assessment of varus thrust using IMUs, and to determine the cut-off value of the peak varus angular velocity (PVV) in subjects with a visualizable varus thrust. Our hypothesis was that an IMU-based mobile assessment of varus thrust would be viable in a clinical setting.
METHODS
Study ParticipantsThis cross-sectional study was approved by the ethics committee of our institution and was performed in accordance with the ethical standards of Akita University Ethics Committee (No. 2017–1775). We recruited patients who visited our university hospital with medial compartment knee OA between May 2017 and March 2018. All patients provided written informed consent before their inclusion in this study. Inclusion criteria were: more than 20 years of age, body mass index <31 kg/m2, available radiographs of weight bearing standing in a long leg anterior–posterior view, and the ability to walk without gait aids. Exclusion criteria were missing data, valgus alignment, infection, rheumatoid arthritis, previous knee surgery or knee trauma, the presence of hip and/or ankle OA on radiography, neurological disorders, cardiovascular diseases, and peripheral artery diseases. Nine of the 58 initially recruited subjects were excluded, 7 with missed data and 2 who had not undergone gait analysis. Our final study cohort comprised 80 knees in 49 patients. An experienced orthopedic surgeon visually assessed the presence of varus thrust during quantitative gait analysis; as a result, 23 knees were assigned to the Present group, 17 to the Ambiguous group, and 40 to the Absent group.
Quantitative Gait Analysis and Data ProcessingWe employed five nine-axis IMUs in our current analyses (IMU-Z2, ZMP Inc., Tokyo, Japan). For each subject, a sensor was attached using flexible bands to the anterior side of the thigh and the shank of both legs and to the pelvis (at the S2 level) (Fig. 1). The sampling measurement rate was 100 Hz. Participants walked at a self-selected comfortable speed along a 10-m walkway and underwent three gait tests while wearing IMUs.

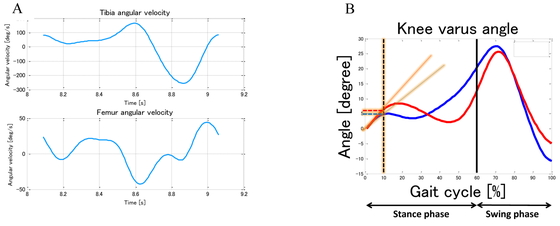
To ensure stabilization of the subject’s gait, a distance equivalent to at least three steps was allowed before and after the 10-m walkway. First, the participant stood upright for 5 s to allow estimation of the IMUs’ initial orientations. The examiner then instructed the participant when to start and finish walking. During these gait tests, the examiner counted the participant’s steps and recorded which leg touched the ground using a video camera. All sensors were logged in a synchronized fashion and the data were transmitted via Bluetooth to a laptop (Thinkpad X270; Lenovo Corporation, Beijing, China). Other than the acceleration measurements from the IMUs attached to both legs, all data were converted from a local to a global coordinate system using an extended Kalman filter, as described in our previous study.15) The anterior–posterior acceleration data collected by the IMU attached to the trunk were filtered using a low-pass, sixth-order Butterworth filter with a 2-Hz cut-off frequency, and peaks emerged from these data as heel strike timings. During gait, one gait cycle (GC) was equivalent to three heel strikes, and the stance phase was usually regarded as 60% of one GC. The middle two GC step counts were used in the data analysis using MATLAB R2016b (MathWorks Inc., MA, USA). The maximum varus angle during the stance phase was estimated using the extended Kalman filter and the sensor fusion method.15) The knee varus velocity was computed by taking the time derivative of the estimated knee angle in the coronal plane (Fig. 2).
An experienced orthopedic surgeon and co-author of this study (HT) visually assessed the presence of varus thrust during quantitative gait analysis. Based on the method proposed by Chang et al., this examiner determined for each leg whether varus thrust was present and evaluated the level of confidence in the assessment using a Likert scale, i.e., “very confident,” “somewhat confident,” “not very confident,” or “not at all confident.”6) Because a high intra-rater reliability level was found (Kappa 0.81), it was not necessary to check the intraclass correlation coefficients for the visualized varus thrust. A very confident assessment of varus thrust by the examiner was defined as “present” for the purposes of stratifying the patients. Conversely, patients receiving a very confident assessment of no varus thrust by these visual examinations were assigned to the Absent group. All other knees were placed in the Ambiguous group.
Radiographic MeasurementsMedial knee OA was evaluated using standing anterior–posterior knee radiographs and Kellgren–Lawrence grades. The scoring system was as follows: 0 (normal), 1 (possible osteophyte), 2 (definite osteophyte, possible joint space narrowing), 3 (moderate osteophyte, definite joint space narrowing, osteosclerosis), and 4 (large osteophyte, osteosclerosis, full-thickness cartilage loss).16)
Statistical AnalysisThe mean PVV and the maximum knee varus angle were compared between the three participant groups using one-way analysis of variance (ANOVA). A post hoc analysis using the Tukey method was performed. A receiver operating characteristic (ROC) curve for the relationship between the visualized varus thrust (Present and Ambiguous) and PVV was created, and the PVV cut-off value for visualized varus thrust was determined as the highest point for both sensitivity and specificity. Furthermore, the proportion of knees among the three study groups with a PVV beyond the cut-off value was investigated. All data were parametric, expressed as the mean ± standard deviation. SPSS for Windows version 17.0 software (SPSS, Chicago, IL, USA) was used for all statistical analyses. Significant differences between groups were assigned at a P value of 0.05 or less.
RESULTS
There were no demographic differences between the participants in the three study groups (Table 1). The prevalence of visualized varus thrust was 28%, which rose to 50% if the Ambiguous group was included. The mean PVV was significantly different between the three groups (Present, 47.7 ± 8.2 degree/s, Ambiguous, 34.1 ± 10.5 degree/s, and Absent, 28.1 ± 8.3 degree/s, respectively, P<0.001) (Fig. 3).
Table 1. Demographic data for the three groups
| Present group
(n=23) | Ambiguous group
(n =17) | Absent group (n=40) | P value |
| Age, years | 60.3 (14.8) | 60.1 (19.3) | 54.1 (17.1) | 0.193 |
| Body weight, kg | 69.2 (13.9) | 68.8 (21.8) | 57.5 (8.7) | 0.065 |
| KL grade | | | | |
| 0 | 3 (8%) | 6 (35%) | 10 (25%) | |
| 1 | 5 (15%) | 1 (5%) | 12 (30%) | |
| 2 | 7 (21%) | 4 (24%) | 10 (25%) | |
| 3 | 9 (26%) | 5 (29%) | 8 (20%) | |
| 4 | 10 (29%) | 1 (5%) | 0 (0%) | |
| HKA angle, degrees | –4.1 (3.5) | –3.7 (3.9) | –3.3 (2.4) | 0.284 |
Values are expressed as the number of patients or as a mean (standard deviation or percentage). P<0.05.
KL, Kellgren–Lawrence; HKA, hip–knee–ankle.

The mean maximum varus angle during the stance phase in the Present group was significantly higher than that in the Absent group (P<0.05). There was also a significant difference in the mean maximum varus angle between the Ambiguous and Absent groups (P<0.05). However, there was no statistical difference in the mean maximum varus angle between the other groups. The PVV cut-off value for visualized varus thrust was 28.1 degree/s on the ROC curve; this yielded a sensitivity of 0.957 and a specificity of 0.579. The area under the curve was 0.896 (Fig. 4). For the Present, Ambiguous, and Absent study groups, the proportion of knees with a PVV beyond the cut-off value was 100%, 82%, and 45%, respectively.
DISCUSSION
The current study investigated the diagnostic accuracy of a quantitative methodology for assessing varus thrust using IMUs. A PVV <28.1 degree/s was found to be a useful cut-off to rule out the presence of varus thrust during gait (sensitivity 0.957). This quantitative varus thrust assessment method using IMUs has potential as a clinical screening test. If we can detect varus thrust independently of the experience of the examiner, it may be possible to start treatment, such as physical therapy, early and prevent the progression of knee OA.
Varus thrust is a potential risk factor for the progression of medial knee OA.1,7,17,18) An early diagnosis is therefore more important than a definitive diagnosis. Traditional visual assessments of varus thrust are simple and require no special equipment, which gives them a very high clinical utility; however, the subjectivity of the examiner will necessarily impact the results. A previous study reported good intra-rater reliability for the visual assessment of varus thrust by well-trained examiners.1) However, in many cases, it is difficult to clearly determine whether varus thrust is present in early-stage knee OA, and the inter-rater reliability is not high enough in these instances. From a clinical perspective, the accurate identification and quantification of varus thrust is important, and IMUs are now being increasingly used in the assessment of patients with knee OA.8,19)
IMUs are inexpensive, portable, wireless devices that orthopedic specialists and physical therapists can easily use in clinical practice. Our current results demonstrated a high sensitivity for the quantitative assessment of varus thrust using these devices. A high-sensitivity test is needed to make an exclusion diagnosis, and our present findings revealed that IMUs satisfy this criterion and therefore have clinical utility for screening large cohorts of patients with knee OA. The peak varus angle and the PVV are the main mechanical metrics used for the quantification of varus thrust.6,20) The former parameter represents the knee position only at a particular timepoint. In contrast, the latter more closely reflects the visualized varus thrust because it incorporates the direction and speed of the knee movement. Chang et al. have demonstrated that varus thrust detected by gait observation is associated with a greater change in PVV than in the peak knee varus angle calculated using a three-dimensional motion capture system.6) PVV is therefore considered to be a more suitable quantification index. In our present study, the PVV calculated using the IMUs accurately identified the Present group, whereas the proportions of OA knees with a PVV >28.1 degree/s in the Ambiguous and Absent groups were 82% and 45%, respectively. It is possible that the angular velocity is able to detect subtle joint instability that is not obvious to the eye. This would mean that there are more patients with substantial varus thrust than previously thought. Early interventions in these patients may prevent aggravation and reduce the frequency of knee arthroplasties.
This study has several limitations of note. First, this was a retrospective, cross-sectional analysis and the number of subjects was small. Prospective studies will be needed to verify our observations. Second, there was an inherent selection bias because the visual assessments of varus thrust were based on subjective evaluations by a single orthopedic specialist. This would have an impact on the groupings in terms of the visualized varus thrust. However, the purpose of this study was to verify the usefulness of IMUs in providing more clarity for ambiguous visual assessments of varus thrust, and not to verify the reproducibility of the visual assessment of varus thrust. Third, there is a limitation in the accuracy of gait analysis measured by IMUs. We previously carried out a validation study between IMUs and an optical motion capture system. Our results showed that the root mean squared errors were 4 degrees in the coronal plane.15) We hope for more accurate IMUs in the future. A fourth limitation is that gait compensations may affect the judgement and degree of varus thrust. Gait deviations in patients with knee OA, including reduced gait speed, lateral trunk lean, toe-out, or stride length shortening, were not considered in this study. However, varus thrust is the result of these altered gait strategies, and there is a risk that changes from an individual comfortable gait will adversely affect motor control. Our proposed assessment method with IMUs is still a very feasible and objective approach for evaluating varus thrust via a simple index as a screening test.
CONCLUSION
IMUs showed diagnostic accuracy in the quantitative assessment of varus thrust. A PVV <28.1 degree/s, measured with these devices, is a useful metric for objectively ruling out the presence of varus thrust during gait (sensitivity, 0.957). This quantitative varus thrust assessment method using IMUs therefore has clinical utility as a screening test. It is to be expected in the future that a novel knee thrust meter will be developed that enables the early and precise diagnosis of varus thrust.
ACKNOWLEDGMENTS
The authors wish to thank Yu Igarashi, Kiyoshi Tsurumiya, and Wataru Hayasaka for their assistance in data acquisition. And the authors are grateful to Kilian Perrem, PhD, for editing the manuscript.
CONFLICTS OF INTEREST
This research did not receive any specific funding from the public, commercial, or not-for-profit sectors.
REFERENCES
- 1. Chang A, Hayes K, Dunlop D, Hurwitz D, Song J, Cahue S, Genge R, Sharma L: Thrust during ambulation and the progression of knee osteoarthritis. Arthritis Rheum 2004;50:3897–3903. PMID:15593195, DOI:10.1002/art.20657
- 2. Lo GH, Harvey WF, McAlindon TE: Associations of varus thrust and alignment with pain in knee osteoarthritis. Arthritis Rheum 2012;64:2252–2259. PMID:22307813, DOI:10.1002/art.34422
- 3. Chang A, Hochberg M, Song J, Dunlop D, Chmiel JS, Nevitt M, Hayes K, Eaton C, Bathon J, Jackson R, Kwoh CK, Sharma L: Frequency of varus and valgus thrust and factors associated with thrust presence in persons with or at higher risk of developing knee osteoarthritis. Arthritis Rheum 2010;62:1403–1411. PMID:20213800, DOI:10.1002/art.27377
- 4. Fukaya T, Mutsuzaki H, Wadano Y: Kinematic analysis of knee varus and rotation movements at the initial stance phase with severe osteoarthritis of the knee. Knee 2015;22:213–216. PMID:25795547, DOI:10.1016/j.knee.2015.02.012
- 5. Kuroyanagi Y, Nagura T, Kiriyama Y, Matsumoto H, Otani T, Toyama Y, Suda Y: A quantitative assessment of varus thrust in patients with medial knee osteoarthritis. Knee 2012;19:130–134. PMID:21300549, DOI:10.1016/j.knee.2010.12.007
- 6. Chang AH, Chmiel JS, Moisio KC, Almagor O, Zhang Y, Cahue S, Sharma L: Varus thrust and knee frontal plane dynamic motion in persons with knee osteoarthritis. Osteoarthritis Cartilage 2013;21:1668–1673. PMID:23948980, DOI:10.1016/j.joca.2013.08.007
- 7. Mahmoudian A, van Dieen JH, Bruijn SM, Baert IA, Faber GS, Luyten FP, Verschueren SM: Varus thrust in women with early medial knee osteoarthritis and its relation with the external knee adduction moment. Clin Biomech (Bristol, Avon) 2016;39:109–114. PMID:27744006, DOI:10.1016/j.clinbiomech.2016.10.006
- 8. Clermont CA, Barden JM: Accelerometer-based determination of gait variability in older adults with knee osteoarthritis. Gait Posture 2016;50:126–130. PMID:27607303, DOI:10.1016/j.gaitpost.2016.08.024
- 9. Guo L, Xiong S: Accuracy of base of support using an inertial sensor based motion capture system. Sensors (Basel) 2017;17:2091. PMID:28895897, DOI:10.3390/s17092091
- 10. Leardini A, Lullini G, Giannini S, Berti L, Ortolani M, Caravaggi P: Validation of the angular measurements of a new inertial-measurement-unit based rehabilitation system: comparison with state-of-the-art gait analysis. J Neuroeng Rehabil 2014;11:136. PMID:25212257, DOI:10.1186/1743-0003-11-136
- 11. Vitali R, Cain S, McGinnis R, Zaferiou A, Ojeda L, Davidson S, Perkins N: Method for estimating three-dimensional knee rotations using two inertial measurement units: validation with a coordinate measurement machine. Sensors (Basel) 2017;17:1970. PMID:28846613, DOI:10.3390/s17091970
- 12. Seel T, Raisch J, Schauer T: IMU-based joint angle measurement for gait analysis. Sensors (Basel) 2014;14:6891–6909. PMID:24743160, DOI:10.3390/s140406891
- 13. Tanimoto K, Takahashi M, Tokuda K, Sawada T, Anan M, Shinkoda K: Lower limb kinematics during the swing phase in patients with knee osteoarthritis measured using an inertial sensor. Gait Posture 2017;57:236–240. PMID:28668737, DOI:10.1016/j.gaitpost.2017.06.017
- 14. Pratt K, Sigward S: Inertial sensor angular velocities reflect dynamic knee loading during single limb loading in individuals following anterior cruciate ligament reconstruction. Sensors (Basel) 2018;18:3460. PMID:30326570, DOI:10.3390/s18103460
- 15. Igarashi Y, Komatsu A, Iwami T, Tsukamoto H, Shimada Y, editors: Comparison of MARG Sensor Results for Different Mounting Positions and Physiques for Accurate Knee Joint Motion Measurement. 2019 4th Asia-Pacific Conference on Intelligent Robot Systems (ACIRS); 2019 13–15 July 2019.
- 16. Kellgren JH, Lawrence JS: Radiological assessment of osteo-arthrosis. Ann Rheum Dis 1957;16:494–502. PMID:13498604, DOI:10.1136/ard.16.4.494
- 17. Omori G, Narumi K, Nishino K, Nawata A, Watanabe H, Tanaka M, Endoh K, Koga Y: Association of mechanical factors with medial knee osteoarthritis: a cross-sectional study from Matsudai Knee Osteoarthritis Survey. J Orthop Sci 2016;21:463–468. PMID:27151074, DOI:10.1016/j.jos.2016.03.006
- 18. Sharma L, Chmiel JS, Almagor O, Moisio K, Chang AH, Belisle L, Zhang Y, Hayes KW: Knee instability and basic and advanced function decline in knee osteoarthritis. Arthritis Care Res 2015;67:1095–1102. PMID:25732594, DOI:10.1002/acr.22572
- 19. Yoshimura I, Naito M, Hara M, Zhang J: The effect of wedged insoles on the lateral thrust of anterior cruciate ligament-insufficient knees. Am J Sports Med 2003;31:999–1002. PMID:14623670, DOI:10.1177/03635465030310064201
- 20. Dixon PC, Gomes S, Preuss RA, Robbins SM: Muscular co-contraction is related to varus thrust in patients with knee osteoarthritis. Clin Biomech (Bristol, Avon) 2018;60:164–169. PMID:30380443, DOI:10.1016/j.clinbiomech.2018.10.021
