Abstract
This study compared interpretation of irregular and/or linear opacities (IR) among experts and beginners who learned the International Classification of High-Resolution Computed Tomography for Occupational and Environmental Respiratory Diseases. The accuracy of interpretation of results among beginners was consistent compared to that of experts after training. It is important to further improve and develop training methods and materials for inexperienced physicians.
INTRODUCTION
Chest computed tomography (CT) findings have the same level of importance as pathological findings in the diagnostic guidelines for asbestos-related diseases of the American Thoracic Society [1]. Asbestosis and asbestos-related opacities have been quantitatively evaluated by the International Labour Organization Classification/International Classification of Radiographs of Pneumoconioses [2] using chest X-rays, but such evaluation method for CT was lacking. Therefore, the International Classification of High-Resolution Computed Tomography (HRCT) for Occupational and Environmental Respiratory Diseases (ICOERD) has been developed as a method to quantitatively classify and describe HRCT findings for occupational environment-induced respiratory diseases [3]. The use of this classification is expected to enable standardisation of HRCT interpretation and international comparison. The Helsinki Criteria 2014 recommended use of the ICOERD for international comparative studies of asbestos diseases [4]. The ICOERD is also used for epidemiological research in Germany, Finland, Japan, and the United States [5-11]. This classification has been used to diagnose malignant pleural mesothelioma [12,13].
Among these studies, Vierriko et al. used an independently developed classification system in Finland before the ICOERD, to assess fibrosis due to asbestos [5]. This independent classification was referenced at the time that the ICOERD was developed, and the ICOERD included this classification. Therefore, Vierriko et al.’s classification can be considered equivalent to the ICOERD.
Suganuma et al. reported the reproducibility of reference images of the ICOERD among experts who participated in the development of the classification [14,15]. Tamura et al. [16,17] and Şener et al. [18] reported the accuracy of grading using the ICOERD with chest X-rays or respiratory function tests as the gold standards. Vehmas and Oksa reported the validity of ICOERD signs by associating them with the long-term mortality of patients [7].
However, reports on training methods or the accuracy and reproducibility of interpretation among beginners who have never used the ICOERD are lacking. Therefore, this study aimed to compare whether participants who first learned the ICOERD through our lecture could interpret irregular and/or linear opacities (IR) to the same extent as experts.
SUBJECTS AND METHODS
Classification
The ICOERD divides the entire lung into six lung fields: upper, middle, and lower fields of the left and right lungs. Depending on the type of lung parenchymal opacities, they are described separately for each item, such as rounded opacities (RO), irregular and/or linear opacities (IR), emphysema (EM). Each item has a grade of 0 to 3 on each slice. Grades are determined for each slice according to severity by comparing them with a series of printed films for reference images including 2 normal cases. Thereafter, the grades of the six lung zones are summed to give a final sum grade between 0 and 18.
Study population and cases
We selected five experts in chest radiology who were experienced in interpreting chest HRCTs using the ICOERD. These experts included three ICOERD developers. We also selected three radiologists and three chest physicians as beginners who had no experience with the ICOERD. Radiologists and chest physicians were selected because they are key clinical staff that help in the diagnosis of asbestosis. In fact, radiologists and chest physicians need to have the ability to read and interpret findings of chest CT in the guidelines of academic societies. The criterion for participation was that they had NIOSH B Reader [19] qualification, which indicates expertise in the interpretation of chest X-rays for asbestos diseases. For radiologists, it was confirmed that they had experience in HRCT interpretation of interstitial pneumonia and pneumoconiosis for ≥ 5 years. The chest physicians were academically certified in Thailand societies, read HRCT images for interstitial pneumonia and pneumoconiosis for ≥ 5 years, and had experience with HRCT evaluation based on the results of the radiologists’ interpretation.
In order to evaluate the sensitivity and specificity for CT records, it is necessary to include normal cases for specificity, and in order to evaluate the sensitivity, we decided to select abnormal cases including mild, moderate, and advanced cases. Assessments from normal, mild to severe findings were based on the ILO classification, which is commonly used to assess the severity of pneumoconiosis. Six cases were selected, including two healthy (control) cases without abnormal lung opacity and four cases with low to high profusions of irregular opacities due to asbestos exposure. As mentioned above, since the use of ICOERD is recommended by the Helsinki Criteria 2014 [4] for the international studies on asbestos-related diseases, the cases where asbestos exposure caused irregular opacities on Chest X-rays were used.
According to the experts’ interpretation, the cases mainly ranged from 0 to 9 for the summed grade of IR findings. According to the kappa (κ) value, the agreement was judged to range from moderate to good according to Altman’s proposed criteria [20].
Training and interpretation
Three radiologists and three chest physicians were given a 1.5-h course on interpretation using the ICOERD. During the course, a part of the monograph of the ICOERD (Chapter 2) [3], reference films, and a handout of the lecture were distributed. The lecture included an explanation on how to describe the findings based on the ICOERD. During the lecture, a sketch of each reference film and the interpretation result corresponding to the correct answer were presented. We mainly explained RO, IR, EM, ground-glass opacities (GGO), honeycombing, large opacities, and pleural thickening. For the practice of interpretation, the participants recorded the coding result of five cases, and we gave them an example of the correct answer. Table 1 shows the time allocation for each content of the lecture. Some of the toolkits’ slides presented during the lecture, including RO, IR, and GGO reference images, are shown in the Appendix. All the reference images are included in the monographs [3].
Five experts independently read the examination of six cases using the ICOERD and recorded their interpretation results on coding sheets of the ICOERD. Both experts and participants completed readings of the case image findings and compared them to the reference films of the ICOERD. We allowed participants to refer to only to the materials distributed by us, e.g., a part of the monograph, handout, and reference films. We also prohibited them from consulting other doctors. We only examined the findings for IR according to the ICOERD because the example cases were collected based on occupational asbestos exposure history and related chest X-ray findings.
Table 1.
Time allocation for each content of the lecture
| Content |
Time
(min)
|
| Overview of the ICOERD |
10 |
| Rounded opacities |
10 |
| Irregular and/or linear opacities |
10 |
| Ground-glass opacities |
5 |
| Honeycombing |
5 |
| Large opacities |
5 |
| Pleural thickening |
15 |
| Representative example of symbols (10 cases) |
10 |
| Practice of interpretation with the correct answer (5 cases) |
20 |
| Total |
90 |
ICOERD: International Classification of High-Resolution Computed Tomography for Occupational and Environmental Respiratory Diseases.
Statistical analysis
The grades of the six lung fields in each case were added together in the ICOERD system to calculate the summed grade for each case, and the grade of each slice is on an ordinal scale, not a numeric value. Therefore, nonparametric processing was used to compare the grades statistically. We performed the Wilcoxon test to assess whether there was a difference (over/underreading accuracy) in the median grade of each lung field between the experts and participants. We performed the Kruskal-Wallis test to determine whether there was a difference in the median grades in each lung field between the experts, radiologists, and chest physicians. The Steel-Dwass test was used to perform multiple comparisons.
The κ statistic was used to determine the degree of agreement (reproducibility) within each group of experts, radiologists, and chest physicians. The mean κ values were interpreted according to the following guideline proposed by Altman: < 0.20, poor; 0.21–0.40, fair; 0.41–0.60, moderate; 0.61–0.80, good; and 0.81–1.00, very good [20]. We calculated the weighted κ value for each set of two doctors in the groups. The difference in the degree of agreement between the groups was examined by comparing the κ values.
To avoid systematic errors among the readers in the expert group, the median grade of each slice was used as the correct answer. The weighted κ value was calculated as the degree of agreement (accuracy-1) between the readers’ interpretations and the correct answer. The differences in accuracy (accuracy-1) of each group with respect to the correct answer were examined by comparing the κ values. The nonparametric Wilcoxon and Kruskal-Wallis tests were performed on these κ values, and the Steel-Dwass test was used to perform multiple comparisons.
To evaluate an accuracy (accuracy-2) similar to sensitivity and specificity, the images were stratified into two groups: slice group without abnormalities, 16 lung fields in which the grade of IR was determined to be 0 and slice group with abnormalities, 20 lung fields in which the grade was determined to be 1 or more based on the correct answer. The Kruskal-Wallis test and Steel-Dwass method were used to assess whether there was a significant difference in IR grade values given by experts, radiologists, and chest physicians for each group.
R version 3.1.2 [21] was used to perform all statistical analyses. A p-value < 0.05 was considered statistically significant.
RESULTS
Baseline data
Other findings including RO, EM, etc. were absent in many cases, and the summed grade was low (Table 2). Table 3 shows the κ values for the IR grade agreement between the experts.
Table 2.
Summary of high-resolution computed tomography interpretation results of test cases based on the experts’ interpretation results
|
RO |
IR |
GGO |
HC |
EM |
LO |
PLQ |
| Healthy 1 |
0 |
0 |
0 |
0 |
1 |
0 |
absence |
| Healthy 2 |
0 |
0 |
0 |
0 |
0 |
0 |
absence |
| Case 1 |
0 |
8 |
2 |
2 |
0 |
0 |
presence |
| Case 2 |
0 |
6 |
0 |
0 |
0 |
0 |
presence |
| Case 3 |
2 |
9 |
2 |
2 |
0 |
0 |
presence |
| Case 4 |
6 |
2 |
1 |
0 |
6 |
0 |
absence |
The number is the experts’ sum grade of findings.
RO: rounded opacities, IR: irregular and/or linear opacities, GGO: ground-glass opacities, HC: honeycombing, EM: emphysema, LO: large opacities, PLQ: pleural thickening.
Table 3.
Kappa values for irregular and/or linear opacities grade between pairs of five experts
|
Expert 1 |
Expert 2 |
Expert 3 |
Expert 4 |
Expert 5 |
| Expert 1 |
|
0.6457 |
0.6292 |
0.5596 |
0.6853 |
| Expert 2 |
0.6457 |
|
0.5787 |
0.5309 |
0.4906 |
| Expert 3 |
0.6292 |
0.5787 |
|
0.6226 |
0.7964 |
| Expert 4 |
0.5596 |
0.5309 |
0.6226 |
|
0.4636 |
| Expert 5 |
0.6853 |
0.4906 |
0.7964 |
0.4636 |
|
The mean kappa values were interpreted according to the guideline proposed by Altman: <0.20, poor; 0.21–0.40, fair; 0.41–0.60, moderate; 0.61–0.80, good; and 0.81–1.00, very good [20].
Overreading/Underreading accuracy
There was no significant difference in the median IR grade between the experts and participants. However, a significant difference in the median IR grade was observed between the experts, radiologists, and chest physicians, and a significant difference was also noted between the experts and radiologists (Table 4).
Table 4.
Number of slices for each irregular and/or linear opacities grade result among each group
|
IR grade |
Total |
Multiple comparison |
| 0 |
1 |
2 |
3 |
| Experts |
87 |
62 |
28 |
3 |
180 |
* |
| Participants |
76 |
95 |
43 |
2 |
216 |
|
| Radiologists |
35 |
49 |
22 |
2 |
108 |
* |
| Chest physicians |
41 |
46 |
21 |
0 |
108 |
|
IR: irregular and/or linear opacities.
Participants included the three radiologists and three chest physicians.
There were no significant differences between experts and participants according to the Wilcoxon test.
There was a significant difference among the groups of experts, radiologists, and chest physicians according to the Kruskal-Wallis test (p<0.05).
*There was a significant difference according to the Steel-Dwass test for multiple comparisons (p<0.05).
Reproducibility
Table 5 shows the agreement (range, 0.713–0.174) between the physicians. There were some good agreements and as well as some poor agreements. The mean κ values of the experts, radiologists, and chest physicians were 0.60 ± 0.098, 0.50 ± 0.16, and 0.43 ± 0.24, respectively (Table 6). The agreements for radiologists and chest physicians seemed to be poorer than those for experts. Nevertheless, significant differences were not observed between the groups.
Table 5.
Kappa values for the irregular and/or linear opacities grade among all participants
|
Radiologist 1 |
Radiologist 2 |
Radiologist 3 |
Chest physician 1 |
Chest physician 2 |
Chest physician 3 |
| Radiologist 1 |
|
0.3265 |
0.5385 |
0.3662 |
0.46 |
0.18609 |
| Radiologist 2 |
0.3265 |
|
0.6393 |
0.7055 |
0.174051 |
0.6697 |
| Radiologist 3 |
0.5385 |
0.6393 |
|
0.7126 |
0.2731 |
0.3278 |
| Chest physician 1 |
0.3662 |
0.7055 |
0.7126 |
|
0.5015 |
0.6186 |
| Chest physician 2 |
0.46 |
0.174051 |
0.2731 |
0.5015 |
|
0.163462 |
| Chest physician 3 |
0.18609 |
0.6697 |
0.3278 |
0.6186 |
0.163462 |
|
IR: irregular and/or linear opacities.
The mean kappa values were interpreted according to the guideline proposed by Altman: <0.20, poor; 0.21–0.40, fair; 0.41–0.60, moderate; 0.61–0.80, good; and 0.81–1.00, very good [20].
Table 6.
Mean and standard deviation of kappa values for each group
| Group |
Kappa value (mean ± SD) |
n |
| Experts |
0.600 (± 0.098) |
10 |
| Participants |
0.444 (± 0.194) |
15 |
| Radiologists |
0.501 (± 0.160) |
3 |
| Chest physicians |
0.428 (± 0.236) |
3 |
The mean kappa values were interpreted according to the guideline proposed by Altman: <0.20, poor; 0.21–0.40, fair; 0.41–0.60, moderate; 0.61–0.80, good; and 0.81–1.00, very good [20].
Participants included three radiologists and three chest physicians.
There was no significant difference between the experts and participants according to the Wilcoxon test.
There was no significant difference between the experts, radiologists, and chest physicians according to the Kruskal-Wallis test.
Accuracy-1
With respect to accuracy-1, the mean κ values for the correct answer among the groups of experts, radiologists, and chest physicians were 0.73 ± 0.11 (good), 0.64 ± 0.17 (good), and 0.43 ± 0.11 (moderate), respectively. Significant difference was lacking between the groups (Table 7).
Table 7.
Mean and standard deviation of kappa values for the correct answer in each group
| Group |
Kappa value (mean ± standard deviation) |
n |
| Experts |
0.730 ± 0.113 |
5 |
| Participants |
0.544 ± 0.178 |
6 |
| Radiologists |
0.654 ± 0.174 |
3 |
| Chest physicians |
0.434 ± 0.112 |
3 |
The mean kappa values were interpreted according to the guideline proposed by Altman: <0.20, poor; 0.21–0.40, fair; 0.41–0.60, moderate; 0.61–0.80, good; and 0.81–1.00, very good [20].
Participants included three radiologists and three chest physicians.
There was no significant difference between the experts and participants according to the Wilcoxon test.
There was no significant difference between the experts, radiologists, and chest physicians according to the Kruskal-Wallis test.
Accuracy-2
For the slice group without abnormalities, the numbers of slices that the experts, radiologists, and chest physicians described as having grade 1 findings were 5, 14, and 21, respectively (Table 8). The participants described more slices as having findings than the experts, and there was a significant difference in the median grades between these groups. For the slice group without abnormalities, the numbers of slices that the experts, radiologists, and chest physicians described as having grade 1 or more findings are shown in Table 9. There was no significant difference in the median grades between the groups.
Table 8.
Number of slices for each irregular and/or linear opacities grade among experts, radiologists, and chest physicians for the slice group without abnormalities
|
IR grade |
Total |
Multiple comparison |
| 0 |
1 |
| Experts |
75 |
5 |
80 |
#$
|
| Radiologists |
34 |
14 |
45 |
#
|
| Chest physicians |
27 |
21 |
45 |
$
|
IR: irregular and/or linear opacities.
There was a significant difference according to the Kruskal-Wallis test (p<0.05).
#, $: There was a significant difference according to the Steel-Dwass test for multiple comparisons (p<0.05).
Table 9.
Number of slices for each irregular and/or linear opacities grade among experts, radiologists, and chest physicians for the slice group with abnormalities
|
IR grade |
n |
| 0 |
1 |
2 |
3 |
| Experts |
12 |
57 |
28 |
0 |
100 |
| Radiologists |
1 |
35 |
28 |
2 |
60 |
| Chest physicians |
14 |
25 |
21 |
3 |
60 |
IR: irregular and/or linear opacities.
There was no significant difference between the groups according to the Kruskal-Wallis test.
DISCUSSION
Regarding reproducibility, Suganuma et al. [15] reported that the κ value among the developers of the ICOERD was 0.59–0.48. In the current study, the κ value of the IR severity (grade) of the experts was 0.6, which was reported by Suganuma et al. Thus, the moderate reproducibility of interpretation by the experts could be observed again. In contrast, the participants had slightly lower κ values: 0.50 for radiologists and 0.43 for chest physicians in X-rays of lungs with asbestosis and healthy lungs, but there was no significant difference between the groups according to the Kruskal-Wallis test.
Pertaining to accuracy (accuracy-1), the agreement with the correct answer was compared using the κ value, but there was no significant difference between the experts, radiologists, and chest physicians. With regard to other accuracy (overreading/underreading accuracy [accuracy-2]), all participants described no significantly higher grades, but radiologists described significantly higher grades (overreading/underreading accuracy). These findings suggest that radiologists may tend to overinterpret the findings. Furthermore, there was a significant difference in accuracy-2 between the experts and participants for the group without abnormalities. This finding suggests that there were significantly more beginners interpreting a false-positive finding. There was no significant difference in accuracy-2 between the experts and participants in the group with abnormalities. In other words, there might have been many false positives among beginners.
False positives can also occur in chest CT when using the chest X-ray as the gold standard in diffuse lung disease [22]. Assumably, false positives for healthy CT slices tended to occur in the current study as well. Therefore, it’s more likely that beginners may give false positives than experts.
Regarding the educational effect, it is desirable that the interpretation result of the beginner is equivalent to that of the expert, and there were very few false positives in the present study. There are several possible reasons for the false positives found in the current study. One reason is that there was a problem with the training set used as training. Since only 5 cases with abnormal findings were used in the practice of interpretation for training, it was necessary to practice additionally reading of 1-2 normal cases. Another reason could be that the novice is not paying attention to the normal cases used in the training course. During lectures, it is necessary to educate participants to pay attention to normal cases and to beware of over-interpretation. In addition to this, it is also considered useful for the reader to always have normal reference images at hand when reading the exam images, in order to adjust the readers’ insight to the normal image.
In the current study, each lung field finding was targeted. However, when ICOERD is used for diagnosis, asbestosis is diagnosed for each case. Hence, diagnosis cannot be achieved only by evaluation of each lung field, but it can be achieved by summing the six lung field findings. According to the Helsinki Criteria 2014, it was recommended that ‘fibrosis sufficient for asbestosis according to the ICOERD system could represent the sum grade of ≥ 2–3 irregular opacities or bilateral honeycombing (sum grade ≥ 2)’ [4].
Although the interpretation was standardised by the training course in the present study, there was bias among the readers. Therefore, in actual epidemiological and clinical studies, it is desirable to have the images evaluated by multiple trained readers, preferably three or more.
Lung disease diagnosis and disease progress staging using deep learning of CT and chest radiography are currently under development [23,24] and are expected to be used for evaluation of the severity of pneumoconiosis in the near future. Since these assistive technologies have the potential to change the diagnostic method, independently of whether physicians are experts or beginners, it is necessary to apply the technique to future trends.
Limitations
First, the number of cases and participants was small in the current study. These facts statistically limit the power to detect differences between observations. Second, at the time of CT case collection, we focused on asbestos exposure-related irregular shadows on chest X-rays; therefore, we could not examine other findings on CT, such as RO and GGO. However, the participants of the current study were all NIOSH B readers, despite being new to the ICOERD, and they had had sufficient experience in reading chest X-rays. Finally, we did not develop a specific educational tool for chest physicians and radiologists who had limited experience with CT or chest radiography.
CONCLUSIONS
By taking a brief course, physicians inexperienced with the ICOERD were able to obtain reading results that were almost as accurate and reproducible as those of the experts. At the same time, we found a tendency for overreading, which can be addressed in the training course. It is important to further improve and develop the training methods and materials for inexperienced physicians as ICOERD is used widely.
Ethical approval
Informed consent was obtained from the participants. The ethical committee of the University of Fukui approved this study (number: 670 on March 27, 2013).
Author contributions
All authors contributed to the study conception and design. Material preparation, data collection and analysis were performed by Taro Tamura. The first draft of the manuscript was written by Taro Tamura and all authors commented on previous versions of the manuscript. All authors read and approved the final manuscript.
Acknowledgements
We wish to acknowledge the following participants: Dr. Nuttapol Rittayamai, Dr. Piamlarp Sangsayunh, Dr. Sutarat Tungsadgunwattana, Dr. Krisna Dissaneevate and Dr. Pratirop Poonotoke. The reference films in Appendix were originally published in the monograph [3] and are re-published with the kind permission of Springer Science and Business Media.
Conflicts of interest
All authors confirm that there are no conflicts of interest to declare.
Data availability
The datasets generated during and/or analysed during the current study are available from the corresponding author on reasonable request.
APPENDIX
Examples of Reference Images presented in the brief lecture
A part of the slides showing the reference image used in the brief lecture are presented as figures (Fig. 1–3).
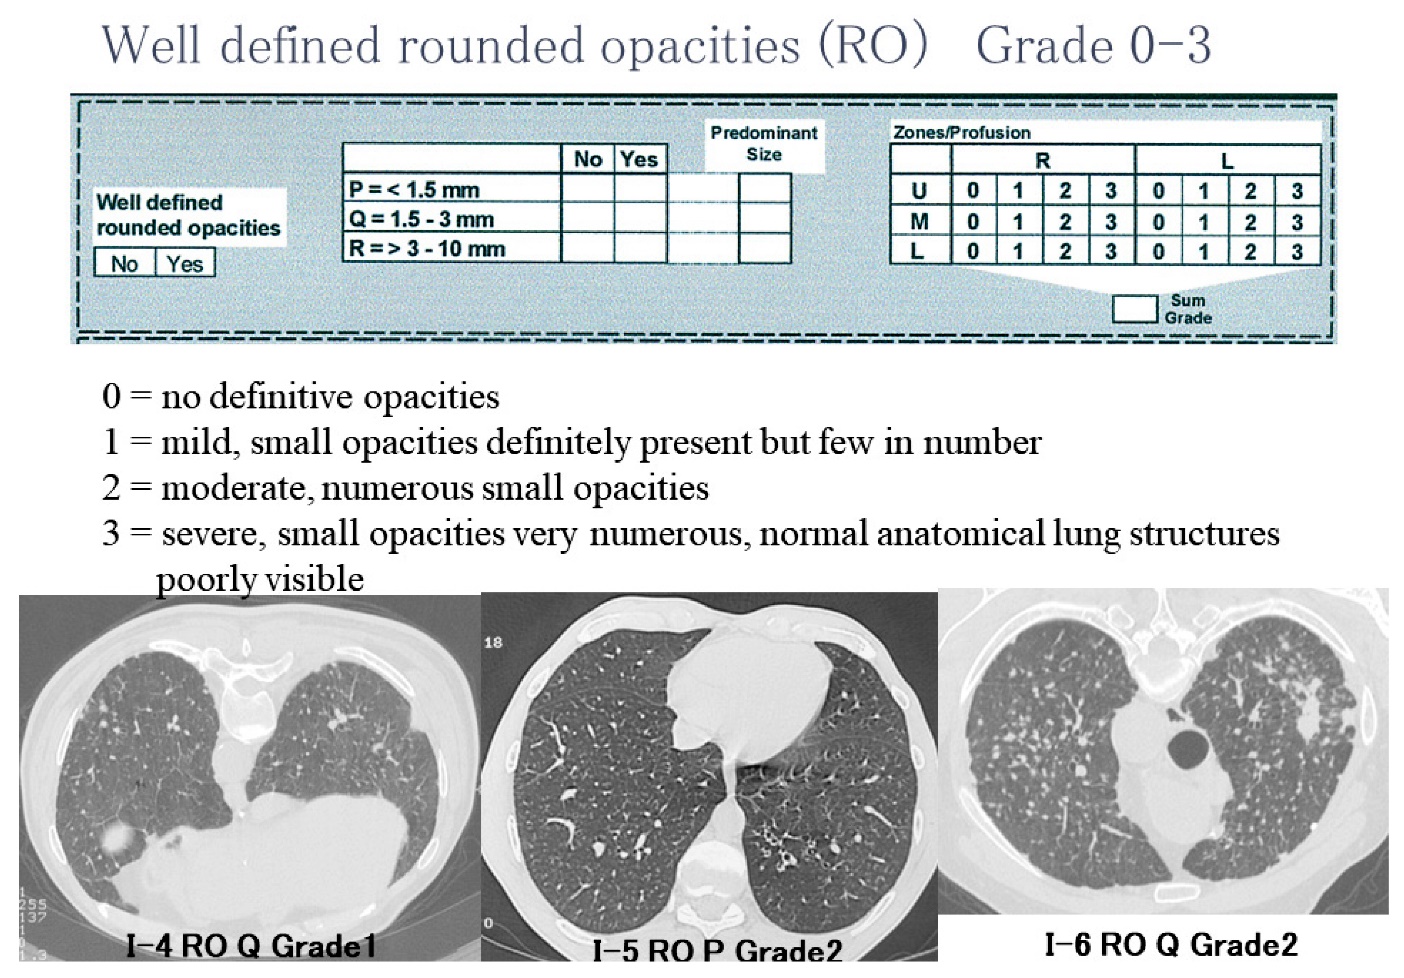
Figure 1. The lecture slide of reference images for rounded opacities
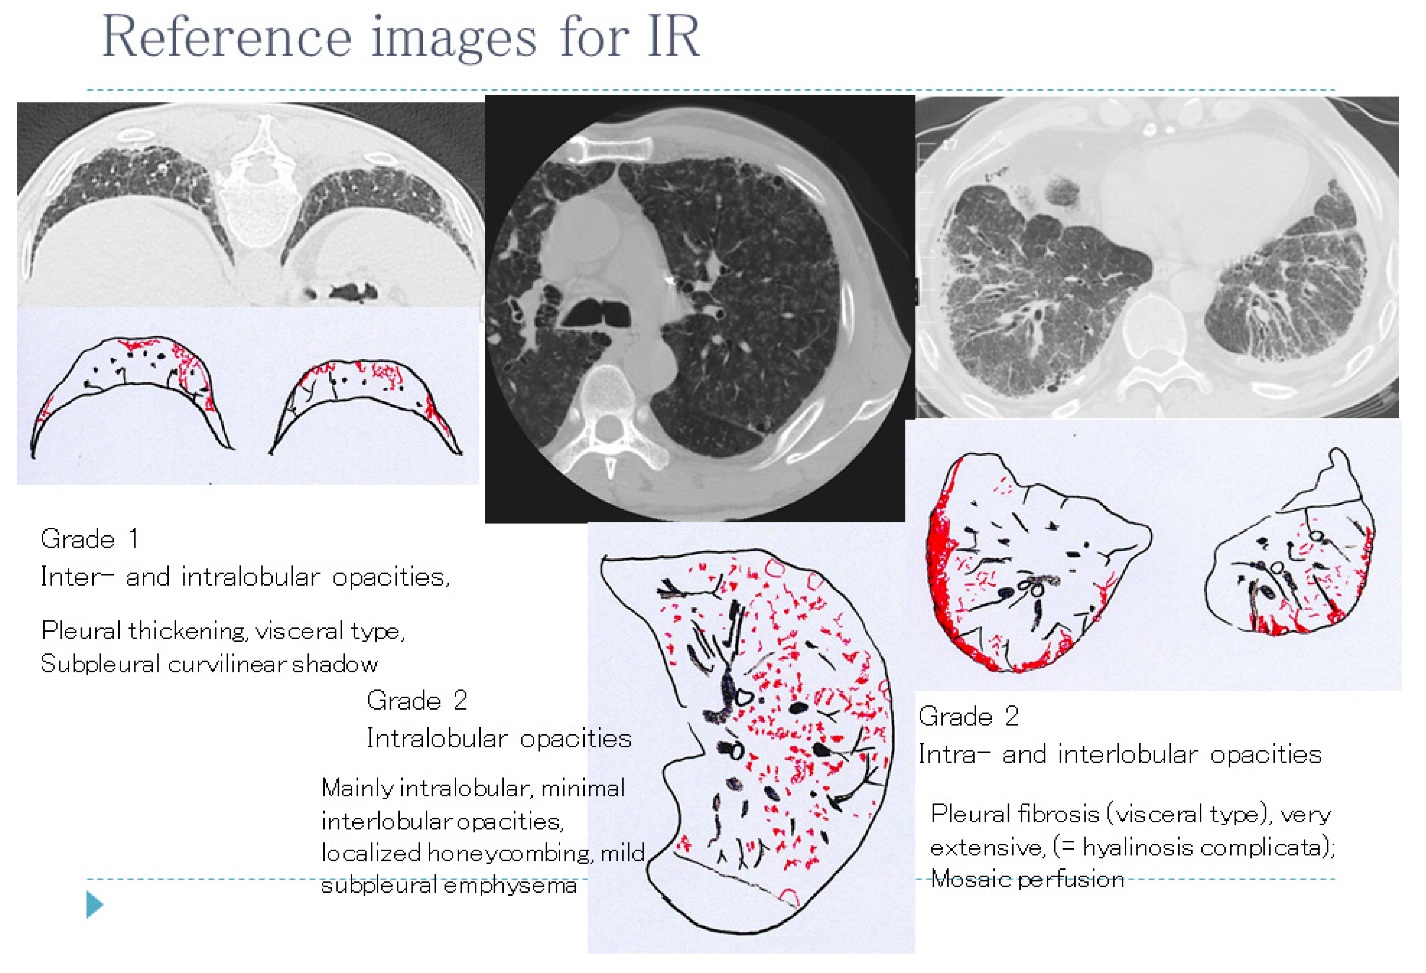
Figure 2. The lecture slide of reference images for irregular and/or linear opacities
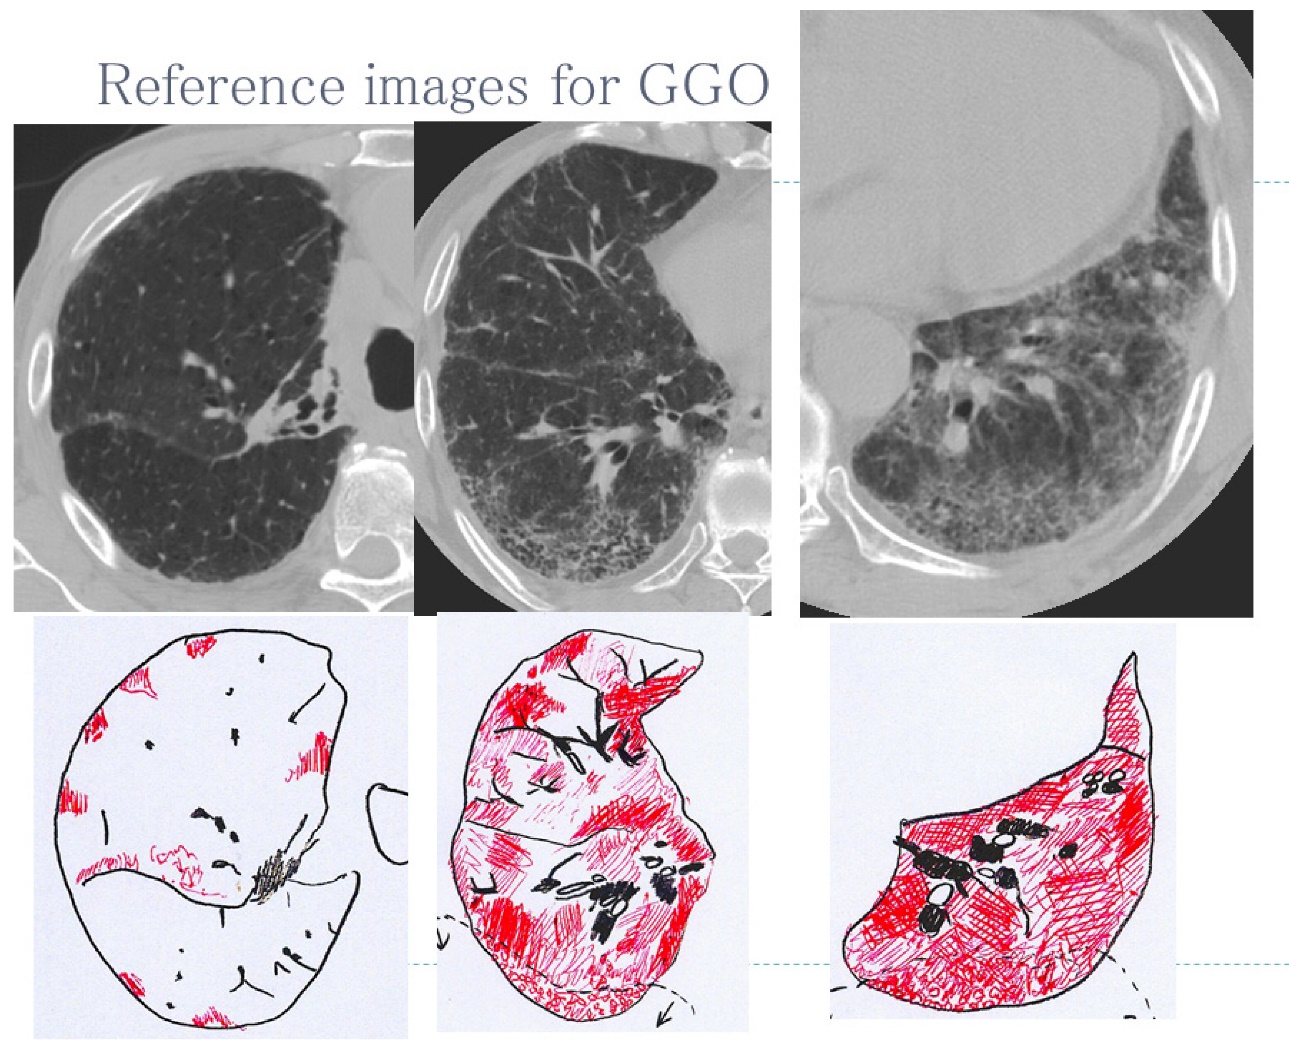
Figure 3. The lecture slide of reference images for ground-glass opacities
REFERENCES
- 1) American Thoracic Society. Diagnosis and initial management of nonmalignant diseases related to asbestos. Am J Respir Crit Care Med 2004;170:691-715. doi: 10.1164/rccm.200310-1436ST.
- 2) International Labor Office. Guideline for the use of ILO International classification of radiographs of pneumoconiosis. Geneva, Switzerland: International Labor Office; 2015.
- 3) Kusaka Y, Hering KG, Parker JE. International classification of HRCT for occupational and environmental respiratory diseases. Tokyo: Springer; 2005.
- 4) Wolff H, Vehmas T, Oksa P, Rantanen J, Vainio H. Asbestos, asbestosis, and cancer, the Helsinki criteria for diagnosis and attribution 2014: recommendations. Scand J Work Environ Health 2015;41:5-15. doi: 10.5271/sjweh.3462.
- 5) Vierikko T, Järvenpää R, Toivio P, et al. Clinical and HRCT screening of heavily asbestos-exposed workers. Int Arch Occup Environ Health 2010;83:47-54. doi: 10.1007/s00420-009-0462-1.
- 6) Meijer E, Tjoe Nij E, Kraus T, et al. Pneumoconiosis and emphysema in construction workers: results of HRCT and lung function findings. Occup Environ Med 2011;68:542-6. doi: 10.1136/oem.2010.055616.
- 7) Vehmas T, Oksa P. Chest HRCT signs predict deaths in long-term follow-up among asbestos exposed workers. Eur J Radiol 2014;83:1983-7. doi: 10.1016/j.ejrad.2014.06.027.
- 8) Takahashi M, Nitta N, Kishimoto T, Ohtsuka Y, Honda S, Ashizawa K. Computed tomography findings of arc-welders’ pneumoconiosis: Comparison with silicosis. Eur J Radiol 2018;107:98-104. doi: 10.1016/j.ejrad.2018.08.020.
- 9) Tamura A, Funakoshi M, Naw Awn J-P, et al. Potential asbestos exposure among patients with primary lung cancer in Japan. J Occup Health 2018;60:236-45. doi: 10.1539/joh.2017-0199-OA.
- 10) de la Hoz RE, Weber J, Xu D, et al. Chest CT scan findings in World Trade Center workers. Arch Environ Occup Health 2019;74:263-70. doi: 10.1080/19338244.2018.1452712.
- 11) Nogami S, J-P NA, Nogami M, et al. Radiographic diagnosis of Pneumoconioses by AIR Pneumo-trained physicians: Comparison with low-dose thin-slice computed tomography. J Occup Health 2020;62:e12141. doi: 10.1002/1348-9585.12141.
- 12) Zhou H, Tamura T, Kusaka Y, et al. Development of a guideline on reading CT images of malignant pleural mesothelioma and selection of the reference CT films. Eur J Radiol 2021;81:4203-10. doi: 10.1016/j.ejrad.2012.08.008.
- 13) Zhou H, Tamura T, Kusaka Y, et al. Evaluation of the efficacy of the guideline on reading CT images of malignant pleural mesothelioma with reference CT films for improving the proficiency of radiologists. Eur J Radiol 2013;82:169-76. doi: 10.1016/j.ejrad.2012.05.022.
- 14) Suganuma N, Kusaka Y, Hering KG, et al. Selection of reference films based on reliability assessment of a classification of high-resolution computed tomography for pneumoconioses. Int Arch Occup Environ Health 2006;79:472-6. doi: 10.1007/s00420-005-0067-2.
- 15) Suganuma N, Kusaka Y, Hering KG, et al. Reliability of the proposed international classification of high-resolution computed tomography for occupational and environmental respiratory diseases. J Occup Health 2009;51:210-22. doi: 10.1539/joh.l8030.
- 16) Tamura T, Suganuma N, Hering KG, et al. Relationships (I) of International Classification of High-resolution Computed Tomography for Occupational and Environmental Respiratory Diseases with the ILO International Classification of Radiographs of Pneumoconioses for parenchymal abnormalities. Ind Health 2015;53:260-270. doi: 10.2486/indhealth.2014-0073.
- 17) Tamura T, Suganuma N, Hering KG, et al. Relationships (II) of International Classification of High-resolution Computed Tomography for Occupational and Environmental Respiratory Diseases with ventilatory functions indices for parenchymal abnormalities. Ind Health 2015;53:271-9. doi: 10.2486/indhealth.2014-0072.
- 18) Şener MU, Şimşek C, Özkara Ş, Evran H, Bursali I, Gokcek A. Comparison of the International Classification of High-resolution Computed Tomography for occupational and environmental respiratory diseases with the International Labor Organization International Classification of Radiographs of Pneumoconiosis. Ind Health 2019;57:495-502. doi: 10.2486/indhealth.2018-0068.
- 19) Wagner GR, Attfield MD, Kennedy RD, Parker JE. The NIOSH B reader certification program. An update report. J Occup Med 1992;34:879-84.
- 20) Altman DG. Inter-rater agreement. In: Altman DG, ed. Practical statistics for medical research. London: Chapman & Hall/CRC; 1991:403-409.
- 21) R Core Team (2014). R: A language and environment for statistical computing. R Foundation for Statistical Computing, Vienna, Austria. https://www.R-project.org/.
- 22) Mathieson JR, Mayo JR, Staples CA, Müller NL. Chronic diffuse infiltrative lung disease: Comparison of diagnostic accuracy of CT and chest radiography. Radiology 1989;171:111-6. doi: 10.1148/radiology.171.1.2928513.
- 23) Suzuki K, Otsuka Y, Nomura Y, et al. Development and validation of a modified three-dimensional U-net deep-learning model for automated detection of lung nodules on chest CT images from the lung image database consortium and Japanese datasets. Acad Radiol 2022;29:S11-7. doi: 10.1016/j.acra.2020.07.030.
- 24) Zhang L, Rong R, Li Q, et al. A deep learning-based model for screening and staging pneumoconiosis. Sci Rep 2021;11:2201. doi: 10.1038/s41598-020-77924-z.