Original article
A Method for Simultaneous Quantification of Various Collagens by Using Nano-Liquid Chromatography Tandem Mass Spectrometry
2023 年 40 巻 1-2 号 p. 9-21
詳細
2023 年 40 巻 1-2 号 p. 9-21
Qualitative and quantitative changes in collagens are linked to various diseases. Monitoring of collagens may provide new insights into the assessment and diagnosis of collagen-related diseases. In this study, we established a method that enables simultaneous quantification of the α chains of types I, III, and V collagens, namely COL1A1, COL3A1, and COL5A1, in a culture medium of LX-2 human hepatic stellate cells using nano-liquid chromatography tandem mass spectrometry (nano-LC/MS/MS). Specifically, simultaneous quantification of multiple collagen α chains could be accomplished by using their specific target peptides. Compared with conventional enzyme-linked immunosorbent assay (ELISA), this method is more sensitive and efficient for simultaneous quantification of various collagens. These data suggested that our newly developed quantification method is valuable and could be used for the diagnosis of collagen-related diseases.
The extracellular matrix (ECM) is a non-cellular dynamic matrix network. The ECM plays an essential role in all tissues and organs [1]. Collagens, consisting of three α chains, are the primary components of the ECM [2]. Collagen consists of Glycine-X-Y triplet repeat domains, and most of the proline residues at the Y position are hydroxyproline [3]. Collagen is the most abundant protein in humans (about one-third of the total proteins) and is mainly present in connective tissues such as the skin, bone, cartilage, tendon, and cornea [4, 5]. Changes in collagen are associated with many diseases including liver fibrosis [6], osteogenesis imperfecta (OI) [7], osteoporosis [8], cancers [9], and Ehlers-Danlos syndrome (EDS) [10].
Among collagen-related diseases, EDS is a genetically heterogeneous connective tissue disorder mainly characterized by joint hypermobility, skin hyperextensibility, abnormal wound healing, and tissue fragility. EDS is now classified into 14 types with 20 different causal genes, and gene mutations related to type I, III, and V collagen, such as COL1A1, COL3A1, and COL5A1, are well known as one of the causes of EDS [10]. Thus, monitoring of these collagen α chains of types I, III, and V collagens, especially quantitative changes, is important and may provide new insights into collagen-related diseases.
Various methods for quantitative analyses of collagens have been developed. Generally, total collagen has been quantified using the hydroxyproline assay since large parts of hydroxyprolines are derived from collagen [11, 12]. However, it is not easy to quantify subtypes of collagen and post-translational modification (PTM) [13]. Additionally, for a specific collagen subtype, quantification has been implemented by methods using specific antibodies such as the enzyme-linked immunosorbent assay (ELISA) method [14]. In that case, quantification experiments for collagens must be performed independently with each antibody. Furthermore, insufficient accuracy and sensitivity might affect the results of quantification of collagens. So far, 28 different types of collagens have been identified in the human body [15, 16], but most of the quantitative analyses for collagens have been focused on one type or two types of collagens, mainly type I collagen. Therefore, the cost of experiments would increase if multiple collagens are quantified by using each specific antibody, and further efficient technical methods are needed for the quantification of collagens.
Liquid chromatography tandem mass spectrometry (LC/MS/MS) has been used as a powerful tool for qualitative and/or quantitative analyses of proteins and has great possibilities for research on collagens [17–21]. Collagens could be identified and quantified by using their specific target peptides in a wide range of body liquids or biomaterials in a single measurement without using antibodies. Nevertheless, accurate and efficient methods for the quantification of collagens using LC/MS/MS have not yet become widespread [22]. Ion suppression may affect the accuracy of quantification using LC/MS/MS [23], but stable isotope-labeled peptides have been adopted as an internal standard to overcome ion suppression [24, 25]. In addition, LC/MS/MS analyses based on multiple reaction monitoring (MRM) have been developed to improve the performance of quantification [26]. These analyses can selectively identify specific precursor ions and product ions from the peptide’s digests with high sensitivity. For example, Barallobre-Barreiro et al. [27] qualitatively examined proteomics in human varicose veins with MRM analysis of each ECM protein. Goto et al. [20] developed quantitative LC/MS/MS methods for type XIV collagen in tumor tissue specimens with primary breast cancer.
We also previously described a quantitative method for just the type I collagen α1 chain in a culture medium [28]. In the present study, we attempted to establish a method for simultaneous quantification of types I, III, and V collagen α chains in a culture medium of LX-2 human hepatic stellate (LX-2) cells by using nano-LC/MS/MS to monitor and quantify several kinds of collagens, so as to further develop our previous method. Considering the involvement of mutations in genes encoding collagens in the onset of diseases, this method would provide new insights into the evaluation and diagnosis of collagen-related diseases such as EDS.
Reagents
Commercially available types I, III, and V collagens purified from human placenta, pepsin, and 2-phospho-L-ascorbic acid trisodium salt were purchased from Sigma-Aldrich (St. Louis, MO, USA). The human hepatic stellate cell line LX-2 was from Merck Millipore (Burlington, MA, USA). Dulbecco’s Modified Eagle’s Medium (DMEM), penicillin and streptomycin, fetal bovine serum (FBS) and bicinchoninic acid (BCA) protein assay kit were from Thermo Fisher Scientific (Waltham, MA, USA). Trypsin was from AB Sciex (Foster, CA, USA). Unlabeled peptide and stable isotope-labeled peptide of each collagen were purchased as follows. Unlabeled peptide and the stable isotope-labeled peptide GVQGPP*GPAGPR for collagen type I α1 chain (COL1A1, UniProt accession number: P02452) were from CS Bio (Menlo Park, CA, USA). Unlabeled peptide and the stable isotope-labeled peptide GLAGPP*GMP*GPR for collagen type III α1 chain (COL3A1, UniProt accession number: P02461) were from GenScript (Piscataway, NJ, USA) and Cosmo Bio (Tokyo, Japan), respectively. Unlabeled peptide and the stable isotope-labeled peptide GPP*GPAGPEGR for collagen type V α1 chain (COL5A1, UniProt accession number: P20908) were from GenScript (Piscataway, NJ, USA) and CS Bio (Menlo Park, CA, USA), respectively. P* indicates hydroxyproline. All stable isotope labeled peptides had a stable isotope labeled arginine‒13C6, 15N4 residue in their C-terminus. Acetic acid, formic acid (FA), trifluoroacetic acid (TFA), hydrochloric acid (HCl), acetonitrile (ACN), and sodium chloride (NaCl) were from FUJIFILM Wako Pure Chemical Corporation (Osaka, Japan). Spin-XR UF concentrator was from Corning (Tewksbury, MA, USA). ELISA kits for human COL1A1 (CSB-E13445h), COL3A1 (CSB-E13446h), and COL5A1 (CSB-E13447h) were purchased from Cusabio (Houston, TX, USA).
Cell culture
LX-2 cells at passages 19–26 were seeded at a density of 1.5 × 10⁶ cells per 100 mm dish. The cells were maintained in DMEM containing 2% FBS, 50 μg/mL of streptomycin, and 50 units/mL of penicillin in a humidified 5% CO2 incubator at 37°C for 48 h. Then the medium was changed to DMEM containing 0.5% FBS and 200 μM 2-phospho-L-ascorbic acid with or without 5 ng/mL TGF-β1 (Bio-Techne, Minneapolis, MN, USA), and the cells were cultured for a further 48 h. Forty mL of the cell culture medium per extraction was collected three times. Then the collected medium was treated with the same experimental conditions as follows every time for collagen extraction, sample preparation, and quantification. Eventually, the triplicated quantification results for each of the collagens were consolidated with means ± standard deviation (SD) and coefficient of variation (CV) (Table 3).
Collagen extraction
The culture medium was collected and digested with 0.5 mg/mL pepsin in 0.1 N HCl at 4°C for 16 h by gentle rotation. Then salt precipitation was carried out with 1.2 M NaCl for 3 h on ice, and the solution was centrifuged at 30,000 g for 1 h at 4°C. After removing the supernatant, the collagen precipitate was washed with 1.2 M NaCl in 0.1 N HCl and dissolved in 5 mM acetic acid solution. The solution was concentrated using a Spin-X UF concentrator and the protein concentration was measured by a BCA assay kit.
Trypsin digestion and desalting
First, commercially available types I, III, and V collagens were dissolved in 0.5 M acetic acid. The solubilized commercial collagens and samples extracted from the conditional medium of LX-2 cells were neutralized with 0.1 M Tris-HCl in 0.4 M NaCl buffer (pH 7.4) and denatured at 60°C for 30 min. Trypsin digestion was performed at the ratio of 10:1 (protein: trypsin) for 16 h at 37°C. TFA was added to the digests to terminate the reaction. The digests were then desalted with a Sep-Pak C18 cartridge. The cartridge was washed with 1 mL of 0.1% TFA in H2O and eluted with 1 mL of 70% ACN in 0.1% TFA. The eluates were concentrated and finally reconstituted in 5% ACN in 0.1% FA.
Nano-LC/MS/MS
Nano-LC/MS/MS analysis was performed with Nano LC (Dionex Softron Gmbh, Germering, Germany) followed by the use of a triple quadrupole mass spectrometer (Thermo Fisher Scientific, Waltham, MA. USA). Peptides were loaded onto the trap column (C18 Acclaim PepMap 100, 5 μm particle size, 300 μm inner diameter × 5 mm length; Thermo Fisher Scientific, Amsterdam, Netherlands) at a flow rate of 15 μL/min for 5 mins. Then, the peptides were eluted on an analytical column (C18 Acclaim PepMap 100, 3 μm particle size, 75 μm inner diameter × 150 mm length; Thermo Fisher Scientific) at a flow rate of 300 nL/min for 60 mins. 2000 V spray voltage was applied. Two mobile phases consist of 0.1% formic acid in H2O (A) and 0.08% formic acid with 70% ACN in H2O (B) were settled. The gradient used was as follows (time, B%): 0 min, 4%; 3 min, 4%; 33 min, 55%; 34 min, 90%; 39 min, 90%; 40 min, 4%; and 60 min, 4%. Loading buffer consists of 2% acetonitrile and 0.05% trifluoroacetic acid in H2O were loaded at a flow rate of 15 μL/min. The tryptic peptides list of COL1A1, COL3A1, and COL5A1 was created by Pinpoint software ver. 1.1 (Thermo Fisher Scientific, San Jose, CA, USA). Several candidate peptides from commercially available types I, III, and V collagens digested with trypsin were selected by using the unscheduled MRM method (60 min, MS scans were acquired from m/z 175–1000) with nano-LC/MS/MS analysis. Then the retention time window for each candidate peptide was adjusted to ± 1 min to improve the peptide sensitivity, and endogenous peptides from the LX-2 cell culture medium and synthetic unlabeled peptides were analyzed in this fixed time window by nano-LC/MS/MS. Finally, transition lists of candidate peptides and stable isotope-labeled peptides were created by Pinpoint software (Table 1).
| Collagen | Chain | Peptide sequence | Precursor (Q1) | Product (Q3) | Fragment ion type | Collision energy (V) | ||
|---|---|---|---|---|---|---|---|---|
| m/z | charge state | m/z | charge state | |||||
| I | Collagen type I
α1 chain (COL1A1) |
GVQGPP*GPAGPR | 553 | 2 | 821 | 1 | y9 | 22 |
| 553 | 2 | 764 | 1 | y8 | 22 | |||
| 553 | 2 | 667 | 1 | y7 | 22 | |||
| 553 | 2 | 497 | 1 | y5 | 22 | |||
| 553 | 2 | 554 | 1 | y6 | 22 | |||
| 553 | 2 | 329 | 1 | y3 | 22 | |||
| GVQGPP*GPAGPR | 558 | 2 | 831 | 1 | y9 | 22 | ||
| 558 | 2 | 774 | 1 | y8 | 22 | |||
| 558 | 2 | 677 | 1 | y7 | 22 | |||
| 558 | 2 | 507 | 1 | y5 | 22 | |||
| 558 | 2 | 564 | 1 | y6 | 22 | |||
| 558 | 2 | 339 | 1 | y3 | 22 | |||
| III | Collagen type III
α1 chain (COL3A1) |
GLAGPP*GMP*GPR | 570 | 2 | 743 | 1 | y7 | 23 |
| 570 | 2 | 442 | 1 | y4 | 23 | |||
| 570 | 2 | 840 | 1 | y8 | 23 | |||
| 570 | 2 | 897 | 1 | y9 | 23 | |||
| 570 | 2 | 630 | 1 | y6 | 23 | |||
| 570 | 2 | 968 | 1 | y10 | 23 | |||
| GLAGPP*GMP*GPR | 575 | 2 | 753 | 1 | y7 | 23 | ||
| 575 | 2 | 452 | 1 | y4 | 23 | |||
| 575 | 2 | 850 | 1 | y8 | 23 | |||
| 575 | 2 | 907 | 1 | y9 | 23 | |||
| 575 | 2 | 640 | 1 | y6 | 23 | |||
| 575 | 2 | 978 | 1 | y10 | 23 | |||
| V | Collagen type V
α1 chain (COL5A1) |
GPP*GPAGPEGR | 504 | 2 | 853 | 1 | y9 | 20 |
| 504 | 2 | 683 | 1 | y7 | 20 | |||
| 504 | 2 | 515 | 1 | y5 | 20 | |||
| 504 | 2 | 740 | 1 | y8 | 20 | |||
| 504 | 2 | 232 | 1 | y2 | 20 | |||
| 504 | 2 | 458 | 1 | y4 | 20 | |||
| GPP*GPAGPEGR | 509 | 2 | 863 | 1 | y9 | 20 | ||
| 509 | 2 | 693 | 1 | y7 | 20 | |||
| 509 | 2 | 525 | 1 | y5 | 20 | |||
| 509 | 2 | 750 | 1 | y8 | 20 | |||
| 509 | 2 | 242 | 1 | y2 | 20 | |||
| 509 | 2 | 468 | 1 | y4 | 20 | |||
P* indicates hydroxyproline. The stable isotope-labeled amino acid is indicated by bold letter.
Quantification
Quantification was performed by calculating the transitions’ peak area ratio for unlabeled peptides to stable isotope-labeled peptides. Calibration curves were prepared on the basis of the strategy of spiking stable isotope-labeled peptides (20 fmol/μL) with unlabeled peptides at concentrations of 0, 1, 2, 4, 10, 20, and 40 fmol/μL. The lowest concentration of the unlabeled peptide measured with a coefficient of variation (CV) ≤ 15% was determined as the limit of quantitation (LOQ) for each calibration curve. Stable isotope-labeled peptides (final concentration, 10 fmol/μL) were spiked with the peptide digests from the LX-2 cell culture medium. Molecular weights of the mature form (triple-helical region) for each α chain of COL1A1, COL3A1, and COL5A1 was used to facilitate the conversion of their target peptide concentrations from fmol/μL units to ng/mL units. The additional molecular weight resulting from PTM was also taken into account for the calculation.
ELISA
For ELISA, the same cell culture medium of LX-2 cells used for the nano-LC/MS/MS analysis was utilized. The cell culture medium was collected three times at the same conditions. The cell culture medium was concentrated by approximately 20-fold with the Spin-X UF concentrator, and the resulting conditioned medium was analyzed with COL1A1, COL3A1, and COL5A1 ELISA kits according to the manufacturer’s protocol.
Statistical analysis
Data are expressed as means ± standard deviation (SD). The Mann-Whitney U-test was used to determine the difference between groups. P value less than 0.05 was considered significant for the statistical tests. Statistical analyses were conducted using Prism software ver. 6.01 (GraphPad, San Diego, CA, USA).
Selection of candidate peptides for quantification of types I, III, and V collagens
To search for candidate peptides for quantifying COL1A1, COL3A1, and COL5A1, Pinpoint software was used to create a tryptic peptides’ list, and it was applied for further peptide analysis. As mentioned in our previous report, candidate peptides should be unique to the amino acid sequence of the target protein, and the peptide intensity should be strong enough for the analysis and quantification of the target protein [29]. By the analyses using Pinpoint software, candidate peptides (9–12 amino acids in length) for each of the collagens were listed as shown in Table 1. In order to examine whether the selected candidate peptides are actually sensitive and specific peptides for substantial COL1A1, COL3A1, and COL5A1, commercially available types I, III, and V collagens purified from human placenta were digested with trypsin, and the peptides in the digests were analyzed by nano-LC/MS/MS. Consequently, the candidate peptides were substantially detected in the commercially available collagens and found to be sensitive and specific for each type of collagen. The peptide sequences and substantially obtained transitions of each of the collagens are shown (Table 1 and Figs. 1A, E, and I). Six transitions for each of the peptides are presented, and all of the product peptide ions are y-ions.

Transitions and retention times of three specific target peptides for COL1A1, COL3A1, and COL5A1 by using nano-LC/MS/MS. Transitions and retention times for the peptide GVQGPP*GPAGPR of COL1A1 (A, B, C, D), peptide GLAGPP*GMP*GPR of COL3A1 (E, F, G, H), and peptide GPP*GPAGPEGR of COL5A1 (I, J, K, L). (A, E, I) Peptides from commercially available collagens. (B, F, J) Peptides from the LX-2 cell culture medium. (C, G, K) Synthetic unlabeled peptides, (D, H. L) Synthetic stable isotope-labeled peptides. The transitions of Q1/Q3 for each type of collagen are shown on the right side of each figure. The horizontal and vertical lines indicate retention times and relative intensity, respectively. Representative figures are shown.
Validation and evaluation of endogenous peptides and synthesized peptides
Next, endogenous peptides of purpose in the LX-2 cell culture medium were analyzed by using nano-LC/MS/MS. All of the selected peptides shown in Table 1 could be detected in the LX-2 cell culture medium, and the transitions and retention times of those peptides in the culture medium (Figs. 1B, F, and J) were identical to those of commercially available collagens (Figs. 1A, E, and I). Subsequently, unlabeled and stable isotope-labeled peptides corresponding to the selected peptides shown in Table 1 were synthesized and analyzed by nano-LC/MS/MS. The transitions and retention times of the synthetic unlabeled (Figs. 1C, G, and K) and stable isotope-labeled (Figs. 1D, H, L) peptides were also identical to those of commercially available collagens (Figs. 1A, E, and I) and those from the LX-2 cell culture medium (Figs. 1B, F, and J). These results indicated that the selected target peptides from each of collagens can be used for quantifying their collagen α chains in the LX-2 cell culture medium.
Quantification
In order to quantify COL1A1, COL3A1, and COL5A1 by using their specific target peptides, calibration curves were generated with ranges of 0 to 1 fmol/µL and 0 to 20 fmol/µL. Serial diluted peptides were analyzed in triplicate with nano-LC/MS/MS and calibration curves were made with peak area ratios of the unlabeled peptide to stable isotope-labeled peptide on the y-axis and the corresponding concentration on the x-axis (Fig. 2). The limit of quantification (LOQ) for each type of collagen α chains was calculated and shown in Table 2. After that, concentrations for the collagen α chains in the digest of the LX-2 cell culture medium were calculated by fitting the peak area ratio of the unlabeled peptide to the stable isotope-labeled peptide into the calibration curve. Taking PTM into consideration for the calculation, concentrations of COL1A1, COL3A1, and COL5A1 secreted from LX-2 cells in a conditioned medium were shown in Table 3. Since the culture medium contains 0.5% FBS, similarity analysis for the sequences was performed for human and bovine peptides (Fig. 3). The peptide sequence GLAGPP*GMP*GPR in human COL3A1 was not identical to those in bovine COL3A1. However, the peptide sequences of human COL1A1 and COL5A1 were identical to the bovine peptide sequence. Hence, we quantified the concentrations of COL1A1 and COL5A1 in a cell-free medium as background levels using their peptides that are identical in humans and bovines. The concentrations determined with independent triplicate results are shown in Table 3. Since TGF-β1 is known to stimulate collagen production [30], it was added to the LX-2 cell culture medium as an exogenous inducer, and then quantitative analyses were conducted. As expected, the production of each of the collagens was significantly increased by the addition of TGF-β1 to the LX-2 cell culture medium (Table 3 and Figs. 4A, B, and C). Notably, the concentration of COL1A1 was much higher than the concentrations of others in either the absence or presence of TGF-β1 in the LX-2 cell culture medium (Fig. 4D). These results indicated that this method by using nano-LC/MS/MS is useful for simultaneous quantification of a variety of collagen α chains.

Calibration curves for quantitation of each peptide of COL1A1, COL3A1, and COL5A1. Unlabeled peptides with serial concentrations of 0, 1, 2, 4, 10, 20, and 40 fmol/µL were mixed with an equal volume of a stable isotope-labeled peptide (20 fmol/µL) for the quantification. The calibration curve in the insert shows the corresponding low concentration range. Samples were analyzed by nano-LC/MS/MS. The experiments were performed in triplicate. Data represent means ± SD (n = 3). The vertical line indicates peak area ratios of the unlabeled peptide to the stable isotope-labeled peptide, and the horizontal line indicates the concentrations of unlabeled peptides.
| Protein | Peptide Sequence | LOQ (ng/mL) | CV (%) |
|---|---|---|---|
| COL1A1 | GVQGPP*GPAGPR | 2 | 4.3 |
| COL3A1 | GLAGPP*GMP*GPR | 2 | 3.3 |
| COL5A1 | GPP*GPAGPEGR | 3.1 | 6.8 |
P* indicates hydroxyproline. The experiments were performed in triplicate. This table was prepared from the data shown in Figure 2.
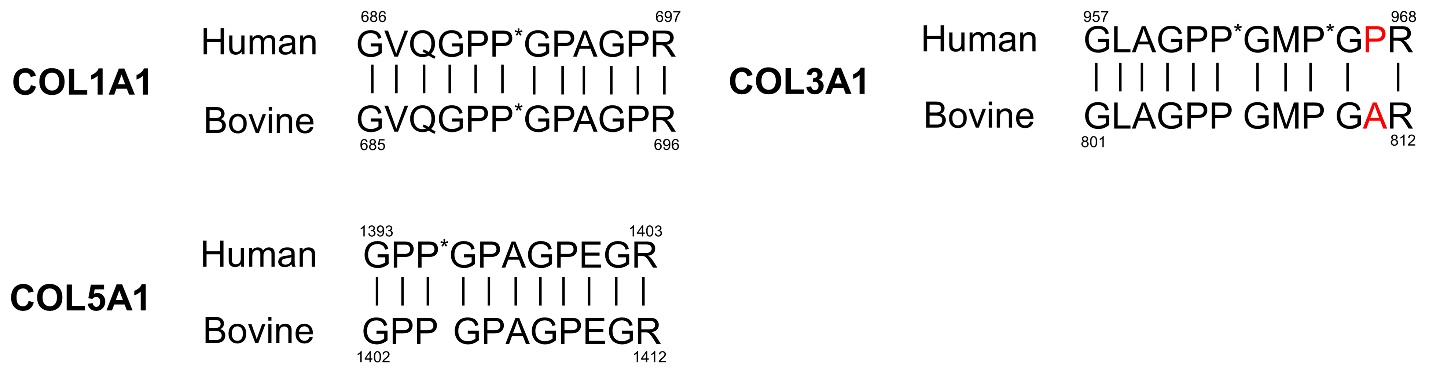
Sequence similarity analysis of collagen peptides. The amino acid sequences for the quantification of human types I, III, and V collagen α chains are compared with those of bovine amino acid sequences. P* indicates hydroxyproline. The different amino acid sequences between human and bovine are indicated in red letters. Amino acid numbers of the collagens are according to data from the UniProt database.
| Protein | Candidate peptide | Concentrations (ng/mL) | |||||
|---|---|---|---|---|---|---|---|
| Background | TGF-β1-untreated (n = 3) | TGF-β1-treated (n = 3) | |||||
| Mean ± SD | CV (%) | Mean ± SD | CV (%) | Mean ± SD | CV (%) | ||
| COL1A1 | GVQGPP*GPAGPR | 2.0 ± 0.2 | 9.6 | 93.4 ± 13.4 | 14.3 | 473.3 ± 49.2 | 10.4 |
| COL3A1 | GLAGPP*GMP*GPR | – | – | 14.8 ± 1.9 | 12.7 | 37.5 ± 5.5 | 14.6 |
| COL5A1 | GPP*GPAGPEGR | 0.1 ± 0.0 | 7.9 | 5.4 ± 0.7 | 13 | 8.3 ± 1.1 | 13.4 |
“–” Candidate peptide sequence of humans was not identical to that of the bovine peptide, and the background concentration was not examined. The experiments were performed in triplicate. The data represent means ± SD (n = 3).

Quantification of various collagen α chains in the LX-2 cell culture medium. This figure was prepared according to the data of Table 3. (A-C) LX-2 cells were cultured in the absence or presence of TGF-β1 (5 ng/mL) for 48 h, and the concentrations of COL1A1, COL3A1, and COL5A1 were measured by nano-LC/MS/MS. The experiments were performed in triplicate. The data represent means ± SD (n = 3). ****P < 0.0001. (D) The data in (A-C) are presented as a base 10 logarithmic scale.
Comparison with ELISA
In order to compare the sensitivity of the present method for the quantification of collagens in the LX-2 cell culture medium with that of the conventional ELISA method, the same culture medium was analyzed with the ELISA kits for COL1A1, COL3A1, and COL5A1. As shown in Fig. 5, the concentrations of COL1A1 were 200.6 ng/mL in the absence of TGF-β1 and 339.0 ng/mL in the presence of TGF-β1 with approximately the same values as those that were obtained by nano-LC/MS/MS (Table 3). However, the concentrations of COL3A1 and COL5A1 were not determined due to being below the limit of detection (data not shown). These results indicated that the newly developed method is superior to the conventional ELISA method in regard to the sensitivity of quantification of collagen α chains in a cell culture medium.

Quantification of COL1A1 in the LX-2 cell culture medium with ELISA. LX-2 cells were cultured in the absence or presence of TGF-β1 (5 ng/mL) for 48 h. The concentration of COL1A1 in the LX-2 cell culture medium was determined with the conventional ELISA method. The experiments were performed in triplicate. The data represent means ± SD (n = 3). ****P < 0.0001.
Collagen plays a key role in the human body and has been shown to be associated with many diseases [6‒10]. While substantial advances have been made in the identification of collagens from complex biological samples using proteomics tools, quantification of collagen using LC/MS/MS is still yet to be explored and refined.
Taga et al. [13] developed a method for quantification of type-specific collagens based on stable isotope labeling by amino acids in cell culture (SILAC). In their study, stable isotopically labeled heavy amino acids (lysine, arginine, and proline) were added to the cell culture medium to obtain stable isotope-labeled collagen (SI-collagen). The SI-collagen could be used to quantify collagen as an internal standard. However, a culture system with living cells, highly efficient labeling, and its purification were essential for this method [13, 31]. In addition, Goddard et al. [32] utilized stable isotope-labeled Quantitative conCATamer (QconCAT) peptides, first described by Beynon et al. [33], that were provided as internal standards for absolute quantification of ECM proteins including collagens to examine tissue microenvironments. However, in order to obtain target QconCAT peptides, construction and cloning of the target genes as well as production and purification of the target proteins in the media supplemented with stable isotope-labeled amino acids were needed [21].
We established a simultaneous quantification method for COL1A1, COL3A1, and COL5A1 in an LX-2 cell culture medium by using nano-LC/MS/MS. Collagens could be quantified by using their specific target peptides without antibodies. Furthermore, stable isotope-labeled peptides (purity ≥ 98%) were synthesized and they were added to the digests of collagen peptides as internal standards to overcome ion suppression, because the physicochemical properties of stable isotope-labeled peptides, such as co-elution, fragmentation, and ionization, were the same as those of unlabeled peptides except for molecular weight [34].
To isolate collagens, we used the LX-2 human hepatic stellate cell line. Immortalized LX-2 cells were established by Xu et al. [35], and they are suitable for studies of in vitro hepatic fibrosis [36]. Most importantly, activated hepatic stellate cells are the major cell types that are involved in liver fibrosis that leads to accumulation of collagens [37]. Therefore, we cultured LX-2 cells and attempted to extract the collagens from the conditioned medium. Optimization of cell culture conditions was established compared with our previous study [28]. Additionally, since FBS was added to the LX-2 cell culture medium to maintain the growth of cells, we measured the concentrations of COL1A1 and COL5A1 in a cell-free medium with 0.5% FBS. As a result, we found out that their concentrations were negligibly small. Furthermore, it is important for the quantification of peptides by using nano-LC/MS/MS to distinguish their proteoforms, which compose of different forms of a protein with PTM, such as hydroxyproline (HYP) modification. In collagens, proline is hydroxylated to HYP by PTM. HYP is one of the main components of collagen and a unique amino acid in collagen. Therefore, identifying the hydroxylation sites and distinguishing modified form and non-modified form in the candidate peptide sequences are very important for screening collagen-specific peptides. In this experiment, we actually searched the Uniprot database to identify these hydroxylated prolines and marked them with pinpoint software. We also took PTM into account when we calculated the final concentrations of COL1A1, COL3A1, and COL5A1 in the LX-2 cell culture medium, since PTM such as hydroxylation, glycosylation, and cross-linking, causes a change in the molecular weight of the corresponding polypeptide chain. Therefore, the reliability of measurements of the concentrations of collagens secreted in a conditioned medium would be improved by consideration of the concentrations of collagens in a cell-free medium and PTM of collagens.
To the best of our knowledge, there have so far been two reports on the concentrations of type I collagen and type III collagen in an LX-2 cell culture medium that were measured by using ELISA kits, and not by mass spectrometry analysis. Zhu et al. [38] showed that the concentrations of type I collagen and type III collagen were 56.2 ng/mL and 89.6 ng/mL, respectively, by using different ELISA kits from those used in this study. Similarly, Liu et al. [39] demonstrated the concentration of type I collagen in an LX-2 cell culture medium to be 26.3 ng/mL. The cell culture conditions in those studies were not described in detail, and the experimental designs in those studies were completely different from the experimental design in our study. These values of type I collagen are different from the results obtained in our study, namely, COL1A1, 200.6 ng/mL determined by ELISA analysis (Fig. 5); COL1A1, 93.4 ng/mL determined by nano-LC/MS/MS analysis (Table 3); and COL3A1, 14.8 ng/mL determined by nano-LC/MS/MS analysis (Table 3). These results indicated that the concentrations of collagens secreted into a cell culture medium fluctuate depending on the cell culture conditions, experimental design, measurement technique, and the kits used.
LC/MS/MS has been shown to have a powerful analytic value not only in a variety of tissues but also in body fluids [40‒42]. Human serum has always been an attractive diagnostic fluid because it has several advantages for disease diagnosis due to abundant protein content, low cost, and easy sample collection [43], and it is widely used for proteomics-based biomarker discovery. Therefore, serum types of collagens could become valuable source of potential biomarkers for collagen-related diseases [44, 45].
Here, we aimed to eventually develop a method for collagen quantification that can be applied to the biomaterials such as serum and tissue extracts. In the present study, we could select specific target peptides for the quantification of various collagens in the LX-2 cell culture medium, but it would be a challenge to find optimal peptides with easy fragmentation and ionization within short forms of serum collagens [46]. Currently, a pre-experiment is ongoing to develop a method for measuring collagens in serum using nano-LC/MS/MS.
Notably, for the diagnosis of vascular EDS (vEDS), a COL3A1 radioisotope-labeling method is used. Namely, cultures of dermal fibroblasts from patients with vEDS are established and labeled with radioactive proline, and labeled COL3A1 secreted into the culture medium is analyzed by electrophoresis followed by fluorography [47]. As just described, when a cell culture medium is used, the method presented here would provide a simpler procedure without using a radioisotope for the measurement of COL3A1. Thus, the newly developed method could be helpful for more direct clinical diagnosis of collagen-related diseases.
We established a novel simultaneous quantification method for various collagens in an LX-2 cell culture medium by using nano-LC/MS/MS, and this method was superior to the conventional ELISA method in regard to the sensitivity of quantification of collagens in the cell culture medium. Therefore, this method would enable monitoring and quantification of multiple collagens simultaneously and has excellent potential for quantification of collagens in other biomaterials. We believe that this method could be used for research of collagen-related diseases and would be valuable for diagnosis of EDS caused by mutations of genes of types I, III, and V collagens.
Author contribution
AG, KY, and KM: conceptualization and methodology. AG: data collection, formal analysis, and visualization. AG, KM: writing-original draft. KY: investigation and software. KM, KY, and HT.: writing-review and editing. All authors have read and agreed to the published version of the manuscript.
Funding
This work was funded by in part by Management Expenses Grants to Shimane University.
Conflict of interest
All authors have no conflicts of interest.