Abstract
Glomerular epithelial cells (GECs) are known to play a key role in maintaining the structure and function of the glomerulus. GEC injury induced by hyperglycemia is present in early-stage diabetic nephropathy (DN), which is the most common cause of renal failure. In an attempt to identify target proteins involved in the pathogenesis of GEC injury at early DN, we performed the proteomic analysis using primary cultures of GECs, prepared from the dissected rat glomeruli. The protein expression profiles in the two-dimensional electrophoresis gels were compared between GECs treated for three days with normal glucose (5 mM) and those with high glucose (30 mM) concentrations. These concentrations correspond to blood glucose concentrations under normoglycemia and hyperglycemia, respectively. Proteins with differential expression levels were identified using ESI-Q-TOF tandem mass spectrometry. The primary GECs cultured in hyperglycemic conditions showed cellular hypertrophy and increased production of reactive oxygen species, both of which reflect the GEC injury. Our proteomic analysis identified eight proteins with differential expression profiles, depending on glucose concentrations. Among them, we selected ATP synthase β subunit and enolase 2 that are related to energy metabolism and are down-regulated under hyperglycemia, and confirmed that hyperglycemia decreased the expression levels of ATP synthase β subunit and enolase 2 proteins by western blotting analysis. Hyperglycemia may impair mitochondrial function and alter glycolysis in GECs by down-regulating the expression of ATP synthase β subunit and enolase 2. The present study may provide a better understanding of the pathogenic mechanisms of GEC injury in early DN.
Introduction
Glomerular epithelial cells (GECs) form the glomerular epithelium that covers the outer surface of the glomerulus, and are essential for the maintenance of glomerular structure and filtration function. GECs consist of podocytes and parietal epithelial cells (PECs). Podocytes are located within the glomerular tuft, and function as size and charge barriers for protein filtration, and help conserve the glomerular capillary loop shape (Durvasula and Shankland 2006; Shankland 2006). In contrast, PECs comprise the extra-glomerular tuft and lie on the parietal basement membrane of the Bowman’s capsule. PECs form tight junctions and may function as the final permeability barrier to the urinary filtrate (Ohse et al. 2009). Both podocytes and PECs initially share a common phenotype, but they diverge and express their distinct genes during glomerulogenesis (Reeves et al. 1978; Smeets et al. 2006). Podocytes express Wilms’ tumor protein 1 (WT-1) and vimentin, whereas PECs do not (Stamenkovic et al. 1986; Bariety et al. 2006; Ohse et al. 2009). In addition, podocytes lose proliferation markers such as proliferating cell nuclear antigen (PCNA), but PECs continue to maintain the expression of PCNA (Nagata et al. 1993). Thus, these distinctive characteristics can be used to distinguish mature podocytes and PECs under normal conditions.
Diabetic nephropathy (DN) is the most common complication of diabetes and a major cause of end-stage renal disease. Early DN is characterized by glomerular hyperfiltration and microalbuminuria. These are effected by glomerular hypertrophy, glomerular basement membrane (GBM) thickening, and mesangial expansion with extracellular matrix accumulation (White 2006). Previous studies examining the molecular mechanisms of DN focused primarily on glomerular mesangium alterations, whereas podocyte injury was considered a late result due to increasing proteinuria (Mauer et al. 1984; Osterby et al. 1993). However, recent studies have shown that podocytes are structurally and functionally injured very early in DN (Coimbra et al. 2000; Gassler et al. 2001; Pavenstadt et al. 2003). Therefore, the podocyte could be a key player in development of early DN (Wolf et al. 2005a; Shankland 2006). In contrast, the effect of DN on PECs is not known, and furthermore, there is still no clear evidence supporting a primary form of PEC injury. If podocytes get injured and detached, PECs may migrate along the Bowman’s capsule and transition to the glomerular tuft of the injured area. However, whether these PECs are reparative or promote sclerosis remains unknown (Ohse et al. 2009; Fogo 2011).
Mechanisms that lead to podocyte injury and the progression of podocytopathy under diabetic conditions are still being studied. Hyperglycemia and proteins modified by high glucose levels, such as advanced glycated end products (AGEs), and reactive oxygen species (ROS) are crucial components in the development of DN. These components induce activation of various cytokine systems, such as angiotensin II, transforming growth factor-β, and vascular endothelial growth factor, which are also considered important factors for promotion of podocytopathy in the diabetic milieu (Sharma and Ziyadeh 1995; Schrijvers et al. 2004; Campbell et al. 2011; Tufro and Veron 2012). All of these elements cause pathological changes in podocytes, including hypertrophy, foot process effacement due to changes in the actin cytoskeleton, synthesis of abnormal GBM components, loss of anion charge, and reduction of nephrin expression in the slit diaphragm. These changes induce apoptosis of podocytes and detachment of podocytes from the GBM, which eventually lead to proteinuria and glomeruloscelosis (Wolf 2004; Shankland 2006; Wolf and Ziyadeh 2007; Mandache and Penescu 2012). Therefore, understanding podocyte pathology is crucial in elucidating the progression of DN and may help in developing new strategies to treat and prevent DN. However, the underlying mechanisms have not yet been fully identified.
Proteomics techniques have been widely used to identify protein expression in various organs, tissues, and cells, and also to examine differential protein expression in response to a variety of stimuli. Analysis of proteomes allows description of translational regulation and protein modification, which cannot be explained by genomic analysis of changes in gene expression at the mRNA level (Ransom et al. 2005). Proteomic investigations of DN have been applied recently and these studies have revealed new mechanisms of the pathology of DN (Kreidberg et al. 1996; Wolf and Ziyadeh 2007; So et al. 2008). In addition, potential blood and urinary markers of DN have also been investigated by proteomic analysis; in fact, our group proposed DN markers by serum proteome analysis (Cho et al. 2007; Kim et al. 2007). For instance, extracellular glutathione peroxidase (eGPx) and apolipoprotein E (ApoE) might be useful as diagnostic serum biomarkers of type 2 DN. Also, there have been several studies conducted to identify potential urinary markers of DN using proteomic analysis; this includes ubiquitin ribosomal fusion protein (UbA52) and several glycoproteins (α1B-Glycoprotein, zinc-α2-glycoprotein, and α2-HS-glycoprotein) (Meier et al. 2005; Dihazi et al. 2007; Rao et al. 2007).
In this study, we aimed to determine for comprehensive proteome changes in GECs under hyperglycemic conditions and to identify potential mechanisms associated with early DN using two-dimensional electrophoresis (2-DE). Therefore, we accomplished this by analyzing the effect of high glucose concentrations of rat GECs.
Materials and Methods
Isolation and culture of glomeruli
Male Sprague-Dawley rats aged between 8-10 weeks (Orient, Korea), and weighing 250-300 g were used in the study. All animal procedures were performed in accordance with guidelines outlined by the committee of animal ethics approved by the University of Korea. Rats were anesthetized with 40 mg of sodium thiopental 45 mg per kg of body weight. For removal of red blood cells, kidneys were perfused in situ via the aorta with phosphate buffered saline (PBS) (Sigma, USA). Kidneys were excised, and the cortices were dissected from each kidney. Cortical slices were cut into small pieces (1-1.5 mm cubes) with a surgical blade in PBS. Tissues were digested in collagenase solution containing 1 mg/ml collagenase V (Sigma) at 37°C for 15 min with gentle agitation. For removal of tubular debris, collagenase digested tissues were gently pressed with a spatula through a 100-μm pore size stainless steel sieve and passed through another 100 μm sieve without pressing. Glomeruli were collected on a sieve with 75 μm pores and washed three times in PBS. Glomeruli were cultured on type I collagen-coated culture dishes (BD bioscience, USA) in Dulbecco’s modified eagle medium (DMEM) (Gibco BRL, USA) containing 10% fetal bovine serum (FBS) (Gibco BRL) and 1% Penicillin-Streptomycin (Gibco BRL). Cultures were incubated in a 37°C humidified incubator with 5% CO2.
Subculture of glomerular epithelial outgrowths
Primary GECs were subcultured after 5 days of isolated glomeruli culture. Epithelial cells were detached using 0.05% Trypsin- 0.53 mM ethylenediaminetetra-acetic acid (EDTA) (Gibco BRL) for 4 min and passed through a sieve, which had a pore size of 32 μm for removal of the remaining glomerular cores. Filtered cells were cultured on type I collagen-coated 100 mm culture dishes. We could only expand primary GECs up to passage 3. For studying the proteome, GECs (104 cells/cm2) at second passage were seeded on a 100 mm culture dish and cultured until they reached 80% confluency.
Immunostaining of GECs
Primary GECs were fixed and blocked with blocking solution (5% bovine serum albumin (BSA) in PBS). For visualization of synaptopodin, blocked cells were labeled with anti-synaptopodin antibody (Progen Biotechnik, Germany) diluted 1:10 in 2% BSA in PBS for 1 hr and incubated with Alexa Fluor 488 conjugated antibody (Molecular probe, USA) diluted 1:1,000 in 2% PBS for 1 hr. All specimens were mounted in Prolong AntifadeTM mounting reagent (Biomeda Corp., USA). After overnight drying, specimens were analyzed using a Zeiss LSM 510 confocal laser-scanning microscope.
RT-PCR analysis of GECs
Tri Reagent (Invitrogen, USA) was used for isolation of RNA from GECs. The SuperScript First-Strand Synthesis System (Invitrogen) was used according to the manufacturer’s instructions for synthesis of cDNA. Primers were designed according to published sequences (Miettinen et al. 1999; Petermann et al. 2003; Nakatsue et al. 2005). Primer sequences used are podocin (sense primer: 5´-tctcccaaacctgttgaacc-3´ and antisense primer: 5´-gcgtgtgtccatcttgtgac-3´), podocalyxin (sense primer: 5´-ggtggcagtgaagagaatc-3´ and antisense primer: 5´-ctgtgagtcgttgttggtc-3´), synaptopodin (sense primer: 5´-gcagaggaagtgaggtccag-3´ and antisense primer: 5´-gatgccactagggtgctagg-3´), CD2 associated protein (CD2AP) (sense primer: 5’-gaggtagaagaaggctggtggagtg-3´, and antisense primer: 5´-cagcctgcttctccagtctcctt-3´), nephrin (sense primer: sense primer 5´-gttcagctgggagagactgg-3´ and antisense primer: 5´-aatcggacgacaagacgaac-3´), and WT-1 (sense primer: 5´-gtcctcccccgcccagccag-3´ and antisense primer: 5´-tgtagggcgtcccaggagc-3´). Taq DNA polymerase (Invitrogen) was used in all PCR reactions. PCR conditions were as follows: 35 cycles with 30 sec at 94°C, 30 sec at 55°C, 40 sec at 72°C, followed by 7 min at 72°C. PCR products were separated by electrophoresis in 1.5% agarose gel, and product bands were then detected with ethidium bromide. PCR for negative control was also performed with the same procedure described above, except for cDNA templates, to detect any contamination or non-specific amplification.
Experimental treatment conditions
At 80% confluence, GECs were exposed for 3 days to DMEM containing normal glucose (NG, 5 mM) or high glucose (HG, 30 mM) and 1% Penicillin-Streptomycin. Serum free culture medium was used from 1 day prior to NG and HG treatments through the remainder of the experiment to arrest and synchronize cell growth as well as to more clearly analyze the effects of HG on GECs (Ha et al. 2002; Liu et al. 2007; Qiu et al. 2012).
Detection of intracellular ROS
The peroxide-sensitive fluorescent probe 2´,7´-dichlorodihydrofluorescin diacetate (DCFH-DA, Molecular Probes) was used to measure intracellular ROS generation, as described previously (Gorin et al. 2001). GECs were grown in 96 well plates, which were serum-deprived for 24 hr and then exposed to each condition (HG, NG, NG with L-glucose (25 mM for osmotic control)) for 3 days. L-glucose is not metabolized by a cell, and thus it corrects for the difference in osmolality between HG and NG media.
Cellular hypertrophy measurement
Cellular hypertrophy was evaluated using two hypertrophy indexes. The first index was the change in cell size, and the second index was the total protein amount (μg) /cell number (105 cells) ratio (Masson et al. 2005). To evaluate the change in cell size, the average cell area under the microscope was measured and compared between HG- and NG-treated GECs after 3 days of HG treatment using Image J software, which is java-based public domain image processing program [National Institutes of Health (NIH), USA]. To evaluate the total protein amount (μg)/cell number (105 cells) ratio, GECs were washed twice in PBS and detached using 0.05% Trypsin-0.53 mM EDTA. Once cells were detached, DMEM with 10% FBS was added to each dish in order to neutralize the trypsin. After centrifugation and removal of media, cells were reconstituted with PBS. An aliquot of cells in each sample was counted using a hemocytometer to determine cell number. Another aliquot was lysed and used to determine the total amount of protein using the Bradford assay.
Protein preparation for 2-DE
For extraction of proteins, the remaining cells were lysed in 200 μl radioimmunoprecipitation assay (RIPA) buffer (Pierce, Rockford) for 10 min at 4°C. Samples were then centrifuged at 14,000 × g for 15 min to pellet the cellular debris; the supernatant was then transferred to new tubes for further analysis. Next, acetone precipitation of sample proteins was performed for removal of undesirable substances, such as salts and lipids. Four times the sample volume of cold (−20°C) acetone was added to the sample tubes, and the samples were vortexed and incubated for 60 min at −20°C. After centrifuging the samples at 13,000 × g for 10 min at 4°C; the supernatant was disposed and the pellet was reconstituted with sample buffer (7 M urea, 2 M thiourea, 4% 3-((3-cholamidopropyl)dimethylammonio)-1-propanesulfonate (CHAPS), 60 mM dithiothreitol (DTT), 1% immobilized pH gradient (IPG) buffer, pH 3-10 NL, and protein inhibitor cocktail). Protein concentration in each sample was determined by the Bradford assay.
2-DE analysis
2-DE analysis and protein identification were conducted following a previously described procedure (So et al. 2008). Isoelectric focusing (IEF) was performed using Immobiline DryStrips (24 cm, pH 3-10 NL, GE healthcare, USA) and fifty micrograms of the sample were loaded onto each strip. IEF conditions were as follows: 5 hr rehydration without current, 200 V for 30 min, 500 V for 1 min, 500-8,000 V for 1 hr, then a constant voltage of 8,000 V for a total of 146,000 Vhr (IPG phor system (GE healthcare)). Strips were applied on the 12% sodium dodecyl sulfate polyacrylamide gel electrophoresis (SDS-PAGE) gels (26 × 20 cm). SDS-PAGE was performed at 55 V for 1 hr, 160 V for 1 hr and 330 V for 6 hr using the Ettan DALT II system (GE healthcare). Proteins were detected using the silver staining method (So et al. 2008). Spot detection and matching between gels were automatically analyzed using Image Master 2D Platinum 6.0 Software (GE healthcare) for identification of proteins with statistically differential expression (using student’s t-test analysis (p < 0.05)) between NG- and HG-treated GECs.
In-gel digestion
Protein spots that differed significantly between NG and HG gels were excised and subjected to in-gel trypsin digestion (Shevchenko et al. 1996). Excised gel spots were destained with 100 μl of destaining solution (30 mM potassium ferricyanide and 100 mM sodium thiosulfate) with shaking for 5 min. After removal of the destaining solution, gel spots were incubated with 200 mM ammonium bicarbonate for 20 min. The gel pieces were dehydrated with 100 µl of acetonitrile and dried in a vacuum centrifuge. The dried gel pieces were rehydrated with 20 µl of 50 mM ammonium bicarbonate containing 0.2 µg of modified trypsin (Promega) for 45 min on ice. After removing this solution, 30 µl of 50 mM ammonium bicarbonate was added. The digestion was performed overnight at 37°C. The peptide solution was desalted using custom-made C18 nano column.
Desalting and concentration of digested peptides
Custom-made chromatographic columns were used for desalting and concentrating the the peptide mixture prior to mass spectrometric analysis. A column consisting of 100-300 nl of poros reverse phase R2 material (20-30 μm of bead size, PerSeptive Biosystems) was packed in a constricted GELoader tip (Eppendorf, Hamburg, Germany). A 10 ml syringe was used to force liquid through the column by applying a gentle air pressure. 30 μl of the peptide mixture from the digestion supernatant was diluted in 30 μl of 5% formic acid, loaded onto the column, and washed with 30 μl of 5% formic acid. For MS/MS analysis, peptides were eluted with a premixed solution of 1.5 μl of methanol (50%), H2O (49%), and formic acid (1%) directly into a precoated borosilicate nanoelectrospray needle (EconoTipTM, New Objective, USA).
Electrospray ionization quadruple time-of-flight tandem mass spectrometry (ESI-Q-TOF MS/MS)
MS/MS analysis of peptides generated by in-gel digestion was performed by nano-ESI on a Q-TOF mass spectrometer (Micromass, UK). The source temperature was 80°C. A potential of 1 kV was applied to the precoated borosilicate nanoelectrospray needles (EconoTipTM) in the ion source combined with a nitrogen back-pressure of 0-5 pounds per square inch to produce a stable flow rate (10-30 nl/min). The cone voltage was 40 V. The quadrupole analyzer was used to select precursor ions for fragmentation in the hexapole collision cell. The collision gas was argon at a pressure of 6-7 × 10⁻⁵ millibar and the collision energy was 20-30 V. Product ions were analyzed using an orthogonal TOF analyzer, fitted with a reflector, a micro-channel plate detector and a time-to-digital converter (Micromass). The data were processed using a Mass Lynx Windows NT PC system (Micromass).
Protein identification and sequence processing
After obtaining MS/MS spectra data, protein sequences were searched from NCBI databases using the MASCOT search program (www.matrixscience.com) (So et al. 2008). The search parameters were as follows; MS/MS Ion Search for search type, trypsin in enzyme, carbamidomethyl (c) in fixed modifications, oxidation (M) in variable modifications, monoisotoic mass values, ± 1 Da for peptide mass tolerance, ± 0.8 Da for fragment mass tolerance, and 1 for maximum missed cleavage. In MASCOT, the ions for an MS/MS match were based on the calculated probability, P, that the observed match between the experimental data and the database sequence was a random event. The reported score was −10 Log (P). The highest score hits among MASCOT search results were selected. Finally, protein scores were derived from ions scores as a non-probabilistic basis for ranking protein hits.
Western blotting analysis
For Western blotting (WB) analysis, GEC lysates were subjected to SDS-PAGE; the gels were then transferred to polyvinylidene fluoride (PVDF) membranes. Membranes were incubated with blocking solution containing vimentin (1:5,000 dilution; Abcam, UK), ATP synthase β subunit (1:5,000 dilution; Abcam), enolase 2 (1:2,000 dilution, Abcam), and α-tubulin (1:5,000 dilution; epitomics) antibodies. Vimentin is a mature podocyte marker, and its antibody was used for GEC characterization. ATP synthase β subunit and enolase 2 are related with energy metabolism, and they were selected to confirm differential expression in HG-treated GECs. α-tubulin was used as an internal control. After primary antibody incubation, membranes were incubated with blocking solution containing horseradish peroxidase (HRP)-conjugated secondary antibodies. The signal was detected by the chemiluminescence of the HRP-catalyzed substrate reaction using enhanced chemiluminescence (ECL) kit (Pierece, USA).
Results
Culture of GECs
For the primary culture of GECs, decapsulted glomeruli were isolated from the kidney cortex using a 100-μm pore size sieve (Fig. 1A and B) (Katsuya et al. 2006). The cortical kidney pieces were digested with collagenase in order to loosen cortical tissues and the glomerular structure, thereby promoting cellular outgrowth (Hruby and Lowry 1989). Three days after isolation, the glomeruli were attached to a collagen coated cell culture dish, after which polygonal GECs started to grow (Fig. 1C). Five days after glomeruli isolation, GECs were subcultured. GECs did not proliferate after passage 3.
Characterization of GECs
In this study, GECs were characterized by WB analysis and immunostaining using a podocyte specific antigen. Vimentin is a mature podocyte marker and its expression in GECs was confirmed using WB analysis (Bariety et al. 2003). Vimentin was highly expressed in GECs (Fig. 2A). We also used synaptopodin, which is considered a fully differentiated podocyte marker, and has been widely used to confirm not only immortalized podocytes but also primary cultured podocytes (Ransom et al. 2005; Vaughan et al. 2005). As shown in Fig. 2B, GECs stained positively for synaptopodin.
RT-PCR analysis was also performed to examine mRNA expression of podocyte-specific markers such as podocin, podocalyxin, synaptopodin, CD2AP, nephrin, and WT-1 in GECs (Fig. 2C). This showed that the cultured GECs expressed mRNA for all these markers except for nephrin. This may be because in primary cultures, nephrin is expressed only at early passages and in low abundance (Takano et al. 2007). In addition, nephrin, WT-1, and podocalyxin mRNA expression in immortalized podocyte cell lines vary in different clones (Sakairi et al. 2010). Negative control did not generate any product (data not shown).
Intracellular ROS detection and GEC hypertrophy measurement
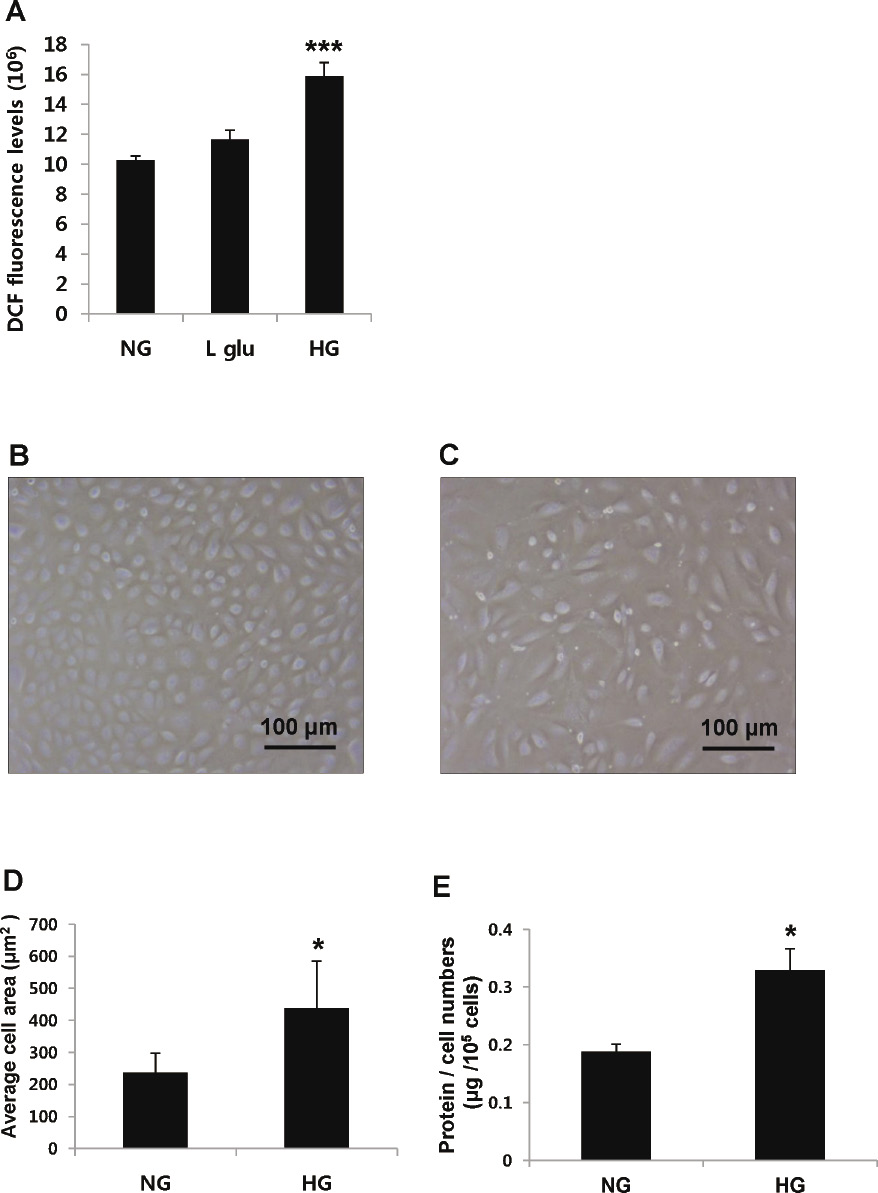
To measure oxidative stress in GECs under hyperglycemic conditions, we detected intracellular ROS using the DCFH-DA probe. HG-treated GECs showed 55% higher DCF fluorescence levels than the NG-treated group. There was no significant difference in DCF fluorescence levels between NG-treated GECs and GECs treated with both NG and L-glucose, indicating that osmolality did not affect ROS increase in HG-treated GECs (Fig. 3A).
In addition, we observed the effect of HG on GEC hypertrophy. According to cell area analysis in Image J, there was an 82% increase of the average cell area in the HG-treated GECs compared to the NG-treated GECs (Fig. 3B-D). Also, the protein/cell numbers (μg/105 cells) in the HG-treated GECs was 25% higher than that of the NG-treated GECs (Fig. 3E). Significant differences were assessed using a Student’s t-test (***p < 0.001 vs. NG; *p < 0.05 vs. NG).
Comparative proteomic analysis of high glucose treated GECs
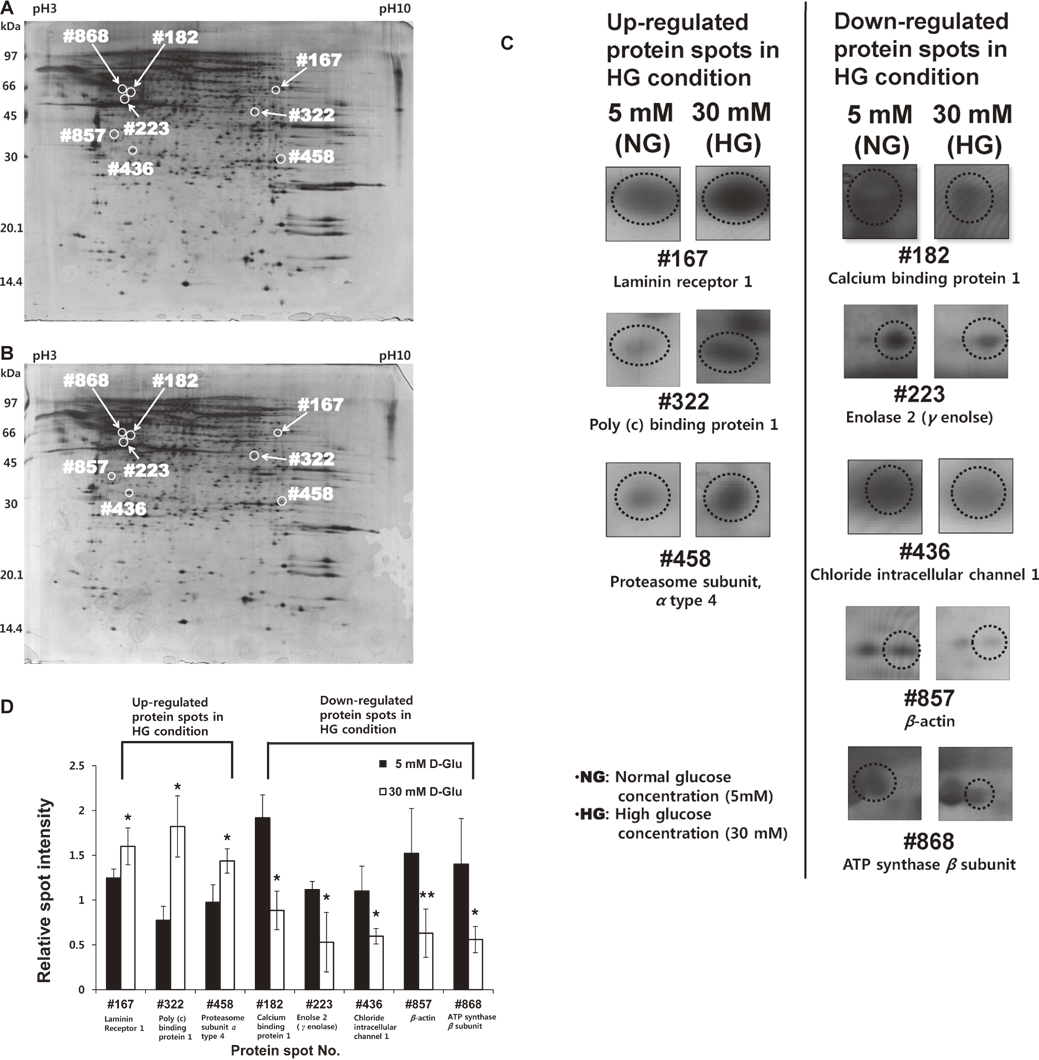
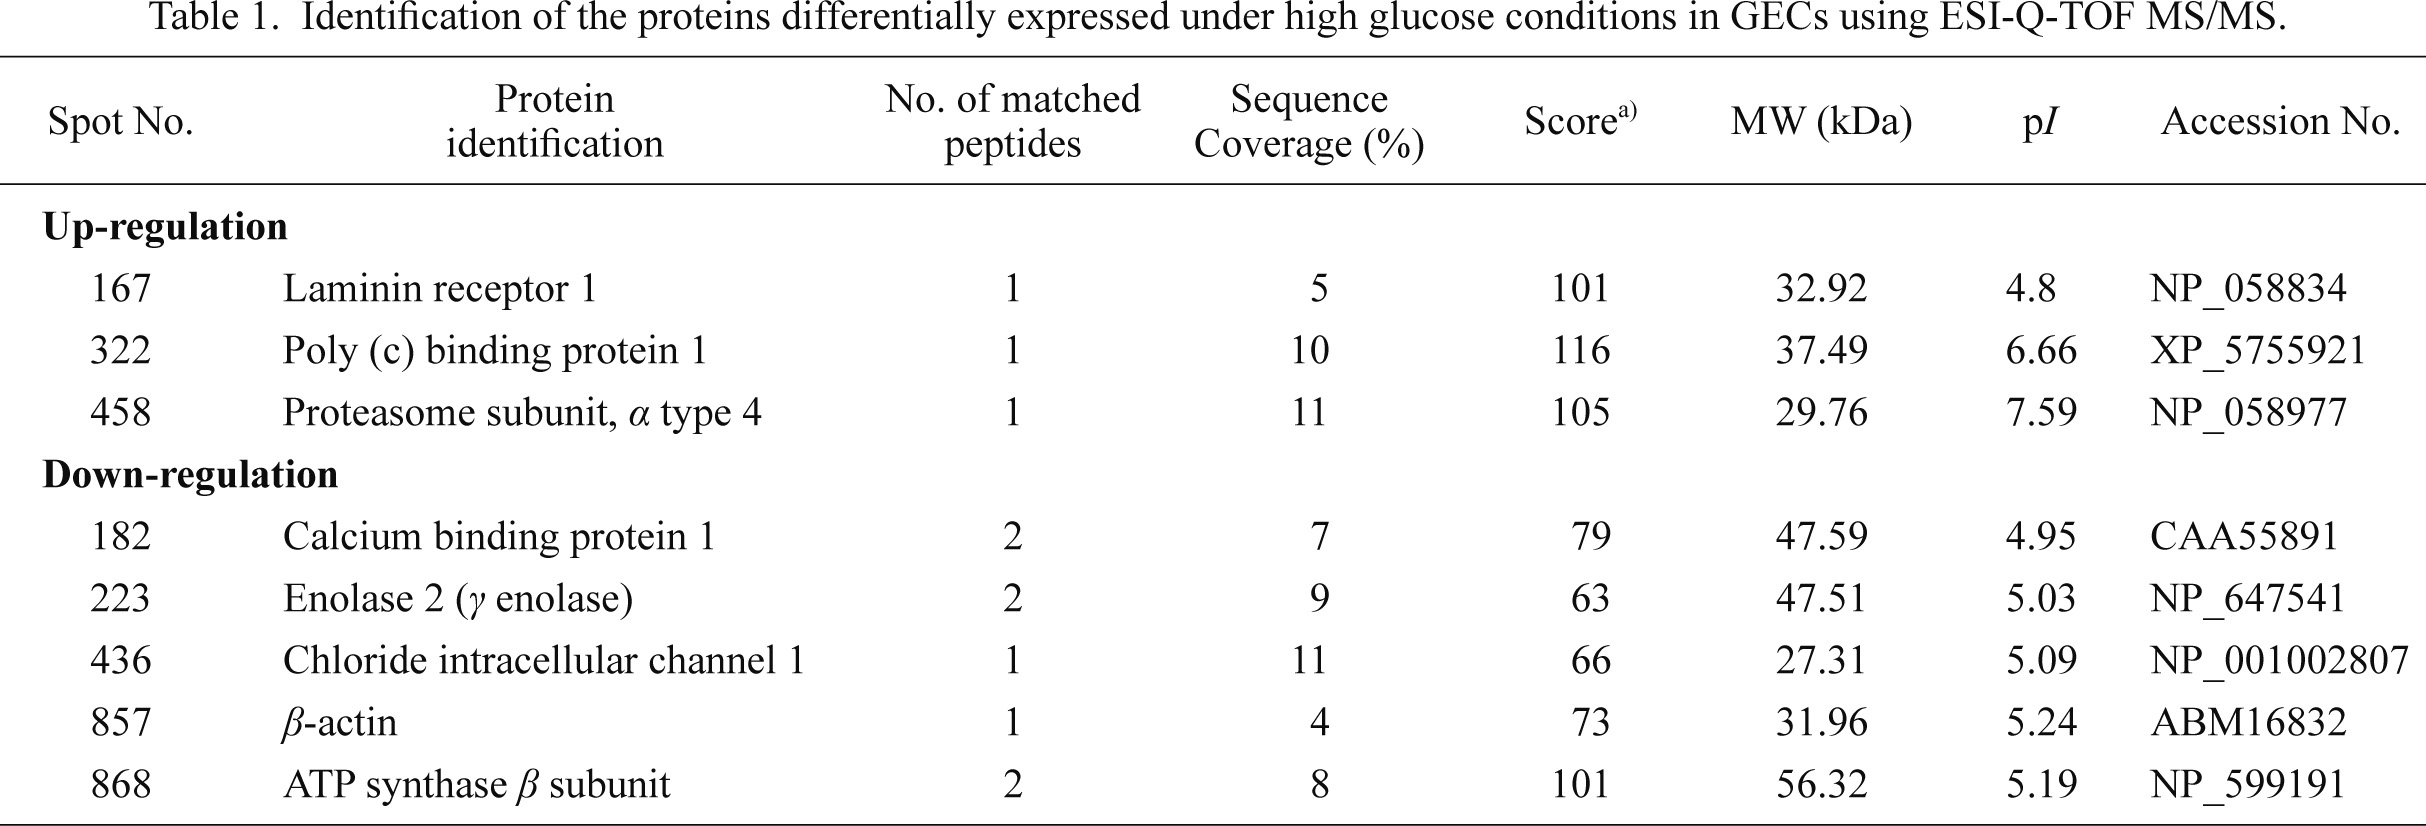
Proteomes of NG-treated and HG-treated GECs were analyzed by 2-DE image analysis. After protein electrophoresis from both NG-treated and HG-treated GECs, protein spots on the gels were stained by the silver staining method. Spot detection and matching between gels were analyzed using Image Master 2D Platinum 6.0 Software to identify proteins with statistically differential expression between NG-treated and HG-treated GECs. Twelve differentially expressed proteins were identified between the two groups by image analysis of gel spots. Among these proteins, eight spots represented statistically significant (*p < 0.05) differences in expression as assessed by a Student’s t-test (Fig. 4A and B). The signal intensities of three spots (spot number: #167, #322, and #458) were increased in HG-treated GECs, while those of five spots (spot number: #182, #223, #436, #857, and #868) were decreased in HG-treated GECs. Proteins present at these eight spots were identified with an ESI-Q-TOF MS/MS analyzer (Table 1). The up-regulated proteins under high glucose conditions were identified as laminin receptor 1 (#167), poly (c) binding protein 1 (PCBP1) (#322), and proteasome subunit α type 4 (#458). The down-regulated proteins were determined to be calcium binding protein 1 (#182), enolase 2 (#223), chloride intracellular channel 1 (#436), β-actin (#857), and ATP synthase β subunit (#868). The magnification images of these eight differentially expressed spots between NG- and HG-treated groups (three up regulated and five down regulated in HG-treated GECs) are provided in Fig. 4C. Also, the calculated relative volume intensities of these eight spots between NG- and HG-treated groups are shown in Fig. 4D, which demonstrates significant volume intensity differences between two groups.
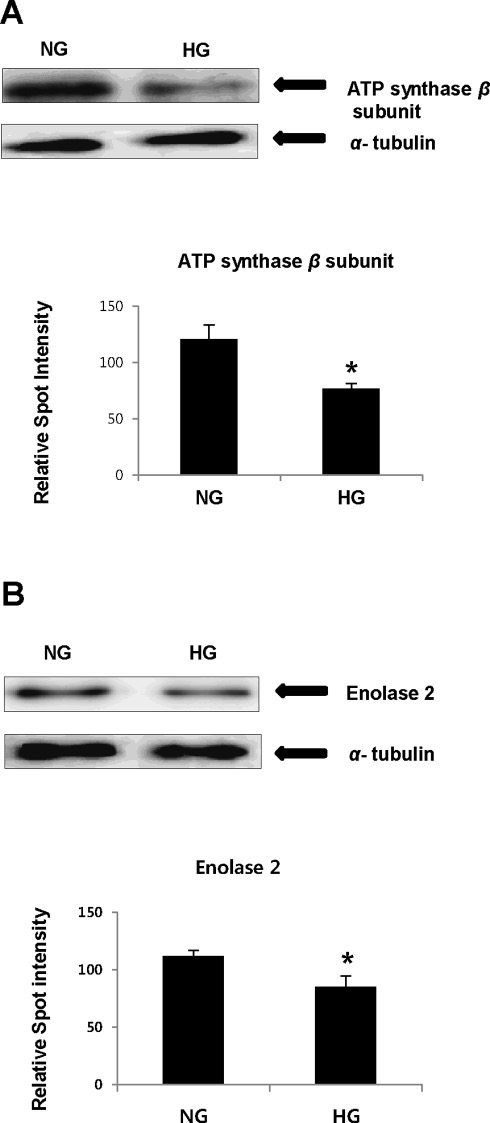
To confirm changes in protein expressions observed by 2-DE analysis after high glucose treatment and to verify protein identity determined from ESI-Q-TOF MS/MS, the expression levels of ATP synthase β subunit and enolase 2 were confirmed by WB analysis. The expression of ATP synthase β subunit and enolase 2 decreased significantly by 37% and 24%, respectively, under high glucose conditions compared with normal glucose conditions (Fig. 5A and B), confirming the results obtained by 2-DE analysis and ESI-Q-TOF MS/MS. Significant differences were assessed using a Student’s t-test (*p < 0.05 vs. NG).
Discussion
The aim of this study is to analyze the effect of hyperglycemia on differential protein expression in primary cultured GECs. We believe that our primary cultured GECs presented better characteristics of podocytes for the following reasons. First, we outgrew GECs from the glomeruli devoid of Bowman’s capsule which contains PECs. Second, our GECs highly expressed vimentin, a mature podocyte marker, and synaptopodin, which is also considered a podocyte specific marker (Bariety et al. 2003; Ransom et al. 2005; Vaughan et al. 2005). Third, our GECs showed the low proliferative capacity which is characteristic of podocytes called fully differentiated GECs. Our GECs did not proliferate after passage 3, whereas PECs are known as life-long proliferative cells and primary cultured PECs proliferate at least up to passage 6 (Appel et al. 2009; Kabgani et al. 2012). However, our GECs had a polygonal morphology, which is different from the arborized shape considered to be the morphology of primary cultured podocytes; thus our GECs may still need additional morphological characterization (Katsuya et al. 2006). In spite of this morphological issue, we consider our GECs as podocyte based on the above characteristics and we focused on the features of podocytes in this study. Compared with immortalized podocytes, culturing primary GECs is difficult; therefore only a limited number of studies have examined primary cultured GECs. In spite of this, it is important to study primary cultured GECs in order to fully understand the physiology and pathology of GECs (Krtil et al. 2007).
Several analyses of the renal proteome with regard to DN have been conducted, including studies of the renal cortex (Tilton et al. 2007), renal proximal tubular epithelial cells (So et al. 2008), and urinary proteins (Rao et al. 2007). Furthermore, one current study showed differential proteomic changes in an immortalized mouse podocyte cell line after long term exposure (two weeks) to HG (Schordan et al. 2009). However, our study of primary cultured rat GECs exposed to HG for three days demonstrated different patterns of proteome changes compared with the above cited study. This result may be explained by differing HG exposure times and sources of GECs.
Prior to analysis of differential proteome changes of GECs under hyperglycemic conditions, we observed an increase in ROS levels in HG-treated GECs. These excess ROS are believed to be key factors in the development of diabetes and its complications. ROS induce macromolecular damage directly and act as signaling mediators for the activation of cellular stress pathways, which lead to cellular injury and contribute to the pathogenesis of DN (Kim et al. 1998; Ha et al. 2008; So et al. 2008). Therefore, this result indicates that high glucose concentrations provide a stressful environment to GECs, as has been reported in previous studies (Leehey et al. 2005; Susztak et al. 2006). In addition, cellular hypertrophy was also detected in GECs cultured in HG conditions. In diabetes, hypertrophy is an initial structural change in the kidney, and renal hypertrophy could be one of the early symptoms of DN (Senthil et al. 2003). The mechanism of GEC hypertrophy in DN has been investigated in several recent studies (Hoshi et al. 2002; Kasinath et al. 2006). Importantly, AMPK has been shown to be an important factor in control of diabetes-stimulated renal hypertrophy and HG stimulated GEC hypertrophy. Under normal conditions, AMPK acts as an inhibitor of protein synthesis; however, high glucose decreases AMPK activity, which is mediated by PI3-K-Akt-mTOR signaling under diabetic conditions (Kasinath et al. 2006). In addition, p27kip1, a cyclin dependent kinase (CDK) inhibitor, is known to be a critical factor for in the development of renal hypertrophy in diabetes. High glucose stimulates the expression of p27kip1, which binds and inhibits G1-phase CDK 2,4-cyclin E complexes, and this may result in cell cycle arrest and therefore induce GEC hypertrophy of GECs (Wolf et al. 2001; Hoshi et al. 2002; Wolf et al. 2005b). However, in our study, we could not observe a change in expression of p27kip1 in high glucose stimulated GECs using 2-DE analysis. This may have been because the resolution of the p27kip1 spot on the 2-DE gel was too low, or the gel electrophoretic mobility shift by phosphorylated p27kip1 might have impaired the accurate detection of p27kip1 expression change on the 2-DE gel. Therefore, to further investigate p27kip1 expression change in HG-treated GECs, we may need to use a more confined pH range gel to increase the resolution of the expected p27kip1 spot on the gel. Further WB analysis for phosphorylated and unphosphorylated p27kip1 may also be needed.
In this study, we identified eight differentially expressed proteins by 2-DE analysis and ESI-Q-TOF MS/MS. Among them, poly (c) binding protein 1 (PCBP1), laminin receptor 1, and proteasome subunit alpha type 4 were up-regulated, whereas ATP synthase β subunit, enolase 2, calcium binding protein 1 (CaBP1), chloride intracellular channel 1, and β-actin were down-regulated in GECs when exposed to high glucose concentration.
Above all, ATP synthase, the β subunit of an H+ transporting mitochondrial F1 complex, was down-regulated in GECs cultured with HG, as analyzed by 2-DE and WB analysis. ATP synthase β subunit is a catalytic site for the ATP synthase reaction, which catalyzes formation of ATP from ADP and Pi, and its amino acid sequence has been highly conserved from E. coli to humans (Pedersen and Amzel 1993). One study showed the expression of ATP synthase β subunit was decreased in pancreatic islets from streptozotocin-induced diabetic mice; this study argued that the down-regulation of ATP synthase β subunit reflected mitochondrial dysfunction, which was related to the pathophysiological features of diabetes and its complications (Xie et al. 2008). In another study, the levels of ATP synthase β subunit phosphoisoforms were down regulated in the skeletal muscle of patients with type 2 diabetes mellitus which caused decreased catalytic activity of ATP synthase. It has also been suggested that changes in ATP synthase β subunit expression may be a consequence of hyperglycemia or loss of insulin signaling effects (Hojlund et al. 2003). Therefore, decreased expression of ATP synthase β subunit in HG-stimulated GECs might also mean that the high glucose leads to the dysfunction of mitochondria in GECs, which could strongly influence GEC metabolism under hyperglycemic conditions.
In addition to ATP synthase β subunit, 2-DE and WB analysis showed that enolase 2 (γ-enolase) was down-regulated in HG-treated GECs. Enolase 2, which is also known as neuron-specific enolase, is generally found in mature neurons and in cells of neuronal origin. Although enolase 2 is primarily used as a neuronal differentiation marker, it is also found in many tissues of nonneuronal origin (Haimoto et al. 1985; Oliva et al. 1991). Enolases catalyze the interconversion of 2-phosphoglycerate to phosphoenolpyruvate in the glycolytic pathway and play an important role in regulation of glycolysis (Pancholi 2001). However, the relationship between enolase 2 and DN is still unclear. Enolase 2 was shown to be down-regulated in the retinal pigment epithelium proteome from early diabetic patients by 2-DE analysis (Merchant and Klein 2009). In addition, expression of enolase 1 was decreased in human skin fibroblasts from patients with DN (Iori et al. 2008). It has been shown that overproduction of ROS due to hyperglycemia reduced the activity of the glycolytic enzyme glyceraldehyde-3-phosphate dehydrogenase, which resulted in the upstream accumulation of glycolytic intermediates, leading to a significant increase in diabetic components such as advanced glycation end-product (AGE) and protein kinase C activation (Du et al. 2000; Brownlee 2001; Hammes 2003). These accumulated glycolytic intermediates might also reduce downstream intermediates and glycolytic enzymes, including enolases.
Among the identified proteins, PCBP1 was up-regulated in high glucose-exposed GECs. PCBP1 is a member of the hnRNP family, which has three KH domains, and is widely expressed in many tissues. PCBP1 plays various roles in regulation of metabolism, function, and processing of mRNA by formation of a protein-RNA complex (Kiledjian et al. 1995; Huo and Zhong 2008). In one study, SH-SY5Y cells that overexpressed exogenous PCBP1 showed a global change in transcription and translation. Among these transcripts, up-regulated IL 1A (MIM: 147760), CYR61 (MIM: 602369) and down-regulated MYOG (MIM: 159980) were related to the hypertrophy model pathway (Huo and Zhong 2008). Hence, PCBP1 is expected to play significant roles in metabolic regulation of GECs; however, the exact function of PCBP1 in high glucose exposed GECs is unknown and further study will be required to better understand this effect.
In summary, we used 2-DE technique to conduct a differential proteomic analysis on primary cultured GECs exposed to HG. Among differentially expressed proteins, ATP synthase β subunit, enolase 2, and PCBP1 are related to energy metabolism, and thus these proteins can be helpful in examining glucose metabolism in GECs under diabetic conditions. Furthermore, this information helps to provide a better understanding of the pathogenic mechanisms of GECs in early DN. Observation of periodic expression patterns is needed to obtain an accurate grasp of the pathological changes occurring in GECs under hyperglycemic conditions. Moreover, in vivo confirmation of the expression patterns of the target proteins is also required in order to provide important clues for the study of early DN.
Acknowledgements
We thank Ajay Tambralli and Dr. Joo-Hyung Lee (School of Medicine, University of Alabama at Birmingham, Alabama, USA) for the advice of editing the manuscript.
Conflict of Interest
The authors have no conflict of interest to declare.
References
-
Appel,
D.,
Kershaw,
D.B.,
Smeets,
B.,
Yuan,
G.,
Fuss,
A.,
Frye,
B.,
Elger,
M.,
Kriz,
W.,
Floege,
J. &
Moeller,
M.J.
(2009) Recruitment of podocytes from glomerular parietal epithelial cells. J. Am. Soc. Nephrol., 20, 333-343.
-
Bariety,
J.,
Bruneval,
P.,
Hill,
G.S.,
Mandet,
C.,
Jacquot,
C. &
Meyrier,
A.
(2003) Transdifferentiation of epithelial glomerular cells. J. Am. Soc. Nephrol., 14 Suppl 1, S42-47.
-
Bariety,
J.,
Mandet,
C.,
Hill,
G.S. &
Bruneval,
P.
(2006) Parietal podocytes in normal human glomeruli. J. Am. Soc. Nephrol., 17, 2770-2780.
-
Brownlee,
M.
(2001) Biochemistry and molecular cell biology of diabetic complications. Nature, 414, 813-820.
-
Campbell,
K.N.,
Raij,
L. &
Mundel,
P.
(2011) Role of angiotensin II in the development of nephropathy and podocytopathy of diabetes. Curr. Diabetes Rev., 7, 3-7.
-
Cho,
E.H.,
Kim,
M.R.,
Kim,
H.J.,
Lee,
D.Y.,
Kim,
P.K.,
Choi,
K.M.,
Ryu,
O.H. &
Kim,
C.W.
(2007) The discovery of biomarkers for type 2 diabetic nephropathy by serum proteome analysis. Proteomics Clin. Appl., 1, 352-361.
-
Coimbra,
T.M.,
Janssen,
U.,
Grone,
H.J.,
Ostendorf,
T.,
Kunter,
U.,
Schmidt,
H.,
Brabant,
G. &
Floege,
J.
(2000) Early events leading to renal injury in obese Zucker (fatty) rats with type II diabetes. Kidney Int., 57, 167-182.
-
Dihazi,
H.,
Muller,
G.A.,
Lindner,
S.,
Meyer,
M.,
Asif,
A.R.,
Oellerich,
M. &
Strutz,
F.
(2007) Characterization of diabetic nephropathy by urinary proteomic analysis: identification of a processed ubiquitin form as a differentially excreted protein in diabetic nephropathy patients. Clin. Chem., 53, 1636-1645.
-
Du,
X.L.,
Edelstein,
D.,
Rossetti,
L.,
Fantus,
I.G.,
Goldberg,
H.,
Ziyadeh,
F.,
Wu,
J. &
Brownlee,
M.
(2000) Hyperglycemia-induced mitochondrial superoxide overproduction activates the hexosamine pathway and induces plasminogen activator inhibitor-1 expression by increasing Sp1 glycosylation. Proc. Natl. Acad. Sci. USA, 97, 12222-12226.
-
Durvasula,
R.V. &
Shankland,
S.J.
(2006) Podocyte injury and targeting therapy: an update. Curr. Opin. Nephrol. Hypertens., 15, 1-7.
-
Fogo,
A.B.
(2011) The targeted podocyte. J. Clin. Invest., 121, 2142-2145.
-
Gassler,
N.,
Elger,
M.,
Kranzlin,
B.,
Kriz,
W.,
Gretz,
N.,
Hahnel,
B.,
Hosser,
H. &
Hartmann,
I.
(2001) Podocyte injury underlies the progression of focal segmental glomerulosclerosis in the fa/fa Zucker rat. Kidney Int., 60, 106-116.
-
Gorin,
Y.,
Kim,
N.H.,
Feliers,
D.,
Bhandari,
B.,
Choudhury,
G.G. &
Abboud,
H.E.
(2001) Angiotensin II activates Akt/protein kinase B by an arachidonic acid/redox-dependent pathway and independent of phosphoinositide 3-kinase. FASEB J., 15, 1909-1920.
-
Ha,
H.,
Hwang,
I.A.,
Park,
J.H. &
Lee,
H.B.
(2008) Role of reactive oxygen species in the pathogenesis of diabetic nephropathy. Diabetes Res. Clin. Pract., 82 Suppl 1, S42-45.
-
Ha,
H.,
Yu,
M.R.,
Choi,
Y.J.,
Kitamura,
M. &
Lee,
H.B.
(2002) Role of high glucose-induced nuclear factor-kappaB activation in monocyte chemoattractant protein-1 expression by mesangial cells. J. Am. Soc. Nephrol., 13, 894-902.
-
Haimoto,
H.,
Takahashi,
Y.,
Koshikawa,
T.,
Nagura,
H. &
Kato,
K.
(1985) Immunohistochemical localization of gamma-enolase in normal human tissues other than nervous and neuroendocrine tissues. Lab. Invest., 52, 257-263.
-
Hammes,
H.P.
(2003) Pathophysiological mechanisms of diabetic angiopathy. J. Diabetes Complications, 17, 16-19.
-
Hojlund,
K.,
Wrzesinski,
K.,
Larsen,
P.M.,
Fey,
S.J.,
Roepstorff,
P.,
Handberg,
A.,
Dela,
F.,
Vinten,
J.,
McCormack,
J.G.,
Reynet,
C. &
Beck-Nielsen,
H.
(2003) Proteome analysis reveals phosphorylation of ATP synthase beta-subunit in human skeletal muscle and proteins with potential roles in type 2 diabetes. J. Biol. Chem., 278, 10436-10442.
-
Hoshi,
S.,
Shu,
Y.,
Yoshida,
F.,
Inagaki,
T.,
Sonoda,
J.,
Watanabe,
T.,
Nomoto,
K. &
Nagata,
M.
(2002) Podocyte injury promotes progressive nephropathy in zucker diabetic fatty rats. Lab. Invest., 82, 25-35.
-
Hruby,
Z. &
Lowry,
R.P.
(1989) Growth in vitro of cells from renal glomerulus. Difficulties in establishing long-term cultures of rat glomerular endothelium. Int. Urol. Nephrol., 21, 105-112.
-
Huo,
L.R. &
Zhong,
N.
(2008) Identification of transcripts and translatants targeted by overexpressed PCBP1. Biochim. Biophys. Acta, 1784, 1524-1533.
-
Iori,
E.,
Millioni,
R.,
Puricelli,
L.,
Arrigoni,
G.,
Lenzini,
L.,
Trevisan,
R.,
James,
P.,
Rossi,
G.P.,
Pinna,
L.A. &
Tessari,
P.
(2008) Glycolytic enzyme expression and pyruvate kinase activity in cultured fibroblasts from type 1 diabetic patients with and without nephropathy. Biochim. Biophys. Acta, 1782, 627-633.
-
Kabgani,
N.,
Grigoleit,
T.,
Schulte,
K.,
Sechi,
A.,
Sauer-Lehnen,
S.,
Tag,
C.,
Boor,
P.,
Kuppe,
C.,
Warsow,
G.,
Schordan,
S.,
Mostertz,
J.,
Chilukoti,
R.K.,
Homuth,
G.,
Endlich,
N.,
Tacke,
F.,
Weiskirchen,
R.,
Fuellen,
G.,
Endlich,
K.,
Floege,
J.,
Smeets,
B. &
Moeller,
M.J.
(2012) Primary cultures of glomerular parietal epithelial cells or podocytes with proven origin. PLoS One, 7, e34907.
-
Kasinath,
B.S.,
Mariappan,
M.M.,
Sataranatarajan,
K.,
Lee,
M.J. &
Feliers,
D.
(2006) mRNA translation: unexplored territory in renal science. J. Am. Soc. Nephrol., 17, 3281-3292.
-
Katsuya,
K.,
Yaoita,
E.,
Yoshida,
Y.,
Yamamoto,
Y. &
Yamamoto,
T.
(2006) An improved method for primary culture of rat podocytes. Kidney Int., 69, 2101-2106.
-
Kiledjian,
M.,
Wang,
X. &
Liebhaber,
S.A.
(1995) Identification of two KH domain proteins in the alpha-globin mRNP stability complex. EMBO J., 14, 4357-4364.
-
Kim,
H.J.,
Cho,
E.H.,
Yoo,
J.H.,
Kim,
P.K.,
Shin,
J.S.,
Kim,
M.R. &
Kim,
C.W.
(2007) Proteome analysis of serum from type 2 diabetics with nephropathy. J. Proteome Res., 6, 735-743.
-
Kim,
Y.K.,
Ko,
S.H.,
Woo,
J.S.,
Lee,
S.H. &
Jung,
J.S.
(1998) Difference in H2O2 toxicity between intact renal tubules and cultured proximal tubular cells. Biochem. Pharmacol., 56, 489-495.
-
Kreidberg,
J.A.,
Donovan,
M.J.,
Goldstein,
S.L.,
Rennke,
H.,
Shepherd,
K.,
Jones,
R.C. &
Jaenisch,
R.
(1996) Alpha 3 beta 1 integrin has a crucial role in kidney and lung organogenesis. Development, 122, 3537-3547.
-
Krtil,
J.,
Platenik,
J.,
Kazderova,
M.,
Tesar,
V. &
Zima,
T.
(2007) Culture methods of glomerular podocytes. Kidney Blood Press. Res., 30, 162-174.
-
Leehey,
D.J.,
Isreb,
M.A.,
Marcic,
S.,
Singh,
A.K. &
Singh,
R.
(2005) Effect of high glucose on superoxide in human mesangial cells: role of angiotensin II. Nephron. Exp. Nephrol., 100, e46-53.
-
Liu,
X.,
Luo,
F.,
Pan,
K.,
Wu,
W. &
Chen,
H.
(2007) High glucose upregulates connective tissue growth factor expression in human vascular smooth muscle cells. BMC Cell Biol., 8, 1.
-
Mandache,
E. &
Penescu,
M.
(2012) Nanostructural features of diabetic podocytopathy. Rom. J. Morphol. Embryol., 53, 23-27.
-
Masson,
E.,
Wiernsperger,
N.,
Lagarde,
M. &
El Bawab,
S.
(2005) Glucosamine induces cell-cycle arrest and hypertrophy of mesangial cells: implication of gangliosides. Biochem. J., 388, 537-544.
-
Mauer,
S.M.,
Steffes,
M.W.,
Ellis,
E.N.,
Sutherland,
D.E.,
Brown,
D.M. &
Goetz,
F.C.
(1984) Structural-functional relationships in diabetic nephropathy. J. Clin. Invest., 74, 1143-1155.
-
Meier,
M.,
Kaiser,
T.,
Herrmann,
A.,
Knueppel,
S.,
Hillmann,
M.,
Koester,
P.,
Danne,
T.,
Haller,
H.,
Fliser,
D. &
Mischak,
H.
(2005) Identification of urinary protein pattern in type 1 diabetic adolescents with early diabetic nephropathy by a novel combined proteome analysis. J. Diabetes Complications, 19, 223-232.
-
Merchant,
M.L. &
Klein,
J.B.
(2009) Proteomics and diabetic retinopathy. Clin. Lab. Med., 29, 139-149.
-
Miettinen,
A.,
Solin,
M.L.,
Reivinen,
J.,
Juvonen,
E.,
Vaisanen,
R. &
Holthofer,
H.
(1999) Podocalyxin in rat platelets and megakaryocytes. Am. J. Pathol., 154, 813-822.
-
Nagata,
M.,
Yamaguchi,
Y. &
Ito,
K.
(1993) Loss of mitotic activity and the expression of vimentin in glomerular epithelial cells of developing human kidneys. Anat. Embryol. (Berl.), 187, 275-279.
-
Nakatsue,
T.,
Koike,
H.,
Han,
G.D.,
Suzuki,
K.,
Miyauchi,
N.,
Yuan,
H.,
Salant,
D.J.,
Gejyo,
F.,
Shimizu,
F. &
Kawachi,
H.
(2005) Nephrin and podocin dissociate at the onset of proteinuria in experimental membranous nephropathy. Kidney Int., 67, 2239-2253.
-
Ohse,
T.,
Pippin,
J.W.,
Chang,
A.M.,
Krofft,
R.D.,
Miner,
J.H.,
Vaughan,
M.R. &
Shankland,
S.J.
(2009) The enigmatic parietal epithelial cell is finally getting noticed: a review. Kidney Int., 76, 1225-1238.
-
Oliva,
D.,
Cali,
L.,
Feo,
S. &
Giallongo,
A.
(1991) Complete structure of the human gene encoding neuron-specific enolase. Genomics, 10, 157-165.
-
Osterby,
R.,
Gall,
M.A.,
Schmitz,
A.,
Nielsen,
F.S.,
Nyberg,
G. &
Parving,
H.H.
(1993) Glomerular structure and function in proteinuric type 2 (non-insulin-dependent) diabetic patients. Diabetologia, 36, 1064-1070.
-
Pancholi,
V.
(2001) Multifunctional alpha-enolase: its role in diseases. Cell. Mol. Life Sci., 58, 902-920.
-
Pavenstadt,
H.,
Kriz,
W. &
Kretzler,
M.
(2003) Cell biology of the glomerular podocyte. Physiol. Rev., 83, 253-307.
-
Pedersen,
P.L. &
Amzel,
L.M.
(1993) ATP synthases. Structure, reaction center, mechanism, and regulation of one of nature’s most unique machines. J. Biol. Chem., 268, 9937-9940.
-
Petermann,
A.T.,
Krofft,
R.,
Blonski,
M.,
Hiromura,
K.,
Vaughn,
M.,
Pichler,
R.,
Griffin,
S.,
Wada,
T.,
Pippin,
J.,
Durvasula,
R. &
Shankland,
S.J.
(2003) Podocytes that detach in experimental membranous nephropathy are viable. Kidney Int., 64, 1222-1231.
-
Qiu,
W.,
Zhou,
Y.,
Jiang,
L.,
Fang,
L.,
Chen,
L.,
Su,
W.,
Tan,
R.,
Zhang,
C.Y.,
Han,
X. &
Yang,
J.
(2012) Genipin inhibits mitochondrial uncoupling protein 2 expression and ameliorates podocyte injury in diabetic mice. PLoS One, 7, e41391.
-
Ransom,
R.F.,
Vega-Warner,
V.,
Smoyer,
W.E. &
Klein,
J.
(2005) Differential proteomic analysis of proteins induced by glucocorticoids in cultured murine podocytes. Kidney Int., 67, 1275-1285.
-
Rao,
P.V.,
Lu,
X.,
Standley,
M.,
Pattee,
P.,
Neelima,
G.,
Girisesh,
G.,
Dakshinamurthy,
K.V.,
Roberts,
C.T. Jr. &
Nagalla,
S.R.
(2007) Proteomic identification of urinary biomarkers of diabetic nephropathy. Diabetes Care, 30, 629-637.
-
Reeves,
W.,
Caulfield,
J.P. &
Farquhar,
M.G.
(1978) Differentiation of epithelial foot processes and filtration slits: sequential appearance of occluding junctions, epithelial polyanion, and slit membranes in developing glomeruli. Lab. Invest., 39, 90-100.
-
Sakairi,
T.,
Abe,
Y.,
Kajiyama,
H.,
Bartlett,
L.D.,
Howard,
L.V.,
Jat,
P.S. &
Kopp,
J.B.
(2010) Conditionally immortalized human podocyte cell lines established from urine. Am. J. Physiol. Renal Physiol., 298, F557-567.
-
Schordan,
S.,
Schordan,
E.,
Endlich,
N.,
Lindenmeyer,
M.T.,
Meyer-Schwesinger,
C.,
Meyer,
T.N.,
Giebel,
J.,
Cohen,
C.D.,
Endlich,
K. &
Maurer,
M.H.
(2009) Alterations of the podocyte proteome in response to high glucose concentrations. Proteomics, 9, 4519-4528.
-
Schrijvers,
B.F.,
De Vriese,
A.S. &
Flyvbjerg,
A.
(2004) From hyperglycemia to diabetic kidney disease: the role of metabolic, hemodynamic, intracellular factors and growth factors/cytokines. Endocr. Rev., 25, 971-1010.
-
Senthil,
D.,
Choudhury,
G.G.,
McLaurin,
C. &
Kasinath,
B.S.
(2003) Vascular endothelial growth factor induces protein synthesis in renal epithelial cells: a potential role in diabetic nephropathy. Kidney Int., 64, 468-479.
-
Shankland,
S.J.
(2006) The podocyte’s response to injury: role in proteinuria and glomerulosclerosis. Kidney Int., 69, 2131-2147.
-
Sharma,
K. &
Ziyadeh,
F.N.
(1995) Hyperglycemia and diabetic kidney disease. The case for transforming growth factor-beta as a key mediator. Diabetes, 44, 1139-1146.
-
Shevchenko,
A.,
Wilm,
M.,
Vorm,
O. &
Mann,
M.
(1996) Mass spectrometric sequencing of proteins silver-stained polyacrylamide gels. Anal. Chem., 68, 850-858.
-
Smeets,
B.,
Dijkman,
H.B.,
Wetzels,
J.F. &
Steenbergen,
E.J.
(2006) Lessons from studies on focal segmental glomerulosclerosis: an important role for parietal epithelial cells? J. Pathol., 210, 263-272.
-
So,
E.J.,
Kim,
H.J. &
Kim,
C.W.
(2008) Proteomic analysis of human proximal tubular cells exposed to high glucose concentrations. Proteomics Clin. Appl., 2, 1118-1126.
-
Stamenkovic,
I.,
Skalli,
O. &
Gabbiani,
G.
(1986) Distribution of intermediate filament proteins in normal and diseased human glomeruli. Am. J. Pathol., 125, 465-475.
-
Susztak,
K.,
Raff,
A.C.,
Schiffer,
M. &
Bottinger,
E.P.
(2006) Glucose-induced reactive oxygen species cause apoptosis of podocytes and podocyte depletion at the onset of diabetic nephropathy. Diabetes, 55, 225-233.
-
Takano,
Y.,
Yamauchi,
K.,
Hiramatsu,
N.,
Kasai,
A.,
Hayakawa,
K.,
Yokouchi,
M.,
Yao,
J. &
Kitamura,
M.
(2007) Recovery and maintenance of nephrin expression in cultured podocytes and identification of HGF as a repressor of nephrin. Am. J. Physiol. Renal Physiol., 292, F1573-1582.
-
Tilton,
R.G.,
Haidacher,
S.J.,
Lejeune,
W.S.,
Zhang,
X.,
Zhao,
Y.,
Kurosky,
A.,
Brasier,
A.R. &
Denner,
L.
(2007) Diabetes-induced changes in the renal cortical proteome assessed with two-dimensional gel electrophoresis and mass spectrometry. Proteomics, 7, 1729-1742.
-
Tufro,
A. &
Veron,
D.
(2012) VEGF and podocytes in diabetic nephropathy. Semin. Nephrol., 32, 385-393.
-
Vaughan,
M.R.,
Pippin,
J.W.,
Griffin,
S.V.,
Krofft,
R.,
Fleet,
M.,
Haseley,
L. &
Shankland,
S.J.
(2005) ATRA induces podocyte differentiation and alters nephrin and podocin expression in vitro and in vivo. Kidney Int., 68, 133-144.
-
White,
K.E.
(2006) Research into the glomerular podocyte — is it relevant to diabetic nephropathy? Diabet. Med., 23, 715-719.
-
Wolf,
G.
(2004) New insights into the pathophysiology of diabetic nephropathy: from haemodynamics to molecular pathology. Eur. J. Clin. Invest., 34, 785-796.
-
Wolf,
G.,
Chen,
S. &
Ziyadeh,
F.N.
(2005a) From the periphery of the glomerular capillary wall toward the center of disease: podocyte injury comes of age in diabetic nephropathy. Diabetes, 54, 1626-1634.
-
Wolf,
G.,
Schanze,
A.,
Stahl,
R.A.,
Shankland,
S.J. &
Amann,
K.
(2005b) p27(Kip1) Knockout mice are protected from diabetic nephropathy: evidence for p27(Kip1) haplotype insufficiency. Kidney Int., 68, 1583-1589.
-
Wolf,
G.,
Schroeder,
R.,
Zahner,
G.,
Stahl,
R.A. &
Shankland,
S.J.
(2001) High glucose-induced hypertrophy of mesangial cells requires p27(Kip1), an inhibitor of cyclin-dependent kinases. Am. J. Pathol., 158, 1091-1100.
-
Wolf,
G. &
Ziyadeh,
F.N.
(2007) Cellular and molecular mechanisms of proteinuria in diabetic nephropathy. Nephron. Physiol., 106, p26-31.
-
Xie,
X.,
Li,
S.,
Liu,
S.,
Lu,
Y.,
Shen,
P. &
Ji,
J.
(2008) Proteomic analysis of mouse islets after multiple low-dose streptozotocin injection. Biochim. Biophys. Acta, 1784, 276-284.