Abstract
Sleep disorder and metabolic syndrome (MetS) are important health-related problems. Recently, sleep duration has decreased among Korean adults. In this study, we examined whether sleep quality is associated with MetS by analyzing 301 subjects, aged 20 years or over, without acute and severe illness who visited three primary care clinics. Sleep duration, sleep quality and the risk of sleep-related breathing disorder (SRBD) were assessed with a standardized sleeping-estimating instrument. MetS was defined according to the modified diagnostic criteria of the National Cholesterol Education Program Adult Treatment Panel-III using the Korean abdominal obesity definition. In the multiple logistic regression analysis, compared with the 7-hour sleep group, the adjusted odds ratios (ORs) of the ≤ 5- and ≥ 9-hour sleep groups for MetS were 4.89 and 5.98, respectively. Compared with the good-sleep quality and low-SRBD risk groups, the adjusted ORs of the poor-quality sleep and high-SRBD risk groups were 3.83 and 1.92, respectively (p < 0.05). In the ≤ 5- and ≥ 9-hour sleep groups, the prevalence of elevated triglyceride and high HOMA-IR was higher (p = 0.069). In the poor-quality sleep group, the prevalence of abdominal obesity, elevated triglyceride, low HDL cholesterol, high fasting insulin and high HOMA-IR were higher. In the high-SRBD risk group, the prevalence of abdominal obesity, obesity and elevated triglyceride were higher (p < 0.05). Overall, the ≤ 5- or ≥ 9-hour sleep duration, poor-quality sleep and high-SRBD risk are related with the high prevalence of MetS, perhaps through elevated insulin-resistance resulting from adiposity.
Introduction
Sleep is one of the most crucial factors causing various health-related problems. Generally, proper sleep duration is about 7-8 hours in healthy adults (Heslop et al. 2002; Ayas et al. 2003). However, recently, sleep duration has decreased among Korean adults. According to the third Korea National Health and Nutrition Examination Survey (KNHANES-III) 2005, the daily average sleep duration was 6.9 hours in Korean adults. About 13.4% of those who responded stated that they slept 6 hours or less (Korean Ministry of Health and Welfare 2006). Short or long sleep duration increases cardiovascular risk and mortality or even, all-cause mortality (Heslop et al. 2002; Ayas et al. 2003). However, recent studies have also reported that short or long sleep duration and sleep-related breathing disorder (SRBD), including obstructive sleep apnea syndrome (OSAS), are associated with obesity, insulin-resistance and hyperglycemia, hypertension or dyslipidemia (Narkiewicz et al. 1998; Phillips et al. 1999; Peppard et al. 2000; Spiegel et al. 2004, 2005; Taheri et al. 2004; Gangwisch et al. 2005, 2006; Vorona et al. 2005; Knutson et al. 2006; Bjorvatn et al. 2007). Nevertheless, these results remain contentious, and only a few studies (particularly in Korea) have addressed the relationship between sleep and metabolic syndrome (MetS) (Sasanabe et al. 2006; Bjorvatn et al. 2007; Jennings et al. 2007; Choi et al. 2008).
Although there is a large-scale study of the relationship between sleep duration and MetS using the data of the KNHANES-II (2001) in Korea (Choi et al. 2008), only sleep duration, among the various sleep parameters, was considered as a predictive variable of MetS; stress and depression, which are factors that may affect sleep patterns, were not considered in the study. However, stress has been reported as a predictor of MetS (Björntorp and Rosmond 2000; Rosmond 2005)
A co-existing or clustering condition of multiple interrelated metabolic risk factors, such as obesity, insulin-resistance, hyperglycemia, hypertension and dyslipidemia, is called MetS (National Cholesterol Education Program (NCEP) Expert Panel on Detection, Evaluation, and Treatment of High Blood Cholesterol in Adults (Adult Treatment Panel III) 2002). In the United States, the age-adjusted prevalence of MetS is about 24% in adults (Ford et al. 2002; Meigs 2002), whereas in Korean adults aged 20-years and older, the crude prevalence is about 26% (Korean Ministry of Health and Welfare 2006). A study reported that MetS increases the cardiovascular risk by about 2-fold and the risk of diabetes by 4-fold or more (Meigs 2002). Even though each component of MetS is an independent risk factor of cardiovascular disease (CVD) and diabetes, the various components of MetS can be interrelated (National Cholesterol Education Program (NCEP) Expert Panel on Detection, Evaluation, and Treatment of High Blood Cholesterol in Adults (Adult Treatment Panel III) 2002; Grundy et al. 2005) and thus, have synergistic effects on the increased risk of atherosclerosis, CVD and diabetes (Golden et al. 2002; Klein et al. 2002). Therefore, it is important to examine the relationship between sleep and MetS, despite the fact that sleep can be associated with each component of MetS, such as obesity, insulin-resistance, hyperglycemia, hypertension and dyslipidemia.
Sleep disorder and MetS are both important health-related problems. Yet, in Korea, little is known of the relationship between sleep and MetS. Therefore, this study was undertaken to clarify the association between sleep and MetS in Korean adults. We evaluated the prevalence of MetS and its components according to the self-reported sleep duration, sleep quality and SRBD risk; moreover, we also considered co-variables, such as stress and depressive mood, which may affect sleep patterns or the prevalence of MetS.
Materials and Methods
Study Subjects
This cross-sectional study was conducted with adults aged 20 years or over who visited the primary care clinic of either Korea University Guro Hospital, Korea University Ansan Hospital or Seoul Veterans Hospital from August to October 2007. A brief interview was conducted in order to take the illness history of each subject prior to enrollment. Subjects were excluded if they met any of the following criteria: past/present medical history included heart disease, kidney disease, asthma, lung disease, severe liver disease, other endocrine disease (except diabetes, obesity and dyslipidemia), familial dyslipidemia and history of cancer, stroke or other atheromatous vascular disease; use of drugs that could have a potential effect on blood pressure, blood sugar and lipid or body weight (except anti-hypertensive drugs and anti-diabetic drugs) such as lipid-lowering drugs, non-steroidal anti-inflammatory drugs (NSAIDs), steroids, herbal medications, insulin and hormone replacements; occupation involving shifted hours of sleep/wakefulness (i.e., shift-worker) or necessitating recovery from jet-lag (i.e., airline-pilot); or pregnant or breast-feeding women.
Informed consent was obtained from all subjects prior to enrollment. Three hundred fifty subjects were initially enrolled. Of these, 49 individuals were excluded from the final analysis (age < 20 years: n = 1; severe liver disease: n = 2; hyperthyroidism: n = 1; taking lipid-lowering drugs: n = 12; taking herbal medications: n = 1; shift-workers: n = 1; no sign on the informed consent: n = 4; missing anthropometric data: n = 2; missing laboratory data: n = 12; incomplete questionnaire: n = 13). The final number of study subjects was 301.
The sample size required for this study was calculated as 287 by using the results of a previous study (Jennings et al. 2007) and the prevalence of MetS in Korean adults (Korean Ministry of Health and Welfare 2006) as reference: the previous study reported that the age and gender adjusted odds ratio (OR) for MetS was increased by 1.44 for every 2.6 increase in the global Pittsburgh Sleep Quality Index score; the prevalence of MetS was 26.4% in Korean adults aged 20 years and older according to the KNHANES-III (2005) report.
This study was approved by the institutional review boards of Korea University Guro Hospital, Korea University Ansan Hospital and Seoul Veterans Hospital (IRB No. GH-0718; AS-0729; SVH-2007-14).
Study Procedure
Anthropometry: Blood pressure, waist circumference, height and body weight were estimated for the study procedure. Blood pressure was measured with an automatic digital sphygmomanometer with each subject in a sitting position after more than 10 minutes of rest. Waist circumference was measured according to the recommendation by the World Health Organization (WHO), which produces relatively small intra- and inter-observer variations (Lee et al. 2002). The body mass index (BMI) was calculated using the following formula: [BMI = Weight (kg) / Height (m2)]. According to the WHO West-Pacific region classification (Bassett et al. 2000), we categorized subjects with a BMI of < 18.5 kg/m2 as underweight, 18.5-22.9 kg/m2 as normal, 23-24.9 kg/m2 as overweight and ≥ 25 kg/m2 as obese.
Blood testing: All blood samples were collected after a fasting of over 12 hours. Serum glucose, lipid profiles including triglyceride (TG) and high-density lipoprotein cholesterol (HDL-C) and insulin level were measured. Insulin-resistance was assessed by the Homeostasis Model Assessment-Insulin Resistance [HOMA-IR = fasting glucose (mmol/L) × fasting insulin (μU/mL) / 22.5] (Matthews et al. 1985), which correlates well with the criterion standard hyperinsulinemic euglycemic clamp method (r = 0.88, p < 0.0001). The subjects were divided into high and low groups by using the third quartile (75 percentile) point as the cut-off point for insulin or HOMA-IR value, respectively.
Diagnosis of metabolic syndrome: MetS was defined according to the modified diagnostic criteria of the National Cholesterol Education Program Adult Treatment Panel (NCEP-ATP)-III (National Cholesterol Education Program (NCEP) Expert Panel on Detection, Evaluation, and Treatment of High Blood Cholesterol in Adults (Adult Treatment Panel III) 2002) using the definition of abdominal obesity (≥ 90 cm in male, ≥ 85 cm in female) suggested by the Korean Society for the Study of Obesity (KSSO) (Lee et al. 2006). Subjects taking either an anti-hypertensive drug or anti-diabetic drug were included in the elevated blood pressure (BP) or elevated fasting blood sugar (FBS) group, respectively.
Questionnaires
Self-reported questionnaires were used to conduct a survey regarding the subjects’ socio-demographic characteristics (gender, age, education status, job and economic status) and medical histories (present/past illness, drug use, tobacco use, alcohol consumption and regular exercise habits). The subjects were grouped according to alcohol consumption (estimated by weekly drinking frequency and amount, according to each type of alcoholic beverage; daily alcohol intake of 0 g, 0.1-29.9 g and ≥ 30 g defined as non-drinker, moderate drinker and heavy drinker, respectively). They were also categorized according to exercise intensity, frequency and duration (non-exercise, irregular exercise, regular exercise). Subjects who responded “no exercise” or “any exercise with perspiration, three times or more per week and 20 minutes or more per day” were each included into the non-exercise group and regular exercise group, respectively; all others were included in the irregular exercise group.
Pittsburgh Sleep Quality Index-Korean version (PSQI-K): The PSQI-K (Kim 1998) was used to investigate the subjects’ sleep duration (indicating daily average of actual sleep duration), sleep quality and SRBD. The PSQI, which was developed in 1989 (Buysse et al. 1989), is a standardized self-reported questionnaire for evaluating the subjective sleep quality over the previous month; this index has been used in various medical research fields (Buysse et al. 1989; Dolberg et al. 1998; Kim 1998; Park et al. 2000). The PSQI was translated and modified into the Korean version (PSQI-K) (Kim 1998), of which the Cronbach’s α was 0.70.
19 questions of the PSQI are combined into seven clinically-derived component scores (subjective sleep quality, sleep latency and duration, habitual sleep efficiency, sleep disturbance, use of sleeping medication and daytime dysfunction), each weighted equally from 0-3. The seven component scores are then added in order to obtain a global score rating from 0-21, with higher scores indicating worse sleep quality (Buysse et al. 1989).
In this study, the subjects’ sleep duration was categorized into five groups of ≤ 5, 6, 7, 8 and ≥ 9 hours, indicating < 5.5, 5.5-6.49, 6.5-7.49, 7.5-8.49 and ≥ 8.5 hours, respectively. The 7-hour duration was used as a point of reference, because healthy sleep duration is associated with the lowest cardiovascular risk and mortality or all-cause mortality (Heslop et al. 2002; Ayas et al. 2003). In the subjects’ sleep quality, the global PSQI score of > 5 points was defined as poor sleep quality (Buysse et al. 1989; Kim 1998). In the SRBD risk, subjects were categorized as being at high risk of SRBD if they responded in the questionnaire that their sleep was disturbed three or more times per week due to difficulty in breathing or coughing/snoring. Subjects who responded that their bed partners had noticed loud snoring or pauses between breathing during sleep one or more times per week were also categorized as being at high risk (Knutson et al. 2006). In this study, Cronbach’s α for PSQI-K was measured as 0.71.
Brief Encounter Psychosocial Instrument-Korean version (BEPSI-K): The BEPSI-K (revised version)(Huh et al. 1996) was used to measure the subjects’ level of stress, which is considered to be associated with MetS (Björntorp and Rosmond 2000; Rosmond 2005). The BEPSI-K is the modified Korean version of BEPSI, a stress assessment scale developed in 1988 (Frank and Zyzanski 1988), of which five closed questions were translated and modified (Bae et al. 1992). Cronbach’s α of BEPSI-K was 0.84 in healthy adults and 0.88 in new outpatient clinic patients (Bae et al. 1992). A revised version was developed to correct the loose translations or difficult to answer questions of BEPSI-K (Huh et al. 1996); moreover, this version established its validity and reliability, having a Cronbach’s α of 0.80.
Each of the five closed questions of the BEPSI-K reflects an extrinsic demand, intrinsic demand, attributional demand, demand uncertainty and demand perspective. Each is scored equally on a scale from 1-5. The five question scores are added and then divided by five (the number of questions) in order to obtain the BEPSI-K score, thereby indicating the level of stress.
We defined each subject in the low (< 1.8 points), moderate (1.8-2.79 points) and high (≥ 2.8 points) stress group, according to the BEPSI-K score (Frank and Zyzanski 1988; Huh et al. 1996). Cronbach’s α for BEPSI-K (revised version) was measured as 0.86 in this study.
Center for Epidemiologic Studies-Depression Scale-Korean version (CES-D-K): The CES-D-K (Heslop et al. 2002) was used to measure the subjects’ depressive symptomatology, which is a factor that can affect sleep patterns. The CES-D is a short self-reported screening instrument developed by the National Institute of Mental Health (NIMH) in 1971; its aim was to provide an epidemiologic investigation of depressive syndrome in the general population. Ever since this scale was developed, it has been translated into various languages; the wide use of the scale throughout the world has established its validity and reliability (Radloff 1977; Shin et al. 1991; Cho and Kim 1993). Cronbach’s α of the CES-D was estimated at 0.80 (Radloff 1977). Shin et al. (1991) developed the first Korean-translated CES-D (K-CES-D), followed by Cho and Kim (Cho and Kim 1993), who developed the CES-D-K fitting the Korean depressive affect and its expression. For the two, Cronbach’s α was estimated as 0.89 and 0.91, respectively.
The CES-D consists of 20 items constituting four sub-scales of depressed affect, positive affect, somatic complaints and interpersonal problems. Each of the 20 items is weighted equally from 0-3, and the sum of each weight is a total score rating from 0-60, with higher scores reflecting greater depressive symptoms. A total score of 21 points was suggested as the cut-off score in Korean adults (Cho and Kim 1993). Therefore, we also defined subjects with a total CES-D score of ≥ 21 points as the depressive group. Cronbach’s α for CES-D-K was measured as 0.82 in this study.
Statistical Analysis
A statistical analysis was conducted with a total of 301 subjects. Pearson’s chi-squared test or Student’s t-test was performed as a univariate analysis. As a multivariable analysis, a multiple logistic regression analysis was performed using the outcome variable of the existence or nonexistence of MetS. The predictor variables used were gender, age, education, job, monthly average household income, smoking, daily alcohol intake, exercise habits, stress level, depressive mood, sleep duration and quality and SRBD risk. All p-values reported were two-sided; values less than 0.05 were considered as evidence of statistical significance. All analyses were conducted using SPSS version 12.0 (SPSS Inc., Chicago, IL, USA).
Results
Characteristics of Study Subjects
Out of a total of 301 subjects, 114 (37.9%) were women (Table 1). The subjects’ mean age was 50.8 ± 13.1 years, and the mean daily alcohol intake was 14.9 ± 24.1 g. The mean BEPSI-K score was 1.8 ± 0.7 points, and those in the high stress group were 9.3%. The mean CES-D score was 9.8 ± 10.3 points, and those in the depressive group were 11.0%.
The mean BMI was 24.6 ± 3.6 kg/m2, and 40.9% of subjects were obese (BMI ≥ 25 kg/m2). The mean waist circumference was 88.4 ± 9.2 cm in men and 82.3 ± 9.6 cm in women. The mean TG level was 155.5 ± 99.9 mg/dL. The mean HDL-C level was 51.8 ± 12.7 mg/dL in men and 57.9 ± 13.5 mg/dL in women. The mean systolic and diastolic blood pressure was 124.8 ± 15.3 mmHg and 80.3 ± 10.8 mmHg, respectively. The mean fasting glucose, fasting insulin and HOMA-IR value was 103.7 ± 31.4 mg/dL, 5.6 ± 5.5 μU/mL and 1.5 ± 1.8, respectively. The prevalence of MetS was 35.2%, and the prevalence of its components is presented in Table 1.
The mean sleep duration was 6.4 ± 1.2 hours, with the majority of the subjects being in the 6-hour (32.6%) and 7-hour (31.9%) group. The mean global PSQI score was 5.7 ± 3.0 points; 41.9% and 34.2% of the subjects were in the poor sleep quality and high risk group of SRBD, respectively (Table 2).
Prevalence of Metabolic Syndrome According to Subjects’ Characteristics
Subjects’ general characteristics and the prevalence of metabolic syndrome: Age, education status, job, alcohol consumption and BMI were variables having statistically significant associations with the prevalence of MetS (Table 3, p < 0.05). The prevalence of MetS was the highest in the group of ≥ 60 years of age (50.0%), an education level of elementary school graduate or less (48.9%), the unemployed subjects including housewives and students (the unemployed/housewife/student) (49.0%) and obese (52.8%). The moderate drinker group conveyed the lowest prevalence of MetS compared with others (p = 0.015). Moreover, subjects with MetS had greater mean BMI, fasting insulin and HOMA-IR compared to others (26.2 ± 3.7 kg/m2 versus 23.7 ± 3.1 kg/m2, 7.7 ± 7.6 μU/mL versus 4.5 ± 3.4 μU/mL, 2.2 ± 2.6 versus 1.1 ± 0.8, respectively; Student’s t-test, p < 0.001).
Subjects’ sleep characteristics and the prevalence of metabolic syndrome and its components: Sleep duration, sleep quality and SRBD risk all presented significant associations with the prevalence of MetS (Tables 4 and 5, p < 0.05). With regard to sleep duration, the 7-hour sleep group (24.0%) showed the lowest prevalence of MetS, whereas MetS was more prevalent in the ≤ 5-hour (66.7%) and ≥ 9-hour (61.5%) groups. Concerning sleep quality, the prevalence of MetS was not only higher in the group with a global PSQI score of > 5 points (52.4%), but the mean global PSQI score was also higher in subjects with MetS (6.6 ± 3.3 points versus 5.2 ± 2.6 points; Student’s t-test, p < 0.001). Concerning SRBD risk, the high risk group (45.6%) revealed a higher prevalence of MetS than the low risk group.
Elevated TG was a component of MetS that was significantly associated with sleep duration (Table 4, p = 0.030). Both the ≥ 9-hour (69.2%) and ≤ 5-hour (56.9%) sleep groups showed the higher prevalence of elevated TG compared to others. There was also a trend toward only the lower prevalence of high HOMA-IR in the 8-hour sleep group (18.6%) and 7-hour sleep group (18.8%), but was also higher in the ≤ 5-hour (39.2%) and 9-hour (30.8%) sleep groups, although it did not reach significance (p = 0.069). Abdominal obesity, elevated TG, low HDL-C, high fasting insulin and high HOMA-IR were all components of MetS demonstrating a significant relationship with sleep quality (Table 5, p < 0.05). As compared with the other groups, the group with a global PSQI score of > 5 points displayed a higher prevalence of abdominal obesity (50.0%), elevated TG (51.6%), low HDL-C (25.4%), high fasting insulin (32.5%) and high HOMA-IR (32.5%). The high-risk group of SRBD also presented a significantly higher prevalence of abdominal obesity (51.5%), obesity (55.3%) and elevated TG (57.3%) compared with the other groups (Table 5, p < 0.05). Moreover, the number of MetS components had a higher prevalence in both the ≥ 9-hour and ≤ 5-hour sleep groups in the group with a global PSQI score of > 5 points and in the high risk group of SRBD, respectively. The more its number increased, the more significant this relationship became (Tables 4 and 5).


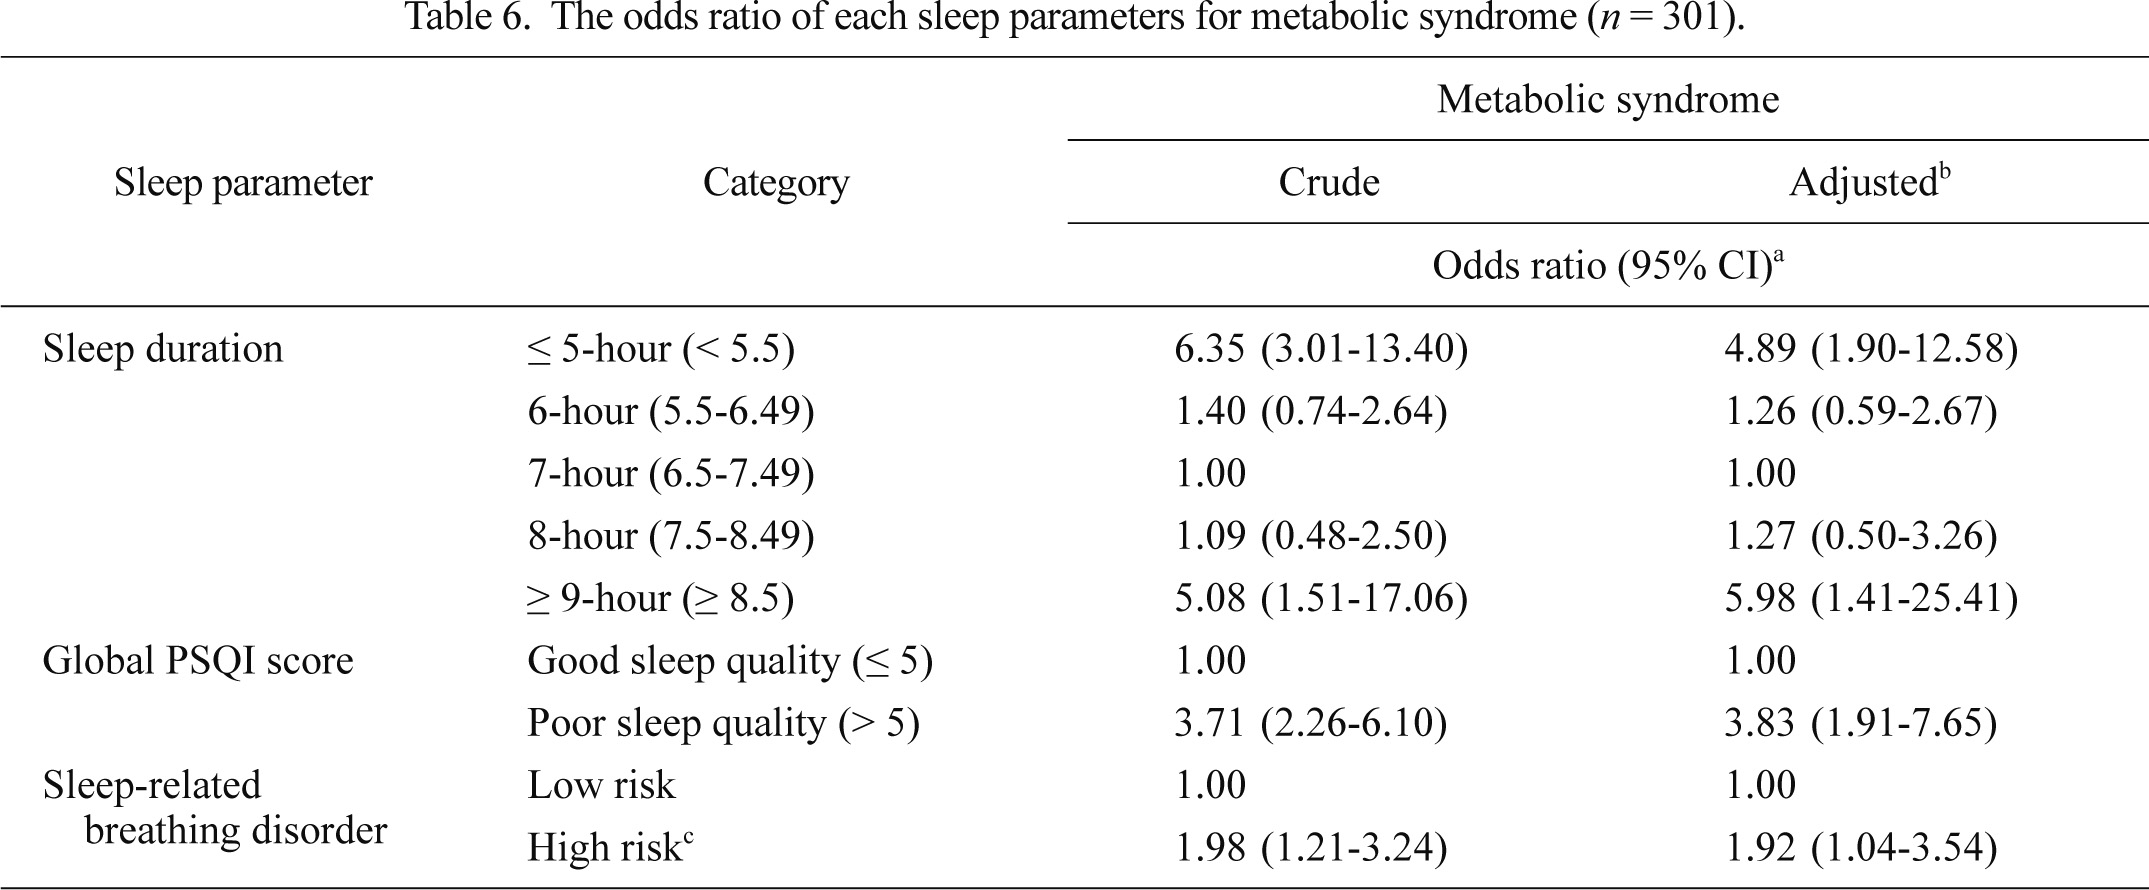
We performed a multiple logistic regression analysis in order to examine the OR of each sleep parameter for MetS both before and after adjustment for the other co-variables (Table 6). The 7-hour sleep group, good-sleep quality group and low risk group of SRBD were used as reference categories in the multivariate model, because they showed the lowest prevalence of MetS in the univariate analysis. The crude OR of the ≤ 5- and ≥ 9-hour sleep groups for MetS was 6.35 (3.01-13.40) and 5.08 (1.51-17.06), respectively, and the adjusted OR was 4.89 (1.90-12.58) and 5.98 (1.41-25.41), respectively. The crude and adjusted ORs of the poor-sleep quality group were 3.71 (2.26-6.10) and 3.83 (1.91-7.65), respectively. The crude and adjusted ORs of the high-risk group of SRBD were 1.98 (1.21-3.24) and 1.92 (1.04-3.54), respectively. All ORs were statistically significant (p < 0.05).
Discussion
For the participating 301 Korean adults aged 20 years and older, we examined whether sleep duration, sleep quality and SRBD risk are associated with MetS, considering both stress and depressive mood.
The present results indicate that sleep duration, sleep quality and SRBD risk are associated with MetS. Concerning sleep duration, the ≤ 5-hour (66.7%) and ≥ 9-hour (61.5%) sleep groups showed a higher prevalence of MetS, which generally presented a trend of a U-shaped curvilinear pattern (Tables 4 and 6). Concerning the prevalence of MetS components according to sleep duration, elevated TG was significantly associated with sleep duration, which also generally showed a U-shaped curvilinear pattern (Table 4). High HOMA-IR also generally presented a U-shaped curvilinear pattern relationship with sleep duration, although it did not reach statistical significance (p = 0.069). Therefore, it is considered that as sleep duration decreases or increases, the more frequent MetS becomes; further, the elevations of TG and insulin-resistance become involved in this relationship.
Another study reported a similar result with ours (Choi et al. 2008). The authors examined the relationship between sleep duration and MetS in Korean adults ≥ 20 years of age, using the data of the KNHANES-II (2001). As a result of the study, when the 7-hour sleep group was used as a reference category, the crude OR of the ≤ 5- and ≥ 9-hour sleep groups for MetS was 1.74 (1.33-2.26) and 1.55 (1.15-2.07), respectively. In the multiple logistic regression analysis, after adjusting for age, gender, family histories of hypertension and diabetes, residence location, education level, monthly income, drinking, smoking and exercise, the adjusted OR of each group for MetS was 1.15 (0.85-1.55) and 1.46 (1.07-1.98), respectively. And also there was a U-shaped curvilinear pattern relationship between sleep duration and MetS (p < 0.05).
In our study, only elevated TG was the lipid-related component of MetS to be associated with sleep duration, whereas low HDL-C was not; moreover, there was a relationship of a U-shaped curvilinear pattern between the two (Table 4). However, in a study that used the data of a health survey conducted in Hordaland County, Norway (Hordaland Health Study) (Bjorvatn et al. 2007), it reported that sleep duration was not only directly associated with TG, including total cholesterol, but also inversely associated with HDL-C. However, this statistical significance disappeared after adjusting for age, gender and BMI. Because this latter study estimated the total cholesterol, TG and HDL-C level by using non-fasting blood samples and also defined the subjects as a limited population aged between 40-45 years, their study results could differ from ours. Moreover, concerning the gender ratio of the study subjects, the number of women (5,329) was greater than men (3,531), while the percentage of men (62.1%) was higher than women in our study; this difference of gender ratio between both studies could lead to the different results. In fact, in the latter study, TG was positively related to male gender and HDL-C was positively related to female gender (p < 0.05) (Bjorvatn et al. 2007).
Concerning sleep quality, the prevalence of MetS was presently higher in the poor-sleep quality group than in the other groups (Tables 5 and 6). Regarding the prevalence of MetS components according to sleep quality, the prevalence was higher in the poor-sleep quality group than in the other groups. Sleep quality was also significantly related with not only central adiposity-related components, including abdominal obesity, elevated TG and low HDL-C, but also with elevated insulin resistance-presenting components, including high fasting insulin and high HOMA-IR (Table 5). Therefore, it is considered that as poor sleep quality increases, MetS becomes more frequent, with elevated insulin-resistance resulting from central adiposity being involved in this relationship.
Another previous study produced similar findings to ours (Jennings et al. 2007). The study was conducted with 231 residents of Allegheny County, Pennsylvania who were between 30-54 years of age. The relationship between self-reported sleep quality was examined using PSQI and MetS; the age and gender adjusted OR for MetS was increased by 1.44 (1.01-2.06) for every 2.6 increase in the global PSQI score (p = 0.04). Previously, the authors suggested that sleep quality could influence MetS through its relationship with adiposity-related insulin-resistance, although they could not demonstrate a definite mechanism for this. When the authors examined the relationship between sleep quality and the risk factors comprising the MetS as well as the insulin, HOMA-IR, BMI and percentage of body fat, after controlling for age and gender, the global PSQI score was directly associated with not only the components related to adiposity including BMI, waist circumference and percentage of body fat, but also with others related to insulin-resistance including fasting glucose, insulin and HOMA-IR (p < 0.05).
Presently, concerning the SRBD risk, the high risk group showed a higher prevalence of MetS and its components related to adiposity, including abdominal obesity, obesity and elevated TG compared to the other groups (Tables 5 and 6).
Sasanabe et al. (2006) also obtained similar results with ours in their study, which examined the relationship between OSAS and MetS in 908 Japanese subjects (89 controls). Their study portrayed that both men and women with OSAS (Apnea-Hypopnea Index [AHI] ≥ 5 /hour) had higher OR for MetS compared with the controls (OR: 3.47 and 6.59; 95% CI: 1.84-6.53 and 1.47-29.38, respectively). After the adjustment for age and BMI, the adjusted OR of the AHI ≥ 15 /hour group was 2.08 (1.41-3.06) in men and 2.24 (0.84-5.99) in women.
Another notable aspect of this study was that the prevalence of MetS components, even though without significance, did not only present a trend of generally a U-shaped curvilinear pattern, according to sleep duration, and was higher in both groups of poor-sleep quality and high-SRBD risk compared to other groups, but it also displayed an increasing significance of the trend for the increasing number of components (Tables 4 and 5). These results provide support for previous findings, that each cardiovascular risk factor constituting MetS can be interrelated (National Cholesterol Education Program (NCEP) Expert Panel on Detection Evaluation and Treatment of High Blood Cholesterol in Adults (Adult Treatment Panel III) 2002; Grundy et al. 2005) and have synergistic effects (Golden et al. 2002; Klein et al. 2002).
In this study, we used self-reported questionnaires, including PSQI-K, BEPSI-K (revised version) and CES-D-K, to survey the sleep-related factors along with the levels of depression and stress. The PSQI is a standardized sleep quality-measuring instrument (Buysse et al. 1989); at its development, its Cronbach’s α and test-retest reliability was 0.83 and 0.85, respectively. It was translated and modified into the Korean version (Kim 1998), with a Cronbach’s α of 0.70. Although the PSQI can estimate only subjective sleep quality experienced by a responder, it is considered as a convenient and relatively precise measuring instrument for assessing general sleep quality (Buysse et al. 1989; Dolberg et al. 1998; Kim 1998; Park et al. 2000). In this study, Cronbach’s α for PSQI-K was measured as 0.71. BEPSI-K (Frank and Zyzanski 1988; Bae et al. 1992; Huh et al. 1996) and CES-D (Radloff 1977; Shin et al. 1991; Cho and Kim 1993) are also questionnaires for which the reliability and validity have been established. Both have been used in various aspects of medical research; presently, Cronbach’s α for BEPSI-K (revised version) and CES-D-K was 0.86 and 0.82, respectively.
Our study subjects’ characteristics trended toward a lower percentage of women and higher mean age. The prevalence of MetS was higher in this study (35.2%) compared with the KNHANES-III (2005) (26.4%) (Korean Ministry of Health and Welfare 2006). This may be the result of selection bias caused by including only hospital visitors as the subjects of this study. The high risk group percentage of SRBD in our study (45.6%) showed a difference with the study result (22.0%) in the Korean subjects aged 40-69 years (Kim et al. 2004). Because our study depended on a subjective self-reported questionnaire (PSQI) for the sleep assessment, whereas polysomnography was used in the previous Korean study (Kim et al. 2004), the risk prevalence could be over-reported as recall bias occurred. On the other hand, each mean BMI (24.6 ± 3.6 kg/m2) and sleep duration (6.4 ± 1.2 hours) in our study were similar with each result of the KNHANES-III (2005) (23.6 kg/m2, 6.9 hours, respectively) (Korean Ministry of Health and Welfare 2006). Moreover, the mean global PSQI score (5.7 ± 3.0 points) and the prevalence of the poor-sleep quality group (41.9%) was similar with the previous study results (5.6 ± 3.1 points, 41.2%, respectively) (Park et al. 2000). Thus, despite the fact that our study subjects’ characteristics were slightly different from the characteristics of the general population, it is considered that our conclusion is reasonable not only because both the mean BMI and sleep duration were similar with them, but also each co-variable was statistically controlled.
Our study results are limited by several reasons. First, the subjects could be slightly different from the general population, as only primary care clinic visitors were included in this study. Second, the sleep assessment was subjectively assessed by a self-reported questionnaire. Third, we did not test the interactions between each predictive variable on the multiple logistic regression model, as we performed the analysis with an assumption that each predictive variable was independent. Fourth, we could not estimate any presence of gender difference from the statistical analysis due to relatively small sample size. Finally, this cross-sectional study could not establish a causality between sleep and MetS.
Nevertheless, our study is meaningful, as it presents an association between sleep and MetS in Korea. Further, it takes into account various sleep parameters, including sleep quality and SRBD risk as well as the co-variables affecting sleep patterns or MetS, including stress and depressive mood.
In conclusion, we have found that as poor-quality sleep or SRBD risk increases, or sleep duration decreases or increases, the more frequent MetS becomes, with elevated insulin-resistance resulting from central adiposity being involved in these relationships. Moreover, our results reconfirm that each cardiovascular risk factor constituting MetS is interrelated and therefore acts synergistically.
However, further studies are warranted to generalize our results. If future studies establish the causality between sleep and MetS, and also affirm that various sleep parameters are risk factors for MetS, appropriate sleep management may help prevent MetS development.
Conflict of Interest
The authors declare no conflict of interest.
References
-
Ayas,
N.T.,
White,
D.P.,
Manson,
J.E.,
Stampfer,
M.J.,
Speizer,
F.E.,
Malhotra,
A. &
Hu,
F.B.
(2003) A prospective study of sleep duration and coronary heart disease in women. Arch. Intern. Med., 163, 205-209.
-
Bae,
J.M.,
Jeong,
E.K.,
Yoo,
T.W.,
Huh,
B.Y. &
Kim,
C.H.
(1992) A quick measurement of stress in outpatient clinic setting. J. Korean Acad. Fam. Med., 13, 809-820.
-
Bassett,
J.
;
International Diabetes Institute,
World Health Organization Regional Office for the Western Pacific International,
Association for the Study of Obesity and
the International Obesity Task Force
(2000) The Asia-Pacific perspective : redefining obesity and its treatment, Health Communications Australia, Australia.
-
Björntorp,
P. &
Rosmond,
R.
(2000) The metabolic syndrome: a neuroendocrine disorder? Br. J. Nutr., 83 Suppl 1, S49-57.
-
Bjorvatn,
B.,
Sagen,
I.M.,
Øyane,
N.,
Waage,
S.,
Fetveit,
A.,
Pallesen,
S. &
Ursin,
R.
(2007) The association between sleep duration, body mass index and metabolic measures in the Hordaland Health Study. J. Sleep Res., 16, 66-76.
-
Buysse,
D.J.,
Reynolds,
C.F. 3rd.,
Monk,
T.H.,
Berman,
S.R. &
Kupfer,
D.J.
(1989) The Pittsburgh Sleep Quality Index: a new instrument for psychiatric practice and research. Psychiatry Res., 28, 193-213.
-
Cho,
M.J. &
Kim,
K.H.
(1993) Diagnostic validity of the CES-D (Korean version) in the assessment of DSM-III-R major depression. J. Korean Neuropsychiatr. Assoc., 32, 381-399.
-
Choi,
K.M.,
Lee,
J.S.,
Park,
H.S.,
Baik,
S.H.,
Choi,
D.S. &
Kim,
S.M.
(2008) Relationship between sleep duration and the metabolic syndrome: Korean National Health and Nutrition Survey 2001. Int. J. Obes. (Lond.), 32, 1091-1097.
-
Dolberg,
O.T.,
Hirschmann,
S. &
Grunhaus,
L.
(1998) Melatonin for the treatment of sleep disturbances in major depressive disorder. Am. J. Psychiatry, 155, 1119-1121.
-
Ford,
E.S.,
Giles,
W.H. &
Dietz,
W.H.
(2002) Prevalence of the metabolic syndrome among US adults: findings from the third National Health and Nutrition Examination Survey. JAMA, 287, 356-359.
-
Frank,
S.H. &
Zyzanski,
S.J.
(1988) Stress in the clinical setting: the Brief Encounter Psychosocial Instrument. J. Fam. Pract., 26, 533-539.
-
Gangwisch,
J.E.,
Heymsfield,
S.B.,
Boden-Albala,
B.,
Buijs,
R.M.,
Kreier,
F.,
Pickering,
T.G.,
Rundle,
A.G.,
Zammit,
G.K. &
Malaspina,
D.
(2006) Short sleep duration as a risk factor for hypertension: analyses of the first National Health and Nutrition Examination Survey. Hypertension, 47, 833-839.
-
Gangwisch,
J.E.,
Malaspina,
D.,
Boden-Albala,
B. &
Heymsfield,
S.B.
(2005) Inadequate sleep as a risk factor for obesity: analyses of the NHANES I. Sleep, 28, 1289-1296.
-
Golden,
S.H.,
Folsom,
A.R.,
Coresh,
J.,
Sharrett,
A.R.,
Szklo,
M. &
Brancati,
F.
(2002) Risk factor groupings related to insulin resistance and their synergistic effects on subclinical atherosclerosis: the atherosclerosis risk in communities study. Diabetes, 51, 3069-3076.
-
Grundy,
S.M.,
Cleeman,
J.I.,
Daniels,
S.R.,
Donato,
K.A.,
Eckel,
R.H.,
Franklin,
B.A.,
Gordon,
D.J.,
Krauss,
R.M.,
Savage,
P.J.,
Smith,
S.C. Jr.,
Spertus,
J.A. &
Costa,
F.
(2005) Diagnosis and management of the metabolic syndrome: an American Heart Association/National Heart, Lung, and Blood Institute Scientific Statement. Circulation, 112, 2735-2752.
-
Heslop,
P.,
Smith,
G.D.,
Metcalfe,
C.,
Macleod,
J. &
Hart,
C.
(2002) Sleep duration and mortality: the effect of short or long sleep duration on cardiovascular and all-cause mortality in working men and women. Sleep Med., 3, 305-314.
-
Huh,
B.Y.,
Yim,
J.H.,
Bae,
J.M.,
Choi,
S.S.,
Kim,
S.W. &
Hwang,
H.S.
(1996) The validity of modified Korean-translated BEPSI (Brief Encounter Psychosocial Instrument) as instrument of stress measurement in outpatient clinic. Korean J. Fam. Med., 17, 42-53.
-
Jennings,
J.R.,
Muldoon,
M.F.,
Hall,
M.,
Buysse,
D.J. &
Manuck,
S.B.
(2007) Self-reported sleep quality is associated with the metabolic syndrome. Sleep, 30, 219-223.
-
Kim,
G.D.
(1998) A study on quality of sleep and emotional health status in the elderly, (Master’s thesis), Kyungpook National University, Daegu.
-
Kim,
J.,
In,
K.,
Kim,
J.,
You,
S.,
Kang,
K.,
Shim,
J.,
Lee,
S.,
Lee,
J.,
Lee,
S.,
Park,
C. &
Shin,
C.
(2004) Prevalence of sleep-disordered breathing in middle-aged Korean men and women. Am. J. Respir. Crit. Care Med., 170, 1108-1113.
-
Klein,
B.E.,
Klein,
R. &
Lee,
K.E.
(2002) Components of the metabolic syndrome and risk of cardiovascular disease and diabetes in Beaver Dam. Diabetes Care, 25, 1790-1794.
-
Knutson,
K.L.,
Ryden,
A.M.,
Mander,
B.A. &
Van Cauter,
E.
(2006) Role of sleep duration and quality in the risk and severity of type 2 diabetes mellitus. Arch. Intern. Med., 166, 1768-1774.
-
Korean Ministry of Health and Welfare
(2006) The third Korea National Health and Nutrition Examination Survey (KNHANES-III) 2005, Korean Ministry of Health and Welfare, Seoul.
-
Lee,
S.,
Park,
H.S.,
Kim,
S.M.,
Kwon,
H.S.,
Kim,
D.Y.,
Kim,
D.J.,
Cho,
G.J.,
Han,
J.H.,
Kim,
S.R.,
Park,
C.Y.,
Oh,
S.J.,
Lee,
C.B.,
Kim,
K.S.,
Oh,
S.W.,
Kim,
Y.S.,
Choi,
W.H. &
Yoo,
H.J.
(2006) Cut-off points of waist circumference for defining abdominal obesity in the Korean population. Korean J. Obes., 15, 1-9.
-
Lee,
Y.M.,
Park,
H.S.,
Chun,
B.C. &
Kim,
H.S.
(2002) Reliability of measurements of waist circumference at 3 different site. J. Korean Soc. Study Obes., 11, 123-130.
-
Matthews,
D.R.,
Hosker,
J.P.,
Rudenski,
A.S.,
Naylor,
B.A.,
Treacher,
D.F. &
Turner,
R.C.
(1985) Homeostasis model assessment: insulin resistance and beta-cell function from fasting plasma glucose and insulin concentrations in man. Diabetologia, 28, 412-419.
-
Meigs,
J.B.
(2002) Epidemiology of the metabolic syndrome, 2002. Am. J. Manag. Care, 8, S283-292; quiz S293-296.
-
Narkiewicz,
K.,
van de Borne,
P.J.,
Montano,
N.,
Dyken,
M.E.,
Phillips,
B.G. &
Somers,
V.K.
(1998) Contribution of tonic chemoreflex activation to sympathetic activity and blood pressure in patients with obstructive sleep apnea. Circulation, 97, 943-945.
-
National Cholesterol Education Program (NCEP) Expert Panel on Detection, Evaluation, and Treatment of High Blood Cholesterol in Adults (Adult Treatment Panel III)
(2002) Third Report of the National Cholesterol Education Program (NCEP) Expert Panel on Detection, Evaluation, and Treatment of High Blood Cholesterol in Adults (Adult Treatment Panel III) final report. Circulation, 106, 3143-3421.
-
Park,
H.S.,
Kim,
G.D.,
Kim,
K.H. &
Chung,
B.Y.
(2000) Comparison of quality of sleep and factors which are influenced on sleep among adolescents, adults and elderly. J. Korean Acad. Psychiatr. Ment. Health Nurs., 9, 429-439.
-
Peppard,
P.E.,
Young,
T.,
Palta,
M.,
Dempsey,
J. &
Skatrud,
J.
(2000) Longitudinal study of moderate weight change and sleep-disordered breathing. JAMA, 284, 3015-3021.
-
Phillips,
B.G.,
Hisel,
T.M.,
Kato,
M.,
Pesek,
C.A.,
Dyken,
M.E.,
Narkiewicz,
K. &
Somers,
V.K.
(1999) Recent weight gain in patients with newly diagnosed obstructive sleep apnea. J. Hypertens., 17, 1297-1300.
-
Radloff,
L.S.
(1977) The CES-D scale: a self-report depression scale for research in the general population. Appl. Psychol. Meas., 1, 385-401.
-
Rosmond,
R.
(2005) Role of stress in the pathogenesis of the metabolic syndrome. Psychoneuroendocrinology, 30, 1-10.
-
Sasanabe,
R.,
Banno,
K.,
Otake,
K.,
Hasegawa,
R.,
Usui,
K.,
Morita,
M. &
Shiomi,
T.
(2006) Metabolic syndrome in Japanese patients with obstructive sleep apnea syndrome. Hypertens. Res., 29, 315-322.
-
Shin,
S.C.,
Kim,
M.K.,
Yun,
K.S.,
Kim,
J.H.,
Lee,
M.S.,
Moon,
S.J.,
Lee,
M.J.,
Lee,
H.Y. &
Yoo,
K.J.
(1991) The center for epidemiologic studies-depression scale: its use in Korea. J. Korean Neuropsychiatr. Assoc., 30, 752-767.
-
Spiegel,
K.,
Knutson,
K.,
Leproult,
R.,
Tasali,
E. &
Van Cauter,
E.
(2005) Sleep loss: a novel risk factor for insulin resistance and Type 2 diabetes. J. Appl. Physiol. (1985), 99, 2008-2019.
-
Spiegel,
K.,
Tasali,
E.,
Penev,
P. &
Van Cauter,
E.
(2004) Brief communication: sleep curtailment in healthy young men is associated with decreased leptin levels, elevated ghrelin levels, and increased hunger and appetite. Ann. Intern. Med., 141, 846-850.
-
Taheri,
S.,
Lin,
L.,
Austin,
D.,
Young,
T. &
Mignot,
E.
(2004) Short sleep duration is associated with reduced leptin, elevated ghrelin, and increased body mass index. PLoS Med., 1, e62.
-
Vorona,
R.D.,
Winn,
M.P.,
Babineau,
T.W.,
Eng,
B.P.,
Feldman,
H.R. &
Ware,
J.C.
(2005) Overweight and obese patients in a primary care population report less sleep than patients with a normal body mass index. Arch. Intern. Med., 165, 25-30.