Abstract
Sorafenib, an oral multi-kinase inhibitor, has been approved for treatment of advanced renal-cell and hepatocellular carcinoma (HCC). However, 20% of HCC patients taking sorafenib are forced to withdraw due to adverse effects within one month after administration. Orally administered sorafenib is oxidatively metabolized, predominantly by cytochrome P450 3A4 (CYP3A4), in small-intestinal mucosa or liver. We aimed to characterize the CYP3A4-mediated metabolism of sorafenib in HCC patients and explore the contribution of the major metabolite sorafenib N-oxide to adverse effects and therapeutic efficacy. We have therefore developed a method for quantitative determination of sorafenib and its N-oxide in the present study. To optimize the preanalytical procedure, we initially ascertained the solubility of the analytes. Because they are lipophilic, solvents containing more than 40% acetonitrile were required for efficient recovery. The pretreatment procedure that we ultimately developed consists of acetonitrile precipitation, followed by extraction using octadecyl silyl-silica gel to eliminate water-soluble and hydrophilic components of serum. Application of this procedure before HPLC enabled accurate and reproducible quantitation of analytes in a linear range from 0.03 to 30 μg/mL. After characterizing the peaks in the HPLC-ultraviolet chromatogram obtained from a medicated patient by LC-tandem mass spectrometry, we applied this method to HCC patients taking sorafenib, showing large inter-individual differences in the pharmacokinetic profile. In conclusion, our assay system should be useful for follow-up of patients taking sorafenib and for exploring the association between the pharmacokinetics of sorafenib and its N-oxide and the adverse effects or therapeutic efficacy.
Introduction
Sorafenib is a multi-kinase inhibitor initially developed to target the Raf1 kinase pathway (Smith et al. 2001; Lowinger et al. 2002). However, in addition to the RAF/MEK/ERK pathway, this drug also targets receptor tyrosine kinases such as VEGFR (Vascular endothelial growth factor receptor)-2 and -3, PDGFR (Platelet-derived growth factor receptor)-β, FLT (Fms-like tyrosine kinase)-3, and c-KIT (Wilhelm et al. 2004; Carlomagno et al. 2006; Gollob et al. 2006; Liu et al. 2006). In several clinical and preclinical trials, sorafenib has shown promise as an anti-cancer therapeutic agent that negatively regulates tumor growth, cell proliferation, and angiogenesis (Murphy et al. 2006) and also induces apoptosis in tumor cells via STAT (Signal transducer and activator of transcriptor)-3 (Chen et al. 2010). Sorafenib at 400 mg twice daily (b.i.d.) was initially approved for the treatment of patients with advanced renal-cell carcinoma, and subsequently for that of patients with hepatocellular carcinoma (HCC) judged to be unresectable or unresponsive to transarterial chemoembolization and radiofrequency ablation. Diarrhea, rash, fatigue, hand-foot skin reactions, and hypertension were the most common adverse events associated with sorafenib (Strumberg et al. 2007). Serious adverse effects such as liver failure, hepatic encephalopathy, and pneumonitis also arose in some cases (Ogasawara et al. 2011).
Several factors may contribute to the large inter-individual variability in sorafenib pharmacokinetics. Because sorafenib is administered in a tablet form, its bioavailability is influenced by activity of the excretory transporters ABCB1 and ABCG2 in small-intestinal mucosa (Hu et al. 2009; Gnoth et al. 2010). Sorafenib is metabolized primarily in the small-intestinal mucosa or liver, where it undergoes oxidative metabolism, mediated by cytochrome P450 3A4 (CYP3A4), as well as glucuronidation, mediated by uridine diphosphate glucuronosyl transferase 1A9 (Keating and Santoro 2009; van Erp et al. 2009) (Fig. 1). In clinical practice, sorafenib is frequently used in combination with one or more other drugs, rather than as a sole regimen. CYP3A4 is the most abundant P-450 expressed in the human liver and small intestine. CYP3A4 participates in the metabolism of more than 50% of approved medications that undergo biotransformation (Li et al. 1995).
Therefore, in order to understand the correlation between the pharmacokinetics of sorafenib and its adverse effects or therapeutic efficacy, it is essential to quantitate its principal metabolite, sorafenib N-oxide. Several reports have described quantitation of unchanged sorafenib only (Zhao et al. 2007; Jain et al. 2008; Sparidans et al. 2009; Blanchet et al. 2009; Haouala et al. 2009). A recent report described quantitation of both unchanged sorafenib and a major metabolite, N-oxide, using liquid chromatography-tandem mass spectrometry (LC/MS/MS) (Li et al. 2010).
In this study, we developed a versatile method using a high-performance liquid chromatography-ultraviolet (HPLC-UV) system for quantitative determination of sorafenib and its N-oxide. We successfully applied this method to HCC patients taking sorafenib. By accumulating data on the pharmacokinetics of sorafenib and its N-oxide in HCC patients, we could ascertain the association between the pharmacokinetics and adverse effects or therapeutic efficacy.
Materials and Methods
Chemicals and reagents
Sorafenib (> 98% purity) and sorafenib N-oxide (> 98% purity) were purchased from Toronto Research Chemicals Inc. (Toronto, ONT, Canada), and tolnaftate (internal standard, IS) and liranaftate were purchased from Sigma-Aldrich Co. (St. Louis, MO, USA). All other chemicals were analytical grade, and solvents were HPLC or LC/MS grade.
Equipment and chromatographic conditions
The chromatography system (Agilent 1100) consisted of a pump with degas option, an autosampler, and a UV detector (Agilent Technologies, Inc., Santa Clara, CA, USA). Chromatographic separation was achieved on an Inertsil ODS-3 column (2.1 mm i.d. × 150 mm, 5 μm, GL Science, Inc., Tokyo, Japan) associated with a guard column packed with the same material. The composition of the mobile phase was 20 mM ammonium acetate buffer (pH 4.0)/acetonitrile (30:70, v/v). The flow rate was 200 μL/min throughout the 15-min run. The eluent was monitored at a wavelength of 265 nm.
Stock solutions, standards, and quality controls
Stock solutions containing 100 μg/mL of sorafenib, sorafenib N-oxide, or IS were prepared in acetonitrile and stored at 4°C. Calibration-standard solutions were prepared containing 5 μg/mL IS and 0.03, 0.1, 0.3, 1.0, 3.0, 10.0, and 30 μg/mL sorafenib or sorafenib N-oxide. Quality-control (QC) samples were prepared in serum from healthy volunteers, who were not undergoing treatment with sorafenib, at 0.1, 1.0, and 10.0 μg/mL.
Sample preparation
First, 200 μL of IS solution (5 μg/mL) was added to 200 μL of serum in a glass tube. After mixing for 10 s, the tube was centrifuged at 1,580 g for 10 min. An aliquot (300 μL) of the supernatant was transferred into a plastic tube (1.5 mL) containing 75 μL of deionized purified water. Next, 250 μL of the resulting solution was applied to a Bond Elut C18 (100 mg/1 mL, Agilent Technologies, Inc.), which was washed with 600 μL of 40% acetonitrile. The analytes were eluted with 1,000 μL of acetonitrile. The eluate was evaporated to dryness under a nitrogen gas stream. The residue was reconstituted in 100 μL of 20 mM ammonium acetate buffer (pH 4.0)/acetonitrile (30:70, v/v), and an aliquot (5 µL) was analyzed by HPLC.
Validation procedures
Complete calibration curves were prepared by plotting the peak area ratio of analytes to IS at seven points, as previously noted, and linearity was assessed by the linear-square method.
Intra- and inter-day accuracy and precision were evaluated at 0.1, 1.0, and 10 μg/mL. For the intra-day experiment, five replicates of each QC concentration were assayed in one run. For the inter-day experiment, each QC concentration was assayed on five different days. Accuracy was evaluated by calculating the bias, determined as [(measured concentration − theoretical concentration)/(theoretical concentration)] × 100 (%). Precision was evaluated as the coefficient of validation (CV). Acceptance criteria for accuracy and precision were bias within ± 15% and CV lower than 15%. The limit of quantitation was defined as 0.03 µg/mL, the concentration of sorafenib and sorafenib N-oxide that could be determined with acceptable accuracy and precision (< 20% for each criterion). The signal-to-noise ratios (S/N) of 0.03 µg/mL sorafenib and sorafenib N-oxide spiked into human serum were 18 and 20, respectively.
Recovery
Recoveries of sorafenib, sorafenib N-oxide, and IS were evaluated at concentrations corresponding to those of the QC samples (0.1, 1.0, and 10 μg/mL). Each QC sample was loaded onto the Bond Elut C18 cartridge column. After washing with 40% acetonitrile, the eluates were collected and evaporated under a nitrogen gas stream, and then mixed with 100 μL of mobile phase containing liranaftate (1 μg) as an internal standard; 5 μL was injected into the HPLC system. Recovery after solid-phase extraction was determined by comparing the ratio of the peak area of each analyte to that of liranaftate in extracted serum with that of an identical concentration of sorafenib, sorafenib N-oxide, or IS prepared in the mobile phase without extraction. The analysis was carried out on three samples for each concentration.
Stability
Stock solutions of sorafenib, sorafenib N-oxide, and IS were stored at 4°C. Freeze-thaw, short-term, autosampler, and long-term stabilities were evaluated by monitoring the difference between observed and theoretical concentrations. Freeze-thaw stabilities of sorafenib and sorafenib N-oxide were determined by assaying the three QC concentrations in triplicate over three freeze-thaw cycles. The stability of sorafenib in serum was also evaluated by assaying in triplicate the concentrations of the three routine QC samples after 3 months of storage at −80°C. Sorafenib, sorafenib N-oxide, and IS stabilities after extraction were evaluated by keeping triplicates of the three extracted QC samples in the autosampler at 4°C for 24 h. For all stability studies, the solution was considered stable if the concentration did not differ from the reference concentration by more than 15%.
Sorafenib therapeutic drug monitoring
All human blood samples were collected in non-coated blood-collection tubes after healthy volunteers and patients provided written informed consent, according to the protocol adopted by the institutional review board of the Graduate School of Medicine at Tohoku University. Firstly, the method was applied to determine the serum trough concentrations of sorafenib and sorafenib N-oxide at steady state in an HCC patient taking sorafenib. Subsequently, blood samples of four patients collected at 0, 2, 6, and 10 or 12 h after the first administration (8:00 am) during a hospital stay. After separation of serum, we performed analysis of sorafenib and sorafenib N-oxide concentrations immediately.
LC/MS conditions for identification of sorafenib metabolites
LC/MS was performed using an LCMS-IT-TOF mass spectrometer coupled with a Prominence LC system (Shimadzu Corp., Kyoto, Japan). The LC/MS conditions were as follows: Column, Inertsil ODS-3 (2.1 mm i.d. × 150 mm, 5 µm); mobile phase, 20 mM ammonium acetate buffer (pH 4.0)/acetonitrile (3:7, v/v); flow rate, 200 µL/min; injection volume, 10 µL; nebulizer gas, 1.5 L/min; CDL temperature, 200°C, heat block temperature, 200°C; and detector voltage, 1.67 kV.
Results
Because sorafenib and sorafenib N-oxide are lipophilic and barely soluble in water, their insolubility may impair their recovery during preanalytical sample processing. Therefore, we first examined the solubility of sorafenib, sorafenib N-oxide, and IS in solutions containing various concentrations of acetonitrile. The solubilities of sorafenib, sorafenib N-oxide, and IS decreased at acetonitrile concentrations below 40% (v/v), as shown in Fig. 2, suggesting that solutions containing more than 40% (v/v) acetonitrile should be used throughout the pretreatment workflow for sorafenib and sorafenib N-oxide assays. We next examined the UV spectra of sorafenib and sorafenib N-oxide using an SPD-M20A photodiode array detector (Shimadzu, Corp.). Maximal absorptions of sorafenib and sorafenib N-oxide were observed at 265 nm in the mobile phase; therefore, we set the detection wavelength at 265 nm (data not shown). In previous reports using HPLC, protein precipitation was the only pretreatment step employed before injection into the analytical system (Blanchet et al. 2009). However, in blank serum we observed a peak corresponding to the retention time of sorafenib and the N-oxide (Fig. 3B). Therefore, it was necessary to eliminate the serum components responsible for these background peaks. To this end, we optimized a protocol using a solid-phase extraction step in conjunction with reversed-phase liquid chromatography. After loading sorafenib and sorafenib N-oxide onto a Bond Elut C18 solid-phase extraction column, we compared the results of washing with acetonitrile concentrations of 40% (v/v) and 50% (v/v) (Fig. 4A and B). With 50% (v/v) acetonitrile, ~100% of sorafenib N-oxide was eluted by the second fraction, and ~90% of sorafenib was eluted in the second and third fractions (Fig. 4B). By contrast, with 40% acetonitrile, elution of sorafenib and sorafenib N-oxide were not observed by the second fraction (Fig. 4A). When we washed the column with more than 600 µL of 40% (v/v) acetonitrile, we detected sorafenib in the wash fraction (Fig. 4C). Therefore, analytes and IS were retained on the Bond Elut C18 solid-phase extraction column after washing with 600 µL of 40% (v/v) acetonitrile. Consequently, columns were washed with 600 µL of 40% (v/v) acetonitrile to remove water-soluble and hydrophilic materials. When sorafenib and sorafenib N-oxide were loaded onto a Bond Elut C18 solid-phase extraction column, and the column was washed with 600 μL of 40% (v/v) acetonitrile, ~100% of analytes containing IS were recovered following elution with 1 mL of 100% acetonitrile (data not shown). After deproteinization following ODS extraction, we did not observe the aforementioned peaks in blank serum (Fig. 3C). In addition, we determined the absolute recovery of sorafenib and sorafenib N-oxide for all steps, from protein precipitation to ODS extraction and evaporation with nitrogen gas, using liranaftate as an IS as described in Materials and Methods. The absolute recoveries were as follows: at 0.1 μg/mL, 105.7 ± 4.0% (sorafenib) and 93.4 ± 1.0% (sorafenib N-oxide); at 1.0 µg/mL, 92.9 ± 1.5% (sorafenib) and 96.8 ± 4.7% (sorafenib N-oxide); at 10 µg/mL, 95.5 ± 1.0% (sorafenib) and 95.9 ± 1.3% (sorafenib N-oxide); and at 100 µg/mL, 100.8 ± 0.051% (tolnaftate).
The relative recoveries of sorafenib and sorafenib N-oxide, using tolnaftate as an IS, were nearly 100% (n = 6). We injected samples processed in this way into the HPLC- UV system, and monitored absorbance at 265 nm in order to quantitatively determine the concentrations of sorafenib and sorafenib N-oxide in human serum.
For linearity assessment, the best weighting factor was 1/(peak area ratio), because the variance grew proportionally to the concentration. The six standard curves were linear over a concentration range of 0.03-30 μg/ml. The correlation coefficients of all linear-regression lines ranged from 0.998 to 1.000.
Intra- and inter-assay precision and accuracy are reported in Table 1. At all concentrations, intra- and inter-assay precision was lower than 3.8% for sorafenib and 9.3% for sorafenib N-oxide. The intra- and inter-assay accuracy ranged from −7.6 to 5.8% for sorafenib and −6.9 to −3.3% for sorafenib N-oxide. The QC samples at the lowest concentration were set at 0.10 μg/mL (CV = 3.8%).
The stock solutions of sorafenib, sorafenib N-oxide, and IS at 4°C were comparable to freshly made solutions. The biases for freeze-thaw stability were lower than 8%. QC samples stored in a freezer at −80°C remained stable for at least 3 months (Table 2).
We initially analyzed the serum trough concentration of sorafenib and sorafenib N-oxide in a patient (male, 53 years) 15 days after he was treated with the recommended daily dose (400 mg b.i.d.) of sorafenib. We obtained five peaks containing sorafenib and sorafenib N-oxide, as shown in the UV chromatogram (Fig. 5A), which were not present in the serum prior to the treatment. To determine whether the peaks represented sorafenib or sorafenib metabolites, we used an ion trap/time-of-flight hybrid mass spectrometer operated in positive-ion mode. The total ion current chromatogram of the patient’s serum, extracted by sequential protein precipitation and Bond Elut C18 treatment, exhibited several peaks around the retention times corresponding to the five peaks including sorafenib and its N-oxide in the HPLC-UV chromatogram (Fig. 5B). Sorafenib is converted to eight metabolites, as shown in Fig. 1. The sites of metabolism are limited to N-methyl-pyridine-2-carboxamide moiety; therefore, both mass change and product ion spectrum pattern aid in identification of the metabolite structures observed in the HPLC chromatogram. When we examined extracted ion chromatograms at the m/z of each protonated molecule except for glucuronides (m/z 451, m/z 452, m/z 465, m/z 467, m/z 481, m/z 497), we observed several peaks in four chromatograms, as shown in Fig. 5E.
In order to extrapolate the structures of these compounds, we compared their product ion spectra with those of authentic sorafenib and its N-oxide. In the product ion spectrum of authentic sorafenib, using the protonated molecule at m/z 465 as a precursor ion, we found three product ions: at m/z 406, representing neutral loss of N-methylformamide (59 Da); at m/z 270, representing neutral loss of 4-chloro-3-(trifluoromethyl)phenylamine (195 Da); and at m/z 211, representing neutral losses of both N-methylformamide and 4-chloro-3-(trifluoromethyl)phenylamine (Fig. 5C) (Sparidans et al. 2009). On the other hand, the authentic specimen of sorafenib N-oxide yielded an intensely protonated molecule at m/z 481.1 in ESI. In the product ion spectrum of authentic sorafenib N-oxide, using the protonated molecule at m/z 481 as a precursor ion, we found three signature peaks at m/z 406, m/z 286, and m/z 211 (Fig. 5D).
In the extracted ion chromatogram at m/z 481.1 (Fig. 5E), there are two barely distinguishable peaks at retention times of 3.3 and 3.6 min. There is little difference between the product ion spectra of these two peaks; therefore, it is difficult to distinguish both compounds using only their product ion spectra. Because the retention time of the authentic sorafenib N-oxide was 3.3 min (data not shown), we determined that the former peak represented sorafenib N-oxide, M-2, and the latter peak represented the monohydroxylated metabolite, M-3, which has exactly the same mass as sorafenib N-oxide. The accurate mass of the product ion of the former peak at m/z 286, which includes a metabolism site, was 286.0824, very close to the theoretically predicted mass (286.0828, −0.4 mDa). On the other hand, the accurate mass of the latter peak was 286.0820, corresponding to a difference of −0.8 mDa relative to the theoretical value, suggesting that the elemental composition of both product ions was C14H12N3O4.
In the extracted ion chromatogram at m/z 451.1, we found a single clear peak at a retention time of 4.1 min (Fig. 5E). The mass difference of this metabolite relative to unchanged sorafenib is 14 Da, suggesting that it may be the desmethylated metabolite M-4. The signature product ion is a peak at m/z 256, which is produced by neutral loss of 4-chloro-3-(trifluoromethyl)phenylamine and includes a metabolism site at the side-chain terminus of pyridine. Its accurate mass was 256.0695, very close to the theoretical mass (256.0722, −2.7 mDa). This result indicated that the elemental composition of this product ion was C13H10N3O3. There are two peaks in the extracted ion chromatogram at m/z 467.1, and the peak at retention time of 5.2 min is due to the isotopic peak of unchanged sorafenib (Fig. 5E). The peak at retention time of 2.7 min yielded a base peak at m/z 467.1, corresponding to M-5, which is the N-oxide of the desmethylated metabolite. The accurate mass of the product ion at m/z 272 was 272.0675, very close to the theoretical mass (272.0671, 0.4 mDa). Taken together, these results suggest that three metabolites, M-3, M-4, and M-5, in addition to sorafenib and M-2 (sorafenib N-oxide), could be identified in the HPLC-UV chromatogram from the patient’s serum (Table 3). Our observation that sorafenib metabolites M-2, M-3, M-4, and M-5 appeared at steady state after sorafenib administration was consistent with the results of a clinical trial described in the document “Outline of Common Technical Document” from Bayer Aktiengesellschaft.
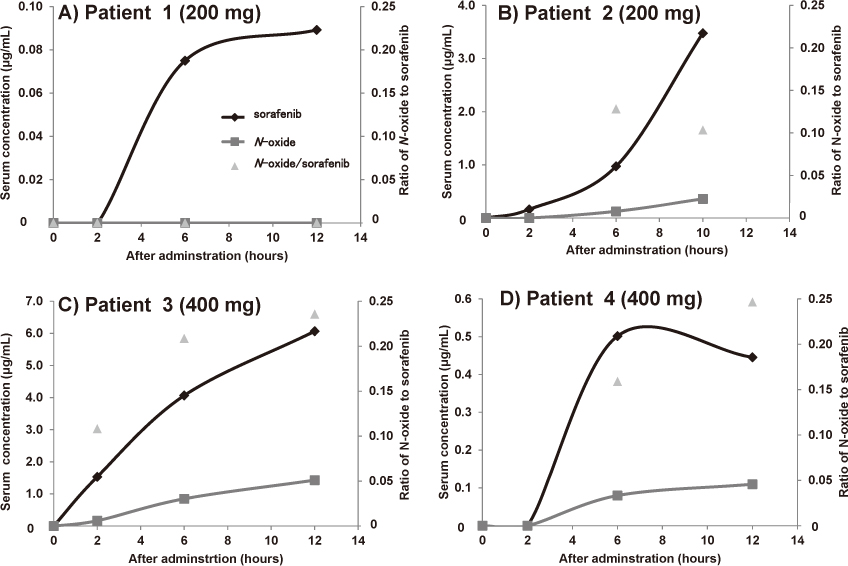
After identifying peaks of sorafenib and sorafenib N-oxide in the HPLC-UV chromatogram using LC/MS/MS, we determined that the Ctrough values of sorafenib and sorafenib N-oxide were 4.0 and 0.25 μg/mL, respectively. Furthermore, we analyzed the serum concentration of sorafenib and sorafenib N-oxide in four HCC patients [Patient 1: male, 69 years, hepatitis virus (C); Patient 2: male, 69 years, hepatitis virus (C); Patient 3: female, 79 years, hepatitis virus (−); Patient 4: female, 69 years, hepatitis virus (C)] after the first administration of 200 or 400 mg sorafenib. We observed interindividual difference in the pharmacokinetic profile of sorafenib and a greater than 10-fold difference in the serum concentration of sorafenib and its N-oxide 6 h after administration (Fig. 6A vs. 6B, Fig. 6C vs. 6D), despite the fact that the same dosages were used. Furthermore, over the entire examined range, the ratio of the concentrations of sorafenib and sorafenib N-oxide was between 0 and 0.25.

Discussion
To date, many reports have described the quantitation of sorafenib in human serum by HPLC/UV (Blanchet et al. 2009) or LC/MS/MS (Zhao et al. 2007; Jain et al. 2008; Haouala et al. 2009; Li et al. 2010). The monitoring of serum concentration of unchanged sorafenib alone can certainly provide some helpful information regarding HCC patients taking sorafenib. However, if we can also know the serum concentration of sorafenib N-oxide, we can obtain more beneficial information, e.g., regarding individual variations in CYP3A4 function and drug-drug interactions based on CYP3A4. These types of information might be very useful in preventing serious adverse effects in patients taking sorafenib. Therefore, we developed an assay method for the quantitative determination of sorafenib and sorafenib N-oxide using a versatile HPLC-UV system.
In order to develop a high-quality method for determining sorafenib and sorafenib N-oxide concentrations in human serum, we optimized the preanalytical process for the HPLC-UV method in order to eliminate contaminants that might interfere with quantitation. After determining analyte solubility, we optimized conditions for desalting and elimination of water-soluble compounds. The method that we developed exhibits excellent quantitative performance, such as sensitivity and linear range, comparable to those of other approaches using LC/MS/MS (Zhao et al. 2007; Jain et al. 2008; Haouala et al. 2009; Li et al. 2010). Using LC/MS/MS, we initially analyzed five peaks in the HPLC-UV chromatogram of serum from a patient who had received the recommended daily dose (400 mg b.i.d.) of sorafenib; these five peaks represented sorafenib and its metabolites. Subsequently, we determined the Ctrough values of sorafenib and sorafenib N-oxide in the patient using the HPLC-UV method. The Ctrough we determined for sorafenib was close to a previously reported value (Zhao et al. 2007; Jain et al. 2008; Blanchet et al. 2009; Haouala et al. 2009; Li et al. 2010), whereas that of sorafenib N-oxide was not (Li et al. 2010). The difference may have been caused by an individual variation in CYP3A4 function.
Furthermore, we determined the concentrations of sorafenib and sorafenib N-oxide in four patients following the first administration of sorafenib (200 or 400 mg), and observed inter-individual difference in patients who had received the same dosage of sorafenib. Further, the profile of sorafenib (400 mg) differed from previously reported profiles (Li et al. 2010). These discrepancies may be due to changes in pharmacokinetics caused by concomitantly administered drugs, medication timing, content of meals, or progression of diseases such as hepatitis and cirrhosis, but the details are currently unknown.
Because it is capable of automatically sensing individual CYP3A4 activity in a single run, the assay system we developed could be adapted to ascertain individual differences in CYP3A4 activity caused by progression of hepatic disease or drug-drug interactions.
In conclusion, our assay system should be useful in clinical practice for follow-up of patients taking sorafenib. Moreover, the system should be useful in future studies aimed at determining the association between the pharmacokinetics of sorafenib and its N-oxide and the adverse effects or therapeutic efficacy.
Acknowledgments
This work was supported in part by KAKENHI (Grant-in-Aid for Scientific Research (C) 22590132).
Conflict of Interest
The authors declare no conflict of interest.
References
-
Blanchet,
B.,
Billemont,
B.,
Cramard,
J.,
Benichou,
A.S.,
Chhun,
S.,
Harcouet,
L.,
Ropert,
S.,
Dauphin,
A.,
Goldwasser,
F. &
Tod,
M.
(2009) Validation of an HPLC-UV method for sorafenib determination in human plasma and application to cancer patients in routine clinical practice. J. Pharm. Biomed. Anal., 49, 1109-1114.
-
Carlomagno,
F.,
Anaganti,
S.,
Guida,
T.,
Salvatore,
G.,
Troncone,
G.,
Wilhelm,
S.M. &
Santoro,
M.
(2006) BAY 43-9006 inhibition of oncogenic RET mutants. J. Natl. Cancer Inst., 98, 326-334.
-
Chen,
K.F.,
Tai,
W.T.,
Liu,
T.H.,
Huang,
H.P.,
Lin,
Y.C.,
Shiau,
C.W.,
Li,
P.K.,
Chen,
P.J. &
Cheng,
A.L.
(2010) Sorafenib overcomes TRAIL resistance of hepatocellular carcinoma cells through the inhibition of STAT3. Clin. Cancer Res., 16, 5189-5199.
-
Gnoth,
M.J.,
Sandmann,
S.,
Engel,
K. &
Radtke,
M.
(2010) In vitro to in vivo comparison of the substrate characteristics of sorafenib tosylate toward P-glycoprotein. Drug Metab. Dispos., 38, 1341-1346.
-
Gollob,
J.A.,
Wilhelm,
S.,
Carter,
C. &
Kelley,
S.L.
(2006) Role of Raf kinase in cancer: therapeutic potential of targeting the Raf/MEK/ERK signal transduction pathway. Semin. Oncol., 33, 392-406.
-
Haouala,
A.,
Zanolari,
B.,
Rochat,
B.,
Montemurro,
M.,
Zaman,
K.,
Duchosal,
M.A.,
Ris,
H.B.,
Leyvraz,
S.,
Widmer,
N. &
Decosterd,
L.A.
(2009) Therapeutic Drug Monitoring of the new targeted anticancer agents imatinib, nilotinib, dasatinib, sunitinib, sorafenib and lapatinib by LC tandem mass spectrometry. J. Chromatogr. B Analyt. Technol. Biomed. Life Sci., 877, 1982-1996.
-
Hu,
S.,
Chen,
Z.,
Franke,
R.,
Orwick,
S.,
Zhao,
M.,
Rudek,
M.A.,
Sparreboom,
A. &
Baker,
S.D.
(2009) Interaction of the multikinase inhibitors sorafenib and sunitinib with solute carriers and ATP-binding cassette transporters. Clin. Cancer Res., 15, 6062-6069.
-
Jain,
L.,
Gardner,
E.R.,
Venitz,
J.,
Dahut,
W. &
Figg,
W.D.
(2008) Development of a rapid and sensitive LC-MS/MS assay for the determination of sorafenib in human plasma. J. Pharm. Biomed. Anal., 46, 362-367.
-
Keating,
G.M. &
Santoro,
A.
(2009) Sorafenib: a review of its use in advanced hepatocellular carcinoma. Drugs, 69, 223-240.
-
Li,
A.P.,
Kaminski,
D.L. &
Rasmussen,
A.
(1995) Substrates of human hepatic cytochrome P450 3A4. Toxicology, 104, 1-8.
-
Li,
L.,
Zhao,
M.,
Navid,
F.,
Pratz,
K.,
Smith,
B.D.,
Rudek,
M.A. &
Baker,
S.D.
(2010) Quantitation of sorafenib and its active metabolite sorafenib N-oxide in human plasma by liquid chromatography-tandem mass spectrometry. J. Chromatogr. B Analyt. Technol. Biomed. Life Sci., 878, 3033-3038.
-
Liu,
L.,
Cao,
Y.,
Chen,
C.,
Zhang,
X.,
McNabola,
A.,
Wilkie,
D.,
Wilhelm,
S.,
Lynch,
M. &
Carter,
C.
(2006) Sorafenib blocks the RAF/MEK/ERK pathway, inhibits tumor angiogenesis, and induces tumor cell apoptosis in hepatocellular carcinoma model PLC/PRF/5. Cancer Res., 66, 11851-11858.
-
Lowinger,
T.B.,
Riedl,
B.,
Dumas,
J. &
Smith,
R.A.
(2002) Design and discovery of small molecules targeting raf-1 kinase. Curr. Pharm. Des., 8, 2269-2278.
-
Murphy,
D.A.,
Makonnen,
S.,
Lassoued,
W.,
Feldman,
M.D.,
Carter,
C. &
Lee,
W.M.
(2006) Inhibition of tumor endothelial ERK activation, angiogenesis, and tumor growth by sorafenib (BAY43-9006). Am. J. Pathol., 169, 1875-1885.
-
Ogasawara,
S.,
Kanai,
F.,
Obi,
S.,
Sato,
S.,
Yamaguchi,
T.,
Azemoto,
R.,
Mizumoto,
H.,
Koushima,
Y.,
Morimoto,
N.,
Hirata,
N.,
Toriyabe,
T.,
Shinozaki,
Y.,
Ooka,
Y.,
Mikata,
R.,
Chiba,
T., et al.
(2011) Safety and tolerance of sorafenib in Japanese patients with advanced hepatocellular carcinoma. Hepatol. Int., 5, 850-856.
-
Smith,
R.A.,
Barbosa,
J.,
Blum,
C.L.,
Bobko,
M.A.,
Caringal,
Y.V.,
Dally,
R.,
Johnson,
J.S.,
Katz,
M.E.,
Kennure,
N.,
Kingery-Wood,
J.,
Lee,
W.,
Lowinger,
T.B.,
Lyons,
J.,
Marsh,
V.,
Rogers,
D.H., et al.
(2001) Discovery of heterocyclic ureas as a new class of raf kinase inhibitors: identification of a second generation lead by a combinatorial chemistry approach. Bioorg. Med. Chem. Lett., 11, 2775-2778.
-
Sparidans,
R.W.,
Vlaming,
M.L.,
Lagas,
J.S.,
Schinkel,
A.H.,
Schellens,
J.H. &
Beijnen,
J.H.
(2009) Liquid chromatography-tandem mass spectrometric assay for sorafenib and sorafenib-glucuronide in mouse plasma and liver homogenate and identification of the glucuronide metabolite. J. Chromatogr. B Analyt. Technol. Biomed. Life Sci., 877, 269-276.
-
Strumberg,
D.,
Clark,
J.W.,
Awada,
A.,
Moore,
M.J.,
Richly,
H.,
Hendlisz,
A.,
Hirte,
H.W.,
Eder,
J.P.,
Lenz,
H.J. &
Schwartz,
B.
(2007) Safety, pharmacokinetics, and preliminary antitumor activity of sorafenib: a review of four phase I trials in patients with advanced refractory solid tumors. Oncologist, 12, 426-437.
-
van Erp,
N.P.,
Gelderblom,
H. &
Guchelaar,
H.J.
(2009) Clinical pharmacokinetics of tyrosine kinase inhibitors. Cancer Treat. Rev., 35, 692-706.
-
Wilhelm,
S.M.,
Carter,
C.,
Tang,
L.,
Wilkie,
D.,
McNabola,
A.,
Rong,
H.,
Chen,
C.,
Zhang,
X.,
Vincent,
P.,
McHugh,
M.,
Cao,
Y.,
Shujath,
J.,
Gawlak,
S.,
Eveleigh,
D.,
Rowley,
B., et al.
(2004) BAY 43-9006 exhibits broad spectrum oral antitumor activity and targets the RAF/MEK/ERK pathway and receptor tyrosine kinases involved in tumor progression and angiogenesis. Cancer Res., 64, 7099-7109.
-
Zhao,
M.,
Rudek,
M.A.,
He,
P.,
Hafner,
F.T.,
Radtke,
M.,
Wright,
J.J.,
Smith,
B.D.,
Messersmith,
W.A.,
Hidalgo,
M. &
Baker,
S.D.
(2007) A rapid and sensitive method for determination of sorafenib in human plasma using a liquid chromatography/tandem mass spectrometry assay. J. Chromatogr. B Analyt. Technol. Biomed. Life Sci., 846, 1-7.