Abstract
The inverse relationship between 25-hydroxyvitamin D [25(OH)D] status and insulin resistance (IR) has been reported, but many interventional studies failed to reduce IR with 25(OH)D supplementation. In addition, there has been a paucity of literature on the interaction between 25(OH)D status and IR according to the degree of obesity in Asian subjects. We therefore evaluated the association between 25(OH)D status and IR according to the degree of obesity. Data from the Korea National Health and Nutrition Examination Survey in 2008-2010 were analyzed. The study subjects comprised 10,629 participants aged ≥ 20 years with fasting glucose < 100 mg/dL. IR was estimated by the homeostasis model assessment (HOMA). We found an inverse linear association between 25(OH)D and loge(HOMA-IR) in multiple linear regression analysis; namely, 10 ng/mL increase of 25(OH)D was associated with 0.018 decrease of loge(HOMA-IR) (p < 0.0001). In the subgroup analysis, we identified a distinct trend that the inverse linear association between 25(OH)D and loge(HOMA-IR) became more prominent with the progression of body mass index, waist circumference, or fat mass quartile (Q): −0.009, −0.004, −0.029 and −0.037 in Q1-Q4 of body mass index, −0.004, −0.014, −0.02 and −0.038 in Q1-Q4 of waist circumference, and −0.002, −0.001, −0.017 and −0.025 in Q1-Q4 of fat mass. Thus, the IR-lowering effect of 25(OH)D became more evident with the progression of obesity in an adult Korean population without increased fasting glucose levels. We suggest that proper supplementation of vitamin D might be beneficial in obese Korean adults.
Introduction
Insulin resistance (IR) is an independent risk factor for coronary heart disease or all-cause mortality in a non-diabetic population (Despres et al. 1996; Ausk et al. 2010), and is a significant cardiovascular risk factor even in populations without increased fasting glucose levels (Onat et al. 2006; Yildir et al. 2013). Thus, intervention targeting its modifiable risk factors has important clinical significance. In this respect, vitamin D, which has a pleiotropic effect on osteoporosis, cancer, metabolic syndrome and cardiovascular disease (Holick 2007), may be a potential therapeutic target since substantial experimental evidence consistently shows the beneficial role of vitamin D in the development or progression of IR (Tai et al. 2008; Teegarden and Donkin 2009). Nevertheless, the evidence from randomized controlled trials has showed a causal relationship between vitamin D supplementation and amelioration of IR only in a limited population (Belenchia et al. 2013; Pilz et al. 2013). This suggests that a meticulous candidate selection for vitamin D supplementation is required for better outcome.
Obesity is a risk factor for IR (Ford et al. 2002; Kahn et al. 2006; Samuel and Shulman 2012) and vitamin D insufficiency (Hypponen and Power 2006; Earthman et al. 2012). There is some evidence that obesity may modify the ability of vitamin D to improve IR (Ou et al. 2011; Kabadi et al. 2012; Belenchia et al. 2013). Thus, a stratified approach tied to the degree of obesity might be beneficial in IR reduction with supplemental vitamin D. In Asia, the prevalence of obesity and vitamin D insufficiency is very high (Chan et al. 2009; Mithal et al. 2009). However, little is known about the link among vitamin D, IR, and obesity in an adult Asian population. Moreover, no studies have explored the associations between vitamin D, IR, and obesity in population without increased fasting glucose levels. Therefore, we tried to illustrate the differential effects of obesity on the association between vitamin D and IR, as assessed by the homeostasis model assessment (HOMA) in an adult Korean population without increased fasting glucose levels. The study used data from the Korea National Health and Nutrition Examination Survey (KNHANES), a nationwide, government-administered survey.
Methods
Study population
KNHANES is a cross-sectional and nationally representative survey of the health and nutritional statuses of the civilian, non-institutionalized, Korean population. KNHANES is composed of a health-questionnaire survey, a health examination, and a nutrition survey. We used the data from the participants of the 2008-2010 KNHANES, who were chosen from the candidates by using proportional allocation-systematic sampling with multi-stage stratification (age, sex, and region). Individual who responded to the health-questionnaire survey were asked to visit the mobile examination center (MEC) for a health examination, which included blood and urine sampling. The participation rate of at least one out of the three surveys was 77.8% (9,744/12,528), 82.8% (10,533/12,722) and 81.9% (8,958/10,938) in 2008-2010, respectively. Among the 29,235 participants, 10,629 were included for the analysis. The following individuals were excluded: age < 20 years (n = 7,664), fasting time < 8 hours (n = 560), estimated glomerular filtration rate (eGFR) < 30 mL/min/1.73 m2 (n = 41), elevated fasting glucose (n = 5,293) and missing data of fasting insulin and glucose, serum creatinine, 25-hydroxyvitamin D [25(OH)D] and fat mass (n = 5,102). This investigation was conducted according to the principles expressed in the Declaration of Helsinki. All subjects participated voluntarily and signed informed consent forms. The institutional review board at the Korea Centers for Disease Control and Prevention (KCDC) approved the consent procedure and the survey of the study population (2008-04EXP-01-C, 2009-01CON-03-2C, and 2010-02CON-21-C). The current study was also approved by KCDC.
Measurements
During the MEC examination, a venous blood sample was drawn after an overnight fast. The sample was refrigerated and transported to the central laboratory (Neodin Medical Institute) within 24 hours. Using a Hitachi Automatic Analyzer 7600 (Hitachi, Tokyo, Japan), fasting glucose, high-density lipoprotein cholesterol (HDL-C), and triglyceride (TG) were measured by enzymatic methods (Hexokinase UV for fasting glucose; Selective inhibition for HDL-C and TG) and serum creatinine was measured by a rate-blanked and compensated kinetic alkaline picrate Jaffe reaction. With a 1470 WIZARD gamma-Counter (PerkinElmer, Turku, Finland), fasting insulin and 25(OH)D were measured by radioimmunoassay. To estimate the glomerular filtration rate (GFR), we used the Chronic Kidney Disease Epidemiology Collaboration equation (Levey et al. 2009), which was recently developed for the general population. The equation was applicable because our population was generally healthy. To estimate IR, we used HOMA as determined by the following equation: HOMA-IR = fasting insulin (μIU/mL) × fasting glucose (mmol/L)/22.5 (Matthews et al. 1985).
Three readings of blood pressure (BP) were obtained, and the final BP for individual participants was reported by calculating the mean of the second and third readings. Waist circumference (WC) in cm was measured at the midpoint between the inferior margin of the last rib and the crest of the ilium. Height in cm was reported by measuring the maximum distance from the floor to the highest point on the head with occiput, heels, and buttocks all in contact with the wall. Weight in kg was measured after zero-point. Body mass index (BMI) was calculated as (weight in kg)/(height in m)2. Fat mass (kg) was measured by dual-energy X-ray absorptiometry, starting in July 2008.
Definition of variables related to metabolic syndrome (MS)
MS was defined by at least three positive findings of the following five components in accordance with global standards (Grundy et al. 2005; Alberti et al. 2006); increased fasting glucose, elevated BP, elevated TG, reduced HDL-C, and abdominal obesity. Increased fasting glucose was defined as fasting glucose ≥ 100 mg/dL, current drug treatment for elevated glucose, or diagnosis of diabetes. Elevated BP was defined as systolic BP ≥ 130 mmHg, diastolic BP ≥ 85 mmHg or anti-hypertensive medication use. Reduced HDL-C was defined as participants whose serum HDL-C level was < 40 mg/dL in men, or < 50 mg/dL in women. Elevated TG was defined as serum TG ≥ 150 mg/dL or following a course of medication to decrease blood cholesterol level at the time of interview. Abdominal obesity was defined as participants whose WC was ≥ 90 cm in men and ≥ 80 cm in women.
Definition of other variables
An urban region was defined as the central districts in seven metropolitan areas. Regular exercise was defined as doing breathless, sweaty, and exhausting exercise for ≥ 20 minutes/day and ≥ 3 times/week. Current smoking referred to those participants who had smoked at least 100 cigarettes in their lifetimes and who continued to smoke presently. Alcohol drinking was defined as having seven drinks (five for women) of alcohol within one month during the previous year.
Statistical analysis
Baseline characteristics were presented as frequencies and percentages for categorical variables, mean ± s.d. for continuous variables, or median (25% and 75% interquartile range) for non-normally distributed variables. Natural logarithmic transformations were applied to normalize the distributions of two positively skewed variables: HOMA-IR and TG. To assess the association between HOMA-IR and serum 25(OH)D, we applied simple and multiple linear regression analyses. To examine the segmented simple relationships with break-points, we fitted segmented linear regressions of loge(HOMA-IR) and serum 25(OH)D (Muggeo 2003). Additionally, a locally weighted scatterplot smoothing (Lowess) curve was adapted in the scatter plot to show the correlation differently. To investigate whether the strength of 25(OH)D’s association with loge(HOMA-IR) differed by the degree of BMI, WC, and fat mass, we also performed regression analysis in subgroups stratified by quartiles of BMI, WC, and fat mass, respectively. Stratification was based on sex-specific quartiles of BMI, WC, and fat mass, because the quartiles of BMI, WC, and fat mass differed in men and women considerably. For the multiple regression model, we added the following variables for adjustment: age (continuous), sex, urban region (binary), college graduate (binary), current smoking (binary), alcohol drinking (binary), regular exercise (binary), elevated BP (binary), TG (continuous), HDL-C (continuous), fasting glucose (continuous), eGFR (continuous), and year of sampling (categorical). All the continuous covariates were centered at the mean of each variable, except for TG, where the geometric mean was used instead. All statistical analyses were performed using SAS version 9.2 (SAS Institute, Cary, NC, USA) and R statistical language (Version R 2.15.1, The Comprehensive R Archive Network: http://cran.r-project.org).
Results
Baseline characteristics
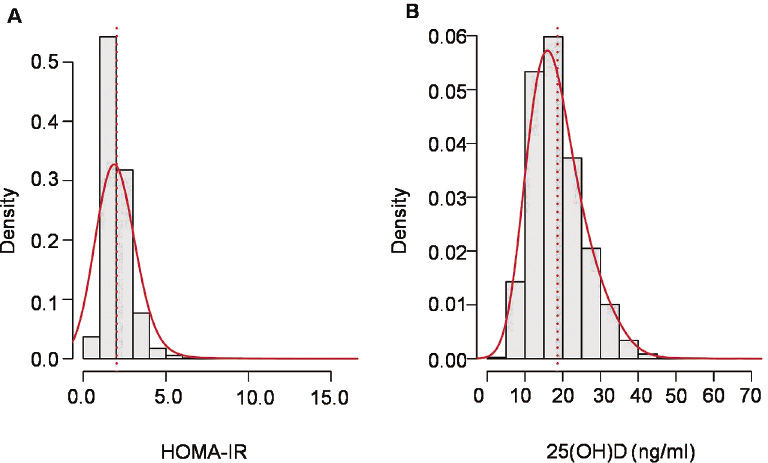
Of the 10,629 participants, 4,208 were male and 6,421 were female. The study population was relatively young: the mean age was 46.2 ± 15.7 years. The serum 25(OH)D showed a normal distribution, but the HOMA-IR was right-skewed (Fig. 1). The mean serum 25(OH)D was 18.63 ± 6.9 ng/mL. The median HOMA-IR (interquartile range) was 1.9 (1.5-2.4). The median (interquartile range) of BMI, WC, and fat mass were 22.91 (20.85-25.09) kg/m2, 79.0 (72.3-85.5) cm and 16.7 (13.2-20.4) kg, respectively. Other demographic and laboratory findings are presented in Table 1.
The association between serum 25(OH)D and HOMA-IR
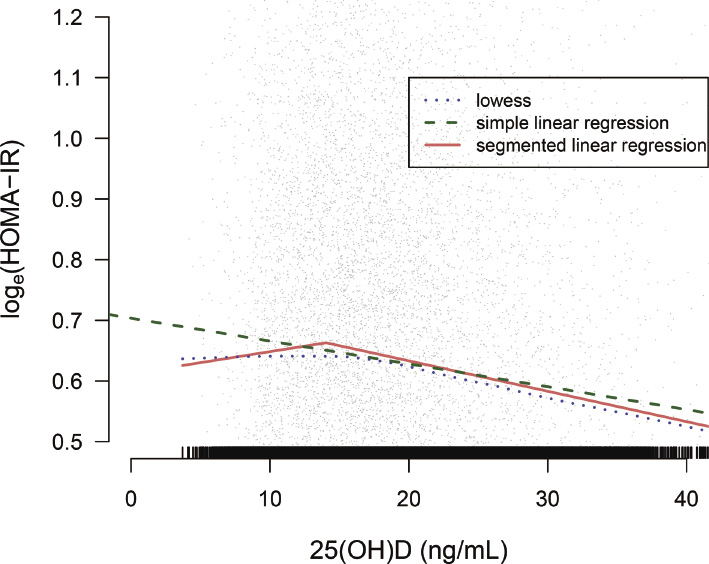
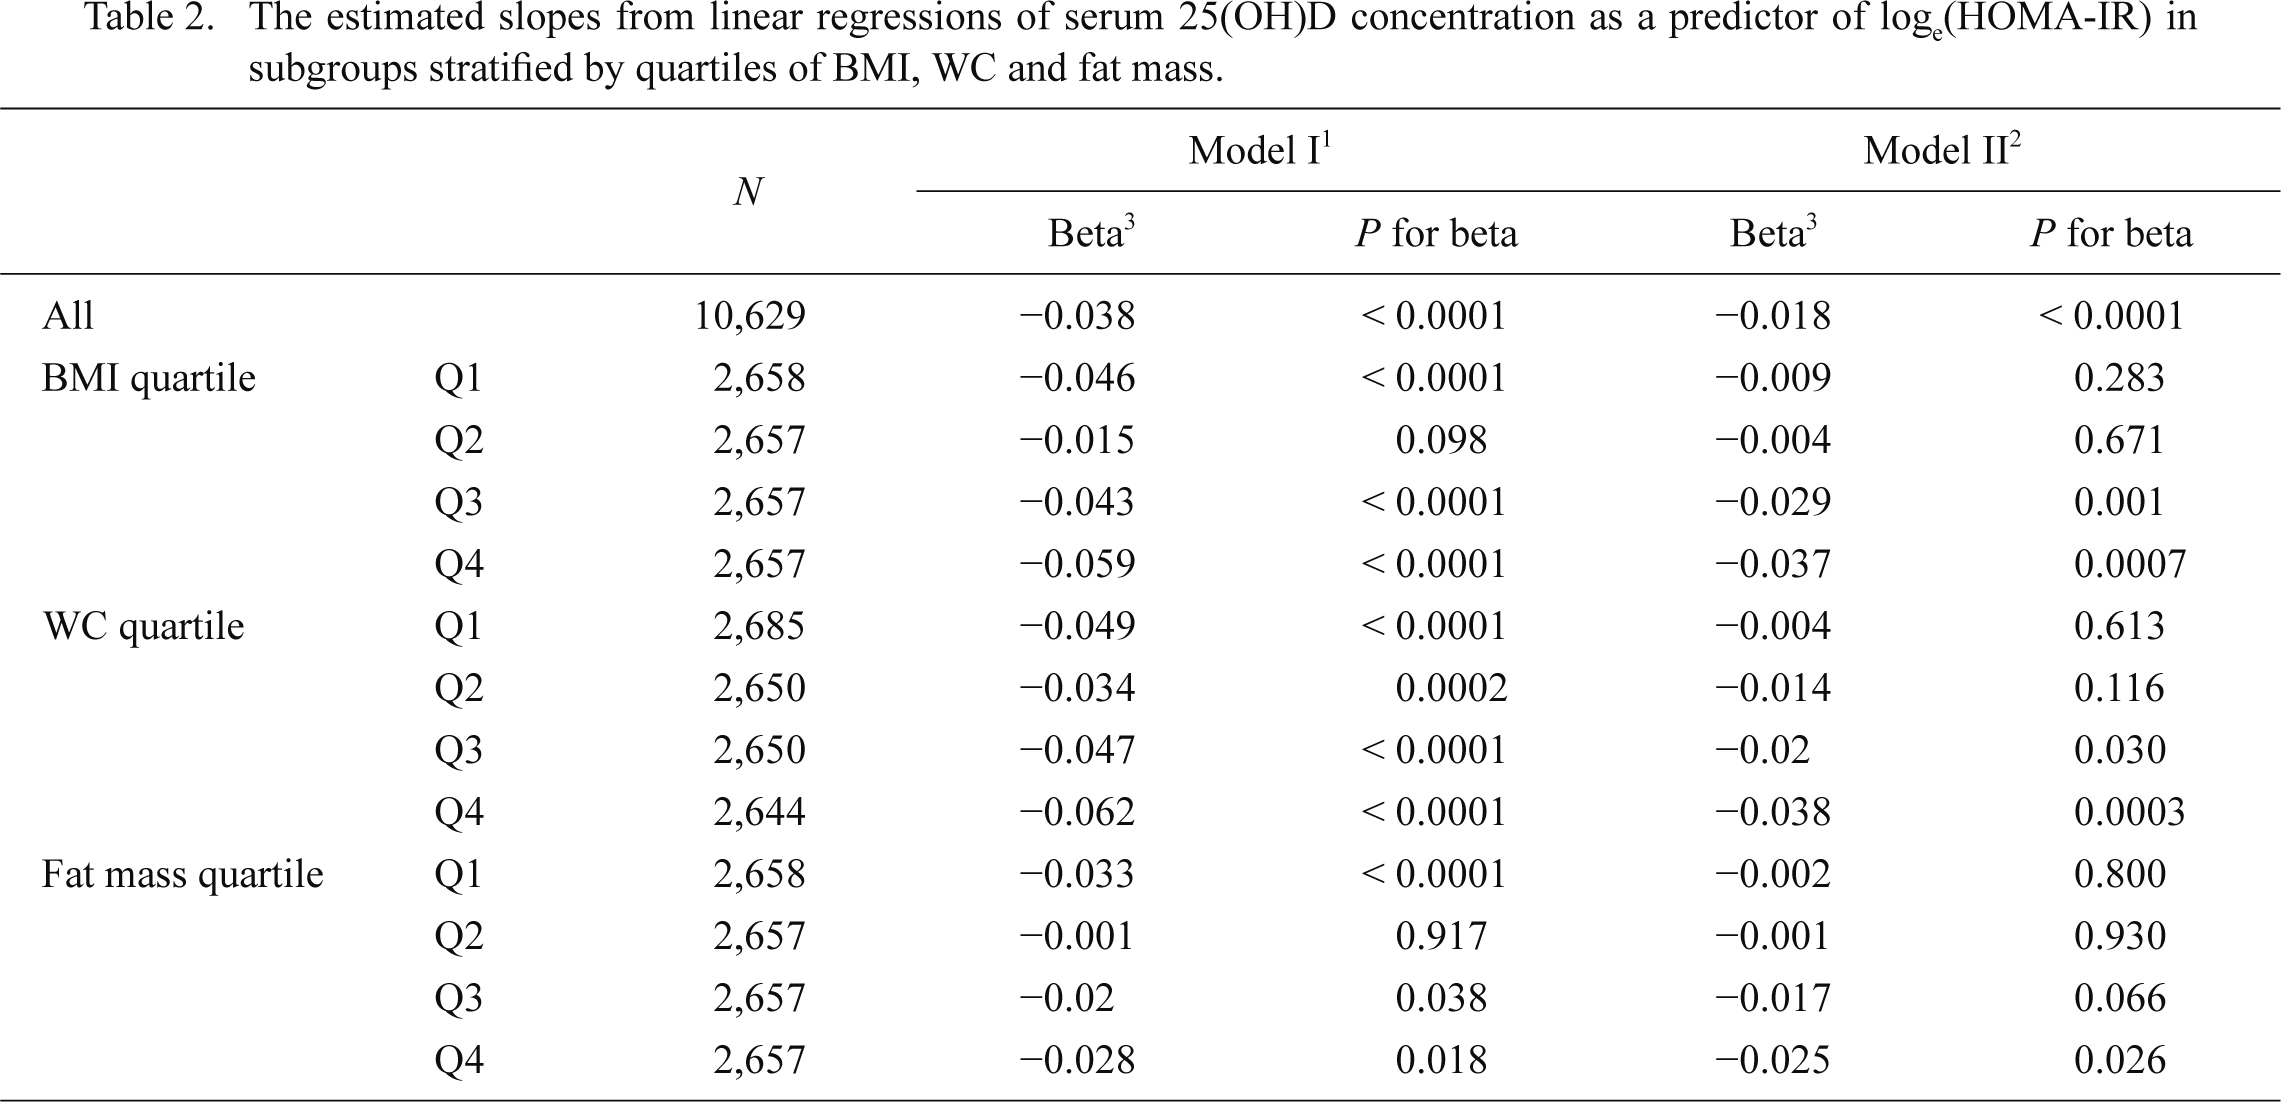
Fig. 2 shows scatter plots of loge(HOMA-IR) against serum 25(OH)D with three fitted lines: simple linear regression, locally weighted scatter plot smoothing (Lowess), and segmented linear regression. We found some ranges of serum 25(OH)D at which no inverse relationship between serum 25(OH)D and loge(HOMA-IR) was observed in the Lowess and segmented regression lines. A plateau in Lowess was recognized within the range of 10-20 ng/mL of 25(OH)D and a specific break-point calculated in segmented regression was 14.0 ng/mL. The slope of 25(OH)D on loge(HOMA-IR) in simple and multiple linear regression was −0.038 (p < 0.0001) and −0.018 (< 0.0001) per 10 ng/mL increase of 25(OH)D, respectively (Table 2).
Subgroup analysis according to BMI, WC and fat mass
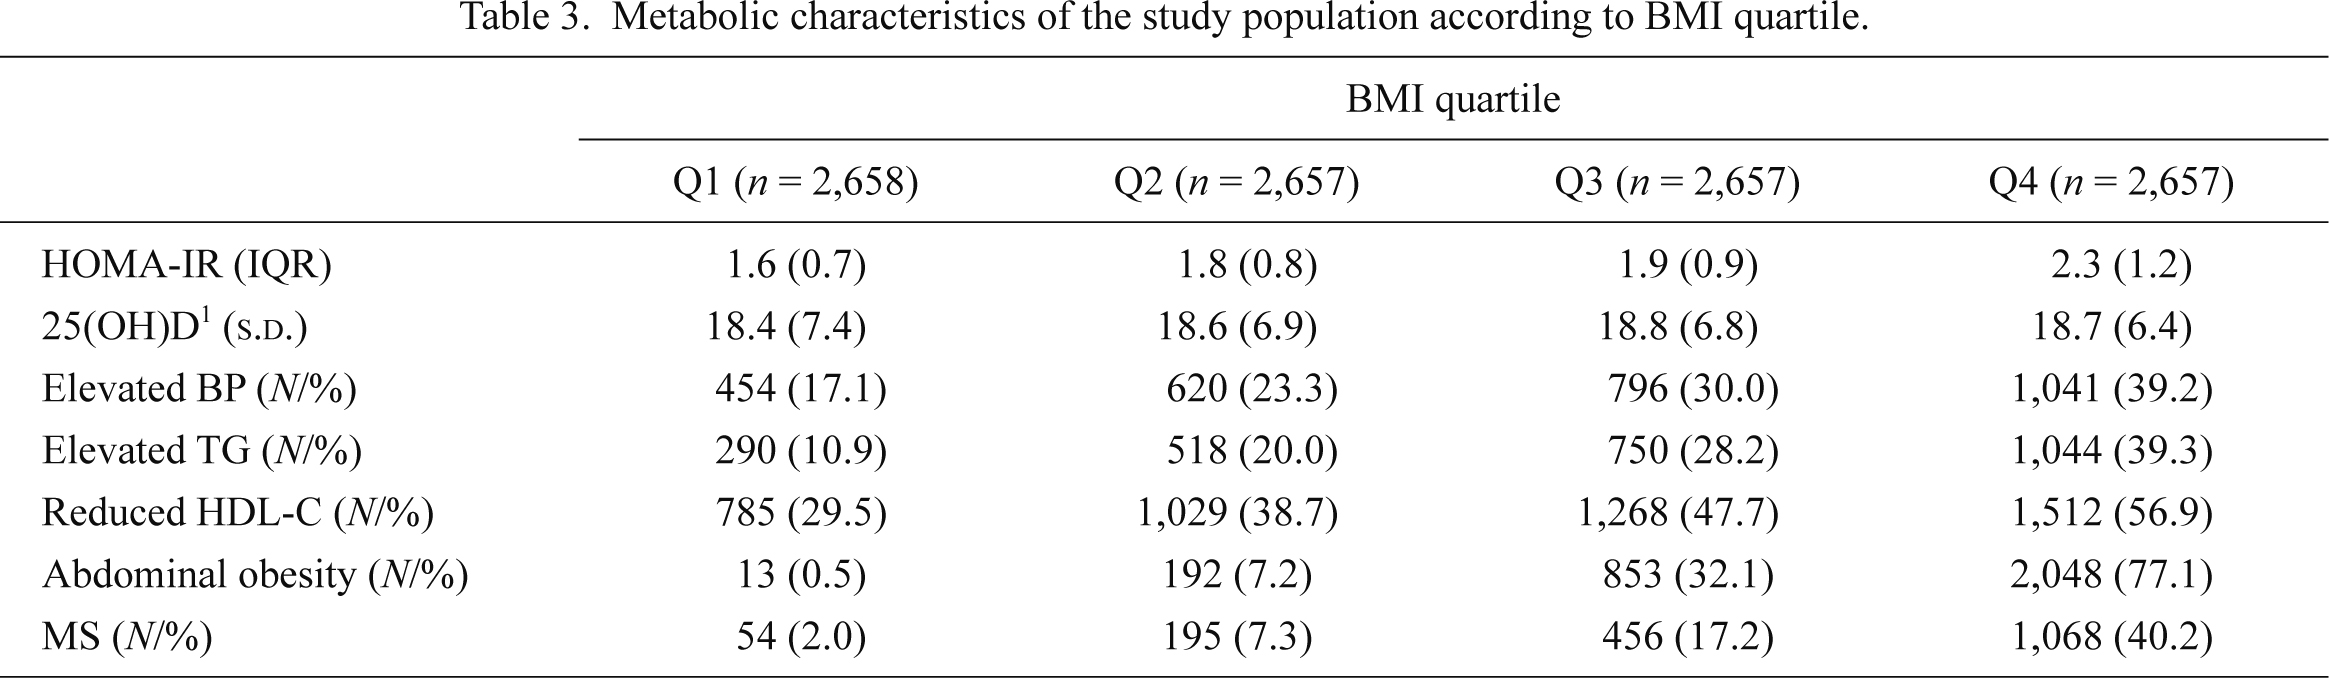
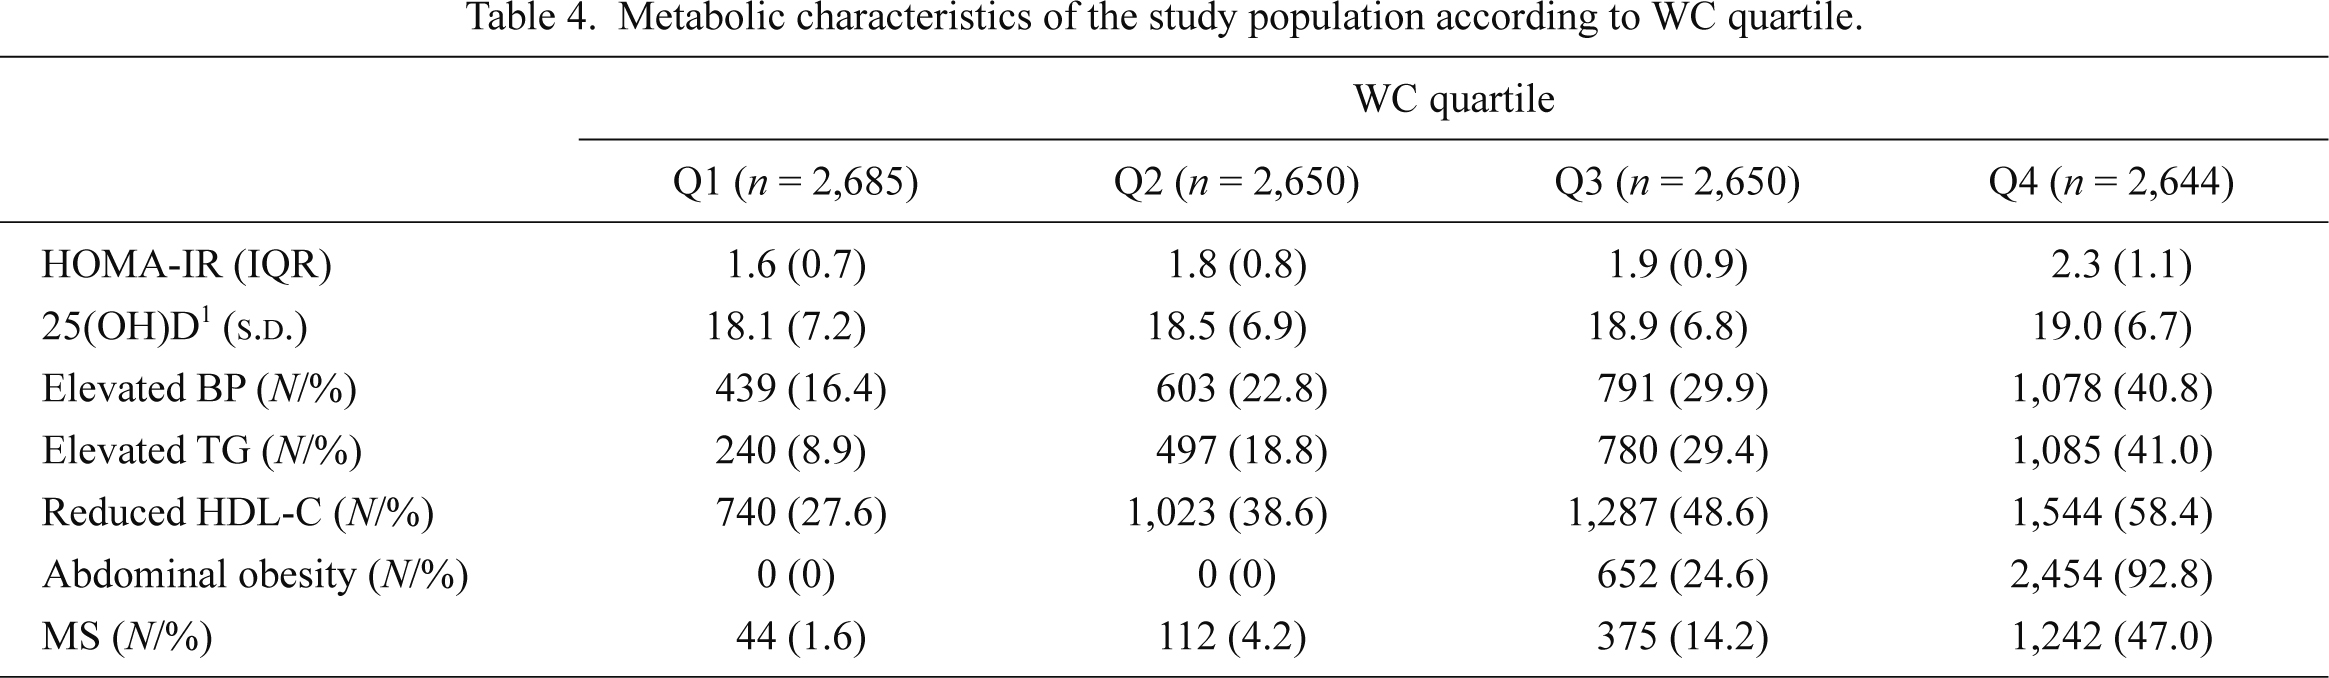
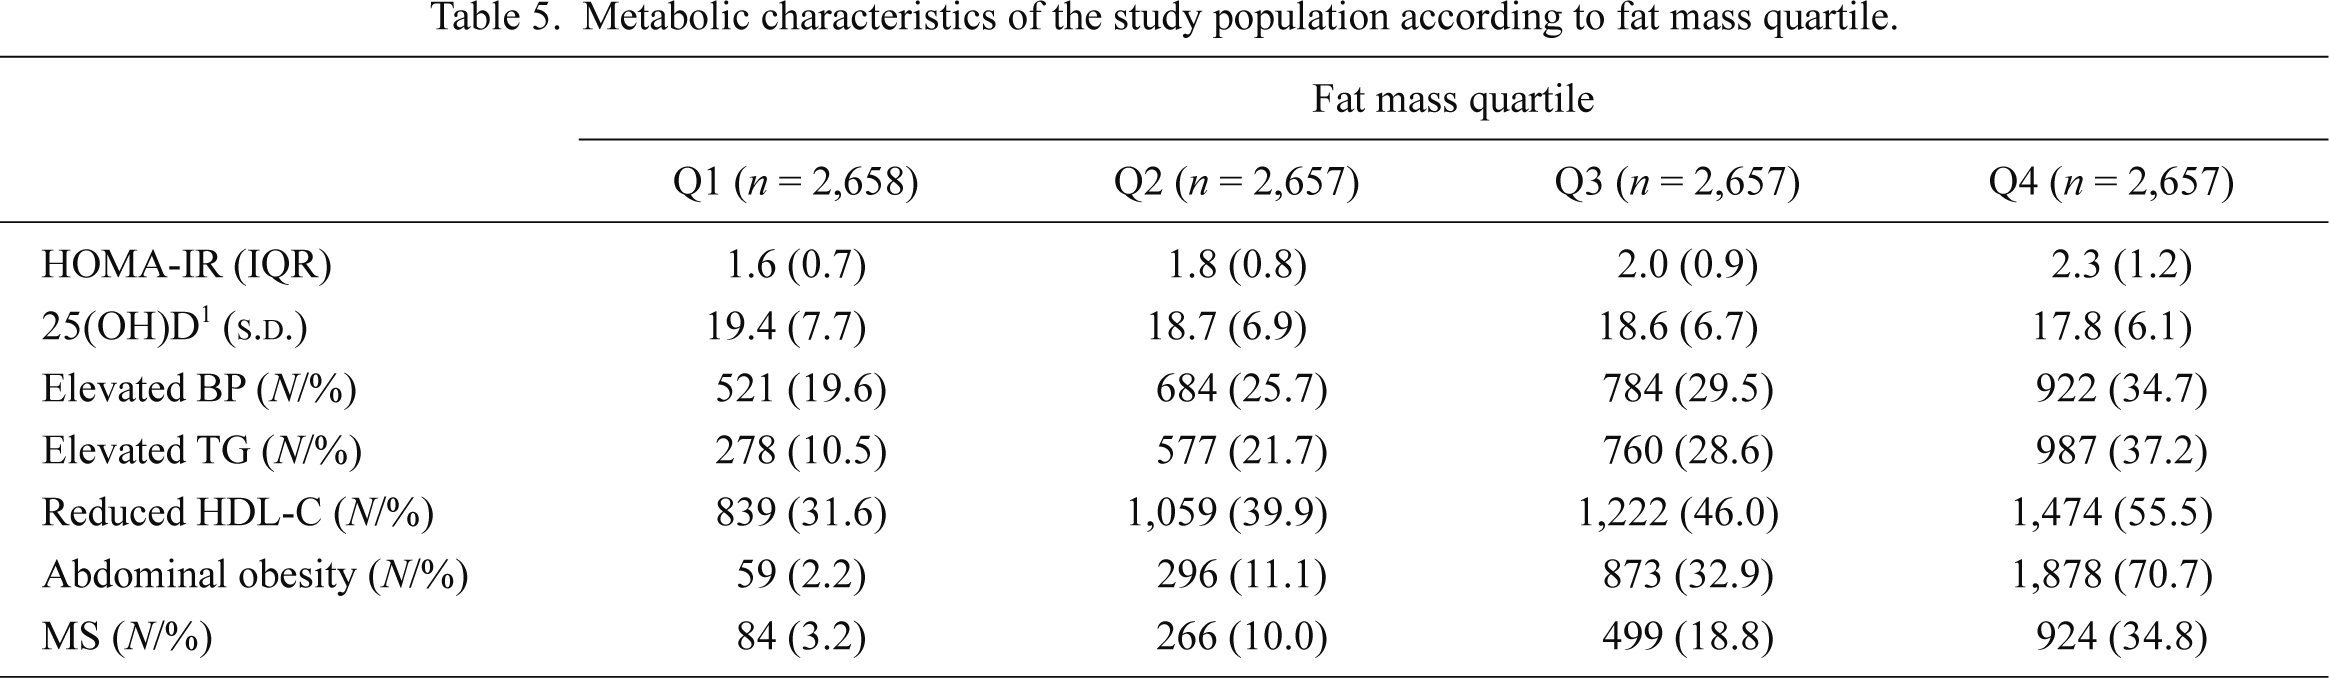
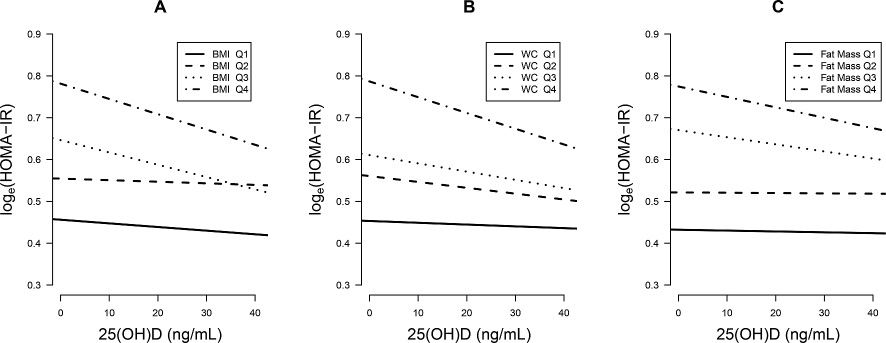
The metabolic characteristics of the BMI, WC, and fat mass quartiles were presented in Tables 3, 4 and 5. The proportion of MS components increased with the progression of BMI, WC, and fat mass quartiles. In Q4 of BMI, WC, and fat mass, the proportion of MS was 40.2%, 47.0%, and 34.8%, respectively. In subgroup analysis according to the degree of BMI, WC, and fat mass quartiles, we observed a strong association between serum 25(OH)D and loge(HOMA-IR)’s increase as BMI, WC, and fat mass increased, after adjusting for the potential confounding factors (Table 2, Fig. 3). In Q4 of BMI, WC, and fat mass, where many of the participants would be clinically obese, the slopes were nearly twice as steep as those of the whole population; the slopes of BMI, WC, and fat mass were −0.037 (p = 0.0007), −0.038 (p = 0.0003) and −0.025 (p = 0.026), respectively.
Discussion
IR is an independent risk factor for diabetes, atherosclerotic cardiovascular diseases, and all-cause mortality (Ausk et al. 2010; Reddy et al. 2010). An increase of IR is significantly associated with cardiovascular risk, even in populations without increased fasting glucose levels (Onat et al. 2006; Yildir et al. 2013). Thus, lowering IR is exigent in the promotion of public health and the reduction of economically related burdens. Although drug therapies, such as biguanides or thialidazones, could improve insulin sensitivity (Reddy et al. 2010), the casual usage is not applicable to a non-diabetic general population. In this respect, vitamin D could be a good alternative option. Generally, vitamin D is thought to be a key element in preventing musculoskeletal illnesses such as rickets, osteopenia and osteoporosis (Holick 2007). However, recent reports suggest that it has a pleiotropic effect that could decrease the risk of many chronic diseases, including cancers, infectious diseases, and cardiovascular disease (Holick 2007). In addition, a substantial body of literature has also suggested that an increase in serum 25(OH)D is associated with a decrease in IR (Pittas et al. 2007; Teegarden and Donkin 2009). Vitamin D deficiency is highly prevalent worldwide (Holick 2007; Mithal et al. 2009). Although supplementation of megadose vitamin D can be physically harmful due to the risk of hypercalcemia, vitamin D deficiency is corrected easily and safely with proper supplementation even at a relatively high dose of > 10,000 IU/day (Hathcock et al. 2007; Bischoff-Ferrari et al. 2010). Thus, one may expect that correcting vitamin D deficiencies with proper supplementation could be beneficial in many ways, including IR reduction. However, the IR lowering effect of vitamin D has not been fully proved by interventional studies (Tai et al. 2008; Pilz et al. 2013). Improper treatment duration or dosages can contribute to unsuccessful vitamin D supplementation. Also, vitamin D sensitivity varies by population group, so finding the correct group is essential for positive results. Consequently, we thought the degree of obesity could be a criterion that predicts the efficacy of vitamin D because obesity may contribute to both vitamin D deficiency (Earthman et al. 2012) and IR (Kahn et al. 2006). Since the IR-lowering effect of vitamin D is not substantial, only −0.16 units of HOMA-IR per +10 ng/mL of serum 25(OH)D in the Ely Prospective Study (n = 524, female 59.2%, aged 40-69 years) (Forouhi et al. 2008), the candidate for vitamin D supplementation needed to be a population without increased fasting glucose levels, who usually do not use potent medications including insulin sensitizers. Thus, we tried to find the differential effect of vitamin D on IR according to the degree of obesity in an adult Korean population without increased fasting glucose levels using a large dataset from KNHANES.
In the study, we observed a distinct trend; the slope of 25(OH)D on loge(HOMA-IR) became steeper with the progression of BMI, WC, and fat mass quartile in an adult Korean population without increased fasting glucose levels. Indeed, the statistical significance was most evident in Q4 of BMI, WC, and fat mass, where many participants could be classified as obese under the Asian criteria (WHO Expert Consultation 2004). According to our results, obese Asian adults who do not have increased fasting glucose levels may receive beneficial effects from a vitamin D supplementation. In fact, the prevalence of obesity in Asia has been increasing rapidly due to the westernization of diet and lifestyle (Chan et al. 2009). In Korea, the prevalence of obesity has reached 30.6% (Kim et al. 2005). Since obesity is associated with various co-morbidities, including IR (Kahn et al. 2006) and contributes significantly to economic burden, morbidity, and mortality (Yach et al. 2006), efforts to reduce risks related to obesity are needed. However, obesity control is very difficult to achieve through lifestyle modification or pharmacologic intervention (Gray et al. 2012). Since vitamin D insufficiency is prevalent in the obese population (Earthman et al. 2012) and is more easily corrected than obesity itself, vitamin D supplementation could be a good ancillary approach to IR combined with weight reduction, in treating an Asian adult obese population.
Recently, some researchers suggested the concept of “healthy obesity”, representing individuals who have lower cardiovascular risks, such as the metabolically healthy obesity (MHO) phenotype (Denis and Obin 2013). However, this might not be true. In our study, which examined a population within the healthy range of glucose metabolism, the components of MS increased with the progression of BMI, WC, and fat mass, and the proportion of MS in Q4 of three obesity-related variables was very high, as much as 50%. Furthermore, the IR value on the regression line was consistently higher in Q3-4 than Q1-2 in all three obesity-related variables. This was quite concordant with the studies finding that the MHO phenotype also showed higher IR and poorer cholesterol profiles than those with metabolically healthy normal weight (Manu et al. 2012). Moreover, the MHO phenotype is also associated with a higher incidence of hypertension (Lee et al. 2013). Thus, it may be that there is no “healthy obesity”, at least in the obese adult Korean population, and that all obese Koreans need to be treated actively which may include vitamin D supplementation.
We also found that the subjects without increased fasting glucose levels can be in a good condition for effective 25(OH)D supplementation. The serum 25(OH)D was negatively associated with loge(HOMA-IR) in both the simple and the multiple regression analyses. Moreover, we found the possibility of a non-linear association between 25(OH)D and loge(HOMA-IR) in those without increased fasting glucose levels. In the scatter plot, fitted lines by Lowess and segmented linear regression showed a range of 25(OH)D where loge(HOMA-IR) was not affected by serum 25(OH)D concentration; 10-20 ng/mL in Lowess and 14.0 ng/mL in segmented regression. This finding is concordant with the current definition of vitamin D deficiency (Holick 2007). Since the study was not designed to find a threshold value of 25(OH)D on loge(HOMA-IR), our analytical picture is not conclusive. Additionally, we could not confirm whether a non-linear association between 25(OH)D and loge(HOMA-IR) could be applied to the other conditions such as an increased fasting glucose. However, if this is true, maintaining serum 25(OH)D > 20 ng/mL in those without increased fasting glucose levels might be a prerequisite for the successful outcome from vitamin D supplementation. An appropriately designed study for threshold evaluation is needed.
The study has some limitations. First, this study is cross-sectional, which does not allow for causal or directional inferences to be made. However, a substantial body of literature consistently suggests that obesity might change the biologic environment of 25(OH)D, including adipose sequestration (Wortsman et al. 2000; Blum et al. 2008; Earthman et al. 2012) and that this biologic change might result in clinical effect modification. Future randomized controlled study in populations without increased glucose levels, particularly in an Asian ethnic group, needs to be completed to confirm our results and assumptions.
Second, a homogeneous ethnicity and narrow inclusion criteria including those without increased fasting glucose levels are further weaknesses of this study because these may limit the generalizability. However, the results of this study are consistent with previous studies. Kabadi et al. (2012) reported that abdominal obesity and vitamin D insufficiency interact synergistically to influence the risk of IR in the general adult US population. Belenchia et al. (2013) found that 25(OH)D supplementation successfully decreased IR in obese children in a small, but randomized controlled study. Since the previous studies did not examine an Asian ethnicity or individuals without increased fasting glucose levels, the aforementioned weaknesses might, paradoxically, be the strength of this study.
Third, the study subjects are relatively young. In therapeutic aspect, this might be a significant drawback because our study results cannot be applied to the elderly population where most metabolic abnormalities including IR are exacerbated. However, our results still imply a good clinical meaning in disease-preventive aspect since the derangements of metabolism are not fully established in our study subjects. If delaying early metabolic abnormality or primary prevention of chronic diseases with 25(OH)D supplementation could be proved in appropriately designed study, this will significantly improve our future public health.
In conclusion, increments of serum 25(OH)D might be a good ancillary strategy to reduce the risk of IR in those without increased fasting glucose levels, especially in the obese Asian population. Future randomized controlled studies need to be conducted to confirm our results.
Acknowledgments
S.W.L collected and cleaned the data, analyzed the results, performed the study, and wrote the manuscript. M.K. and H.K. analyzed the results. S.S.H., H.L., and J.P.L. analyzed and interpreted the results. D.K.K., C.S.L., and Y.S.K. designed the study and collected data. A.K.P. and K.W.J. designed the study, analyzed the results, and edited the manuscript. There were no more contributors other than the aforementioned authors. This paper was supported in part by a 2012 Suncheon National University Research Fund to A.K.P. There was otherwise no financial support. The data source (KNHANES) was supported by KCDC.
Conflict of Interest
The authors declare no conflict of interest.
References
-
Alberti,
K.G.,
Zimmet,
P. &
Shaw,
J.
(2006) Metabolic syndrome: a new world-wide definition. A Consensus Statement from the International Diabetes Federation. Diabet. Med., 23, 469-480.
-
Ausk,
K.J.,
Boyko,
E.J. &
Ioannou,
G.N.
(2010) Insulin resistance predicts mortality in nondiabetic individuals in the U.S. Diabetes Care, 33, 1179-1185.
-
Belenchia,
A.M.,
Tosh,
A.K.,
Hillman,
L.S. &
Peterson,
C.A.
(2013) Correcting vitamin D insufficiency improves insulin sensitivity in obese adolescents: a randomized controlled trial. Am. J. Clin. Nutr., 97, 774-781.
-
Bischoff-Ferrari,
H.A.,
Shao,
A.,
Dawson-Hughes,
B.,
Hathcock,
J.,
Giovannucci,
E. &
Willett,
W.C.
(2010) Benefit-risk assessment of vitamin D supplementation. Osteoporos. Int., 21, 1121-1132.
-
Blum,
M.,
Dolnikowski,
G.,
Seyoum,
E.,
Harris,
S.S.,
Booth,
S.L.,
Peterson,
J.,
Saltzman,
E. &
Dawson-Hughes,
B.
(2008) Vitamin D(3) in fat tissue. Endocrine, 33, 90-94.
-
Chan,
J.C.,
Malik,
V.,
Jia,
W.,
Kadowaki,
T.,
Yajnik,
C.S.,
Yoon,
K.H. &
Hu,
F.B.
(2009) Diabetes in Asia: epidemiology, risk factors, and pathophysiology. JAMA, 301, 2129-2140.
-
Denis,
G.V. &
Obin,
M.S.
(2013) ‘Metabolically healthy obesity’: origins and implications. Mol. Aspects Med., 34, 59-70.
-
Despres,
J.P.,
Lamarche,
B.,
Mauriege,
P.,
Cantin,
B.,
Dagenais,
G.R.,
Moorjani,
S. &
Lupien,
P.J.
(1996) Hyperinsulinemia as an independent risk factor for ischemic heart disease. N. Engl. J. Med., 334, 952-957.
-
Earthman,
C.P.,
Beckman,
L.M.,
Masodkar,
K. &
Sibley,
S.D.
(2012) The link between obesity and low circulating 25-hydroxyvitamin D concentrations: considerations and implications. Int. J. Obes. (Lond), 36, 387-396.
-
Ford,
E.S.,
Giles,
W.H. &
Dietz,
W.H.
(2002) Prevalence of the metabolic syndrome among US adults: findings from the third National Health and Nutrition Examination Survey. JAMA, 287, 356-359.
-
Forouhi,
N.G.,
Luan,
J.,
Cooper,
A.,
Boucher,
B.J. &
Wareham,
N.J.
(2008) Baseline serum 25-hydroxy vitamin d is predictive of future glycemic status and insulin resistance: the Medical Research Council Ely Prospective Study 1990-2000. Diabetes, 57, 2619-2625.
-
Gray,
L.J.,
Cooper,
N.,
Dunkley,
A.,
Warren,
F.C.,
Ara,
R.,
Abrams,
K.,
Davies,
M.J.,
Khunti,
K. &
Sutton,
A.
(2012) A systematic review and mixed treatment comparison of pharmacological interventions for the treatment of obesity. Obes. Rev., 13, 483-498.
-
Grundy,
S.M.,
Cleeman,
J.I.,
Daniels,
S.R.,
Donato,
K.A.,
Eckel,
R.H.,
Franklin,
B.A.,
Gordon,
D.J.,
Krauss,
R.M.,
Savage,
P.J.,
Smith,
S.C. Jr.,
Spertus,
J.A. &
Costa,
F.
(2005) Diagnosis and management of the metabolic syndrome: an American Heart Association/National Heart, Lung, and Blood Institute Scientific Statement. Circulation, 112, 2735-2752.
-
Hathcock,
J.N.,
Shao,
A.,
Vieth,
R. &
Heaney,
R.
(2007) Risk assessment for vitamin D. Am. J. Clin. Nutr., 85, 6-18.
-
Holick,
M.F.
(2007) Vitamin D deficiency. N. Engl. J. Med., 357, 266-281.
-
Hypponen,
E. &
Power,
C.
(2006) Vitamin D status and glucose homeostasis in the 1958 British birth cohort: the role of obesity. Diabetes Care, 29, 2244-2246.
-
Kabadi,
S.M.,
Lee,
B.K. &
Liu,
L.
(2012) Joint effects of obesity and vitamin D insufficiency on insulin resistance and type 2 diabetes: results from the NHANES 2001-2006. Diabetes Care, 35, 2048-2054.
-
Kahn,
S.E.,
Hull,
R.L. &
Utzschneider,
K.M.
(2006) Mechanisms linking obesity to insulin resistance and type 2 diabetes. Nature, 444, 840-846.
-
Kim,
D.M.,
Ahn,
C.W. &
Nam,
S.Y.
(2005) Prevalence of obesity in Korea. Obes. Rev., 6, 117-121.
-
Lee,
S.K.,
Kim,
S.H.,
Cho,
G.Y.,
Baik,
I.,
Lim,
H.E.,
Park,
C.G.,
Lee,
J.B.,
Kim,
Y.H.,
Lim,
S.Y.,
Kim,
H. &
Shin,
C.
(2013) Obesity phenotype and incident hypertension: a prospective community-based cohort study. J. Hypertens., 31, 145-151.
-
Levey,
A.S.,
Stevens,
L.A.,
Schmid,
C.H.,
Zhang,
Y.L.,
Castro,
A.F. 3rd.,
Feldman,
H.I.,
Kusek,
J.W.,
Eggers,
P.,
Van Lente,
F.,
Greene,
T. &
Coresh,
J.
(2009) A new equation to estimate glomerular filtration rate. Ann. Intern. Med., 150, 604-612.
-
Manu,
P.,
Ionescu-Tirgoviste,
C.,
Tsang,
J.,
Napolitano,
B.A.,
Lesser,
M.L. &
Correll,
C.U.
(2012) Dysmetabolic Signals in “Metabolically Healthy” Obesity. Obes. Res. Clin. Pract., 6, e9-e20.
-
Matthews,
D.R.,
Hosker,
J.P.,
Rudenski,
A.S.,
Naylor,
B.A.,
Treacher,
D.F. &
Turner,
R.C.
(1985) Homeostasis model assessment: insulin resistance and beta-cell function from fasting plasma glucose and insulin concentrations in man. Diabetologia, 28, 412-419.
-
Mithal,
A.,
Wahl,
D.A.,
Bonjour,
J.P.,
Burckhardt,
P.,
Dawson-Hughes,
B.,
Eisman,
J.A.,
El-Hajj Fuleihan,
G.,
Josse,
R.G.,
Lips,
P. &
Morales-Torres,
J.
(2009) Global vitamin D status and determinants of hypovitaminosis D. Osteoporos. Int., 20, 1807-1820.
-
Muggeo,
V.M.
(2003) Estimating regression models with unknown break-points. Stat. Med., 22, 3055-3071.
-
Onat,
A.,
Hergenc,
G.,
Turkmen,
S.,
Yazici,
M.,
Sari,
I. &
Can,
G.
(2006) Discordance between insulin resistance and metabolic syndrome: features and associated cardiovascular risk in adults with normal glucose regulation. Metabolism, 55, 445-452.
-
Ou,
H.Y.,
Karnchanasorn,
R.,
Lee,
L.Z. &
Chiu,
K.C.
(2011) Interaction of BMI with vitamin D and insulin sensitivity. Eur. J. Clin. Invest., 41, 1195-1201.
-
Pilz,
S.,
Kienreich,
K.,
Rutters,
F.,
de Jongh,
R.,
van Ballegooijen,
A.J.,
Grubler,
M.,
Tomaschitz,
A. &
Dekker,
J.M.
(2013) Role of vitamin D in the development of insulin resistance and type 2 diabetes. Curr. Diab. Rep., 13, 261-270.
-
Pittas,
A.G.,
Lau,
J.,
Hu,
F.B. &
Dawson-Hughes,
B.
(2007) The role of vitamin D and calcium in type 2 diabetes. A systematic review and meta-analysis. J. Clin. Endocrinol. Metab., 92, 2017-2029.
-
Reddy,
K.J.,
Singh,
M.,
Bangit,
J.R. &
Batsell,
R.R.
(2010) The role of insulin resistance in the pathogenesis of atherosclerotic cardiovascular disease: an updated review. J. Cardiovasc. Med. (Hagerstown), 11, 633-647.
-
Samuel,
V.T. &
Shulman,
G.I.
(2012) Mechanisms for insulin resistance: common threads and missing links. Cell, 148, 852-871.
-
Tai,
K.,
Need,
A.G.,
Horowitz,
M. &
Chapman,
I.M.
(2008) Vitamin D, glucose, insulin, and insulin sensitivity. Nutrition, 24, 279-285.
-
Teegarden,
D. &
Donkin,
S.S.
(2009) Vitamin D: emerging new roles in insulin sensitivity. Nutr. Res. Rev., 22, 82-92.
-
WHO Expert Consultation
(2004) Appropriate body-mass index for Asian populations and its implications for policy and intervention strategies. Lancet, 363, 157-163.
-
Wortsman,
J.,
Matsuoka,
L.Y.,
Chen,
T.C.,
Lu,
Z. &
Holick,
M.F.
(2000) Decreased bioavailability of vitamin D in obesity. Am. J. Clin. Nutr., 72, 690-693.
-
Yach,
D.,
Stuckler,
D. &
Brownell,
K.D.
(2006) Epidemiologic and economic consequences of the global epidemics of obesity and diabetes. Nat. Med., 12, 62-66.
-
Yildir,
I.C.,
Kutluturk,
F.,
Tasliyurt,
T.,
Yelken,
B.M.,
Acu,
B.,
Beyhan,
M.,
Erkorkmaz,
U. &
Yilmaz,
A.
(2013) Insulin resistance and cardiovascular risk factors in women with PCOS who have normal glucose tolerance test. Gynecol. Endocrinol., 29, 148-151.