Abstract
The clinical outcome for esophageal squamous cell carcinoma (ESCC) patients is often poor because of the invasive nature of this tumor type. AT-rich interactive domain 1A (ARID1A) functions as a tumor suppressor, and its gene mutation has been reported in various human malignancies. ARID1A is a non-catalytic subunit of the SWItch/Sucrose Non Fermentable (SWI/SNF) chromatin-remodeling complex that regulates gene transcription. Decreased expression of ARID1A protein has been reported to decrease the expression of E-cadherin, an adhesion protein. However, the correlation between ARID1A and E-cadherin expression status in ESCC remains largely unknown. To address this issue, we examined the expression of ARID1A and E-cadherin in tumor specimens excised from 83 ESCC patients using immunohistochemical analysis. The intensity of the ARID1A immunoreactivity was significantly lower in tumors with a growth pattern characterized by ill-defined borders than that in tumors with an expansive growth pattern having a well-demarcated border or tumors with an intermediate growth pattern. Thus, decreased ARID1A immunoreactivity correlated with infiltrative growth of ESCC. In contrast, E-cadherin status did not correlate with the infiltrative growth pattern of ESCC. Moreover, ARID1A expression status did not significantly correlate with any of other clinicopathological factors, E-cadherin expression levels, or the clinical outcome of the patients. On the other hand, the patients with tumors expressing low levels of E-cadherin exhibited significantly lower survival rates than those with high expression. In conclusion, reduced ARID1A expression in tumor tissues contributes to infiltrative growth of ESCC, irrespective of E-cadherin expression levels.
Introduction
The clinical outcome for esophageal squamous cell carcinoma (ESCC) patients is often poor because of the invasive nature of this tumor type and the prevalence of lymph node metastasis (Matsuda et al. 2011). Lymph nodes metastasis can occur from the cervical to abdominal lymph node regions (Akiyama et al. 1981). While incidences of adenocarcinoma of the esophagus have increased in Japan, the predominant histological subtype is still squamous cell carcinoma (Shibata et al. 2008). ESCC exhibits highly malignant behavior, and improving the prognosis of patients with ESCC is a major focus of cancer research. Numerous studies have investigated the correlation between changes in protein expression and invasive properties of ESCC using immunohistochemical methods (for review in Lin et al. 2009).
AT-rich interactive domain 1A (ARID1A) has been recently identified as a tumor suppressor (Oike et al. 2013; Wu et al. 2014). The ARID1A protein (also known as BAF250a) is a non-catalytic subunit of the SWItch/Sucrose Non Fermentable (SWI/SNF) chromatin-remodeling complex (Oike et al. 2013). The SWI/SNF complex regulates gene transcription by binding transcriptional factors via nucleosome remodeling, nucleosome sliding, and transferring histone octamers to other DNA molecules (Sudarsanam and Winston 2000). Therefore, reduced expression of ARID1A can result in dysfunction of the SWI/SNF complex and, consequently, inhibit transcription of various genes. Recently, an ARID1A-inactivating mutation and the loss of ARID1A protein expression were identified as factors involved in tumor progression in various human malignancies (Oike et al. 2013; Wu et al. 2014). In addition, reduced expression of ARID1A is associated with epithelial-mesenchymal transition via the repression of the adhesion protein E-cadherin, which is a component of the adherens junction (Yan et al. 2014). However, the correlation between ARID1A and E-cadherin expression status in ESCC has yet to be confirmed. To address this issue, we evaluated ARID1A and E-cadherin status in ESCC patient tumor samples using immunohistochemistry. We also examined the expression status of these proteins in relation to the clinicopathological features of each ESCC tumor analyzed, to further explore whether ARID1A expression correlated with poor prognosis in ESCC patients.
Materials and Methods
ESCC case selection
We selected 95 primary ESCC patients who underwent surgery without neoadjuvant therapy from January 2000 to December 2005 at Tohoku University Hospital, Sendai, Japan. We excluded patients who were diagnosed with final pathological tumor stages, pT1a and pT1b, which could not be clearly assessed via immunostaining and/or exhibited variant-type components (e.g. a basaloid carcinoma component). Consequently, only 83 of the original 95 primary ESCC patients were included in the study. Patient characteristics are summarized in Table 1. We determined the growth pattern of each tumor based on the Japanese Classification of Esophageal Cancer (Japan Esophageal Society 2009). We classified tumor-node-metastasis (TNM) based on the TNM classification of malignant tumors by the International Union Against Cancer (Sobin et al. 2009). The Ethics Committee at Tohoku University School of Medicine approved the study protocol (Accession No. 2012-1-213), and informed consent was obtained from individual patients before surgery.

We conducted immunohistochemistry using a rabbit anti-ARID1A polyclonal antibody (1:500 dilution; Sigma-Aldrich, USA) and mouse E-cadherin monoclonal antibody (1:200 dilution; Zymed, USA). After surgery, resected specimens were fixed using 10% formalin solution and embedded in paraffin. The paraffin blocks containing surgical specimens were sectioned (3 μm thickness). Sections were then mounted on slides, deparaffinized in xylene, and dehydrated in ethanol. Antigen-retrieval was performed by autoclaving the slides for 5 min at 121°C, for both ARID1A and E-cadherin staining. The slides were then washed with PBS and incubated at room temperature with a protein blocking solution (Histofine Kit; Nichirei, Tokyo, Japan), and then all slides were reacted with primary antibodies overnight at 4°C. We blocked endogenous peroxidase activity by applying 0.3% hydrogen peroxidase to the slides for 30 min at room temperature. Subsequently, for ARID1A labeling, the slides were incubated with biotinylated goat antirabbit IgG (Nichirei) and then with horseradish peroxidase-conjugated streptavidin (Nichirei). For E-cadherin labeling, slides were incubated with peroxidase-labeled polymer conjugated to goat anti-rabbit IgG (Dako, Denmark). Lastly, the antigen-antibody complex was visualized using 3,3´-diaminobenzidine (1 mmol/L, in 50 mol/L Tris-HCl buffer, pH 7.6, and 0.006% H2O2) and counterstained using hematoxylin. Gastric mucosa or breast cancer tissue was used as a positive control for ARID1A or E-cadherin expression, respectively.
Evaluation of immunohistochemistry
Each specimen was analyzed by two researchers (Y.O. and Y.N.) in a blinded manner, where the researchers had no prior knowledge of the patient’s clinical data or outcome. ARID1A and E-cadherin expression was confirmed by nuclear and membrane immunopositivity, respectively. Five different high-power fields were analyzed per slide, each field including more than 100 carcinoma cells. An H-score was calculated according to the percentage of positive cells and relative immuno-intensity. Relative immuno-intensity was evaluated and scored according to the following criteria: 0, completely negative; 1+, weak; 2+, moderate, and 3+, marked immunoreactivity. The H-score was calculated by multiplying the percentage of positive cells to the immuno-intensity score (H-scored ranged from 0 to 300).
In order to analyze the association between protein expression status and ESCC patient survival, slides with H-scores lower than the median were tentatively categorized as the “low expression group,” while those with H-scores greater than the median were the “high expression group.”
Statistical analysis
We used a Student’s t-test and one-way ANOVA to analyze the correlation between ARID1A or E-cadherin expression and the following clinicopathological factors: tumor size, tumor differentiation, growth pattern, tumor depth, pathological stage, extent of invasion, and metastasis. If the clinicopathological variable consisted of more than 3 factors, we used the one-way ANOVA method. To evaluate the correlation between ARID1A and E-cadherin expression, the Spearman rank correlation coefficient was used. P < 0.05 was considered statistically significant. Survival curves were determined using the Kaplan-Meier method, and statistical significance was calculated using a log-rank test. All the statistical analyses were performed using JMP Pro11 software (SAS Institute, Cary, CA, USA).
Results
ARID1A and E-cadherin immunoreactivity in ESCC patients
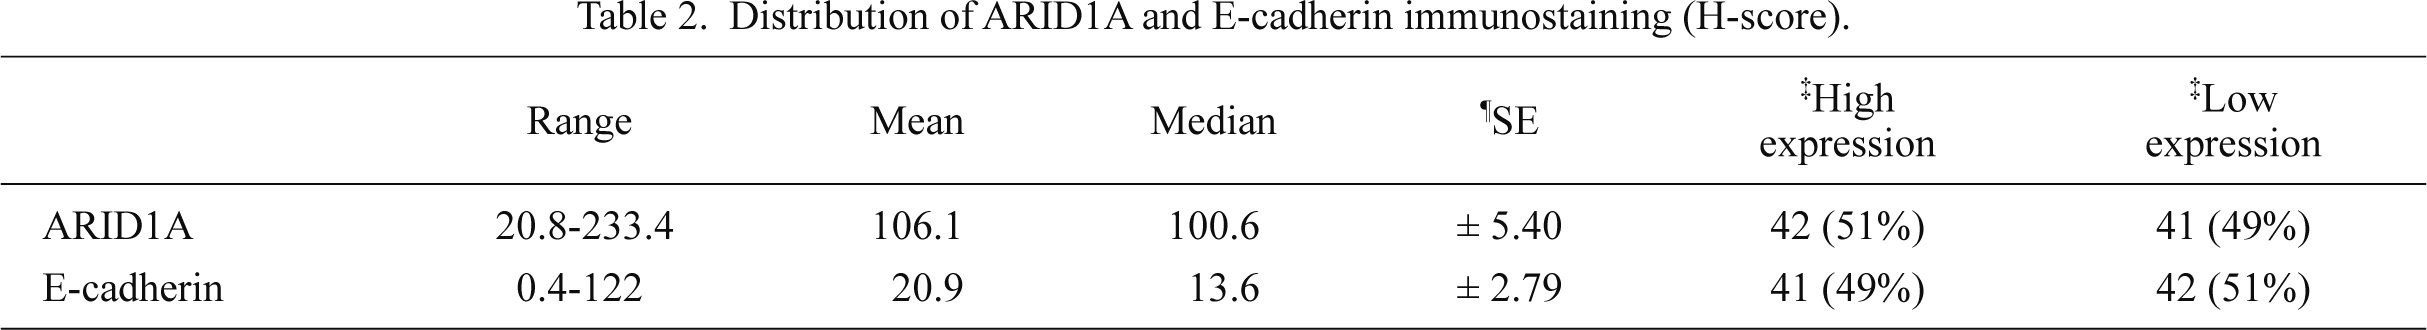
In carcinoma cells, we detected ARID1A immunoreactivity in the nucleus (Fig. 1), while E-cadherin was mainly expressed in the cell membrane (Fig. 2). ARID1A was almost homogenously detected in the tumor area examined. Median H-scores of ARID1A and E-cadherin expression were 100.6 (± 5.40) and 13.6 (± 2.79), respectively. The distribution of ARID1A and E-cadherin H-scores are summarized in Table 2.
The correlation between the status of ARID1A or E-cadherin expression and clinicopathological factors of ESCC patients
The average H-score of tumors with an expansive growth pattern (INFa), intermediate growth pattern (INFb), and infiltrative growth pattern (INFc) were 122.6 (± 10.4), 106.6 (± 6.7), and 74.7 (± 13.7), respectively. There was a significant positive correlation between ARID1A expression and the growth pattern of cancer in ESCC patients (P = 0.025; Table 3). The ARID1A expression status of INFc tumors was significantly lower than tumors with INFa (P < 0.01) or INFb (P < 0.05) (Fig. 3). In contrast, E-cadherin status did not correlate with the infiltrative growth pattern of ESCC (Table 3). No other clinicopathological factor significantly correlated with ARID1A expression status (Table 3), except that lower ARID1A status tended to be correlated with increased tumor size and prevalence of distant metastasis (P = 0.071 and 0.051, respectively). Lymph node metastasis and E-cadherin status also tended to be correlated but did not reach statistical significance (P = 0.081) (Table 3). Importantly, ARID1A and E-cadherin expression levels were not correlated (Fig. 4).

We used the Kaplan-Meier method to investigate whether ARID1A or E-cadherin expression levels were associated with patient survival rate. However, the overall survival and cause-specific survival rates were not significantly different between patients in the high and low expressing ARID1A groups (Fig. 5A and B). However, patients with tumors expressing low levels of E-cadherin exhibited significantly lower survival rates than those with high expression (Fig. 5C and D). We also evaluated the survival data of the patients according to their tumor growth patterns. INFc group tended to be associated with a lower survival rate but this did not reach statistical significance (Fig. 6).
Discussion
In present study, we investigated the relationship between ARID1A expression status, clinicopathological factors of ESCC tumors, and patient survival rate. E-cadherin expression was also evaluated because a relationship between the loss of ARID1A expression and reduced E-cadherin expression was recently reported in gastric cancer (Yan et al. 2014).
Interestingly, in the present study, ARID1A expression was significantly decreased in ESCC tumors with INFc (the infiltrative growth pattern). In addition, the ARID1A expression status in patients with INFc tumors was significantly lower than that in patients with INFa or INFb tumor growth patterns. The infiltrative growth patterns were classified according to the Japanese Classification of Esophageal Cancer (Japan Esophageal Society 2009). The growth patterns of carcinoma tissues have important implications in patient prognosis. Indeed, infiltrative growth patterns are recognized as an important prognostic factor in several carcinomas, including ESCC (Maehara et al. 1994; Ooki et al. 2007; Morikawa et al. 2012). In our present study, the cause-specific survival rate tended to be lower in the INFc group compared to the INFa and INFb groups but this difference did not reach statistical significance. This could be due to the relatively small sample size of the patients examined, as there were only 12 patients in the INFc group. Therefore, at least for the primary lesion, the results of our present study indicate that decreased ARID1A expression may contribute to infiltrative growth in ESCC tumors.
Unexpectedly, the status of ARID1A did not correlate with E-cadherin status nor did E-cadherin status correlate with the infiltrative growth pattern in our present study. In contrast to our results, a previous study reported decreased E-cadherin expression as a possible mechanism underlying the infiltrative growth pattern characterized in ESCC (Kadowaki et al. 1994). A recent report showed that reduced ARID1A expression was associated with epithelial-mesenchymal transition through the repression of E-cadherin in gastric cancer (Yan et al. 2014), suggesting that ARID1A could regulate E-cadherin expression via regulation of gene transcription. However, in ESCC, transcriptional proteins such as Slug, Snail, and Twist were well known regulators of E-cadherin expression (Uchikado et al. 2005; Natsugoe et al. 2007; Sasaki et al. 2009; Gong et al. 2012). Therefore, the results of our present study indicated that ARID1A was not just a transcriptional regulator of E-cadherin in ESCC, and the elucidation of ARID1A function in ESCC requires further investigation.
We analyzed the survival rate of the patients according to their ARID1A and E-cadherin expression status. The survival rate of patients with low E-cadherin expression was significantly lower than that of patients with high expression, which is consistent with a previous report (Lin et al. 2009). However, ARID1A did not appear to influence patient survival in ESCC. Wu et al. (2014) reviewed the association between a better prognosis and Epstein-Barr virus (EBV) infection or microsatellite instability that was correlated with loss of ARID1A. We did not specifically test for EBV infection, which may account for our findings.
To the best of our knowledge, this is the first study to report the expression of ARID1A in ESCC tissue specimens. Decreased ARID1A expression positively and significantly correlated with infiltrative growth in ESCC patients. And these findings may occur without loss of the E-cadherin expression mechanism. However, to validate this hypothesis, further investigation into the role of ARID1A in ESCC is required.
Conflict of Interest
The authors declare no conflict of interest.
References
-
Akiyama,
H.,
Tsurumaru,
M.,
Kawamura,
T. &
Ono,
Y.
(1981) Principles of surgical treatment for carcinoma of the esophagus: analysis of lymph node involvement. Ann. Surg., 194, 438-446.
-
Gong,
T.,
Xue,
Z.,
Tang,
S.,
Zheng,
X.,
Xu,
G.,
Gao,
L.,
Zhao,
G.,
Hong,
L.,
Tang,
G.,
Zhang,
H.,
Wang,
R.,
Jiang,
Y. &
Fan,
D.
(2012) Nuclear expression of Twist promotes lymphatic metastasis in esophageal squamous cell carcinoma. Cancer Biol. Ther., 13, 606-613.
-
Japan Esophageal Society
(2009) Japanese Classification of Esophageal Cancer, tenth edition: part I. Esophagus, 6, 1-25.
-
Kadowaki,
T.,
Shiozaki,
H.,
Inoue,
M.,
Tamura,
S.,
Oka,
H.,
Doki,
Y.,
Iihara,
K.,
Matsui,
S.,
Iwazawa,
T.,
Nagafuchi,
A.,
Tsukita,
S. &
Mori,
T.
(1994) E-cadherin and α-catenin expression in human esophageal cancer. Cancer Res., 54, 291-296.
-
Lin,
D.C.,
Du,
X.L. &
Wang,
M.R.
(2009) Protein alterations in ESCC and clinical implications: a review. Dis. Esophagus, 22, 9-20.
-
Maehara,
Y.,
Oshiro,
T.,
Adachi,
Y.,
Ohno,
S.,
Akazawa,
K. &
Sugimachi,
K.
(1994) Growth pattern and prognosis of gastric cancer invading the subserosa. J. Surg. Oncol., 55, 203-208.
-
Matsuda,
T.,
Ajiki,
W.,
Marugame,
T.,
Ioka,
A.,
Tsukuma,
H. &
Sobue,
T.
(2011) Population-based survival of cancer patients diagnosed between 1993 and 1999 in Japan: a chronological and international comparative study. Jpn. J. Clin. Oncol., 41, 40-51.
-
Morikawa,
T.,
Kuchiba,
A.,
Qian,
Z.R.,
Mino-Kenudson,
M.,
Hornick,
J.L.,
Yamauchi,
M.,
Imamura,
Y.,
Liao,
X.,
Nishihara,
R.,
Meyerhardt,
J.A.,
Fuchs,
C.S. &
Ogino,
S.
(2012) Prognostic significance and molecular associations of tumor growth pattern in colorectal cancer. Ann. Surg. Oncol., 19, 1944-1953.
-
Natsugoe,
S.,
Uchikado,
Y.,
Okumura,
H.,
Matsumoto,
M.,
Setoyama,
T.,
Tamotsu,
K.,
Kita,
Y.,
Sakamoto,
A.,
Owaki,
T.,
Ishigami,
S. &
Aikou,
T.
(2007) Snail plays a key role in E-cadherin-preserved esophageal squamous cell carcinoma. Oncol. Rep., 17, 517-523.
-
Oike,
T.,
Ogiwara,
H.,
Nakano,
T.,
Yokota,
J. &
Kohno,
T.
(2013) Inactivating mutations in SWI/SNF chromatin remodeling genes in human cancer. Jpn. J. Clin. Oncol., 43, 849-855.
-
Ooki,
A.,
Yamashita,
K.,
Kobayashi,
N.,
Katada,
N.,
Sakuramoto,
S.,
Kikuchi,
S. &
Watanabe,
M.
(2007) Lymph node metastasis density and growth pattern as independent prognostic factors in advanced esophageal squamous cell carcinoma. World J. Surg., 31, 2184-2191.
-
Sasaki,
K.,
Natsugoe,
S.,
Ishigami,
S.,
Matsumoto,
M.,
Okumura,
H.,
Setoyama,
T.,
Uchikado,
Y.,
Kita,
Y.,
Tamotsu,
K.,
Sakamoto,
A.,
Owaki,
T. &
Aikou,
T.
(2009) Significance of Twist expression and its association with E-cadherin in esophageal squamous cell carcinoma. J. Exp. Clin. Cancer Res., 28, 158.
-
Shibata,
A.,
Matsuda,
T.,
Ajiki,
W. &
Sobue,
T.
(2008) Trend in incidence of adenocarcinoma of the esophagus in Japan, 1993-2001. Jpn. J. Clin. Oncol., 38, 464-468.
-
Sobin,
L.H.,
Gospodarowicz,
M.K. &
Wittekind,
C.
(2009) TNM Classification of Malignant Tumors, 7th ed., Wiley-Blackwell, New York, USA.
-
Sudarsanam,
P. &
Winston,
F.
(2000) The Swi/Snf family nucleosome-remodeling complexes and transcriptional control. Trends Genet., 16, 345-351.
-
Uchikado,
Y.,
Natsugoe,
S.,
Okumura,
H.,
Setoyama,
T.,
Matsumoto,
M.,
Ishigami,
S. &
Aikou,
T.
(2005) Slug Expression in the E-cadherin preserved tumors is related to prognosis in patients with esophageal squamous cell carcinoma. Clin. Cancer Res., 11, 1174-1180.
-
Wu,
R.C.,
Wang,
T.L. &
Shih,
I.M.
(2014) The emerging roles of ARID1A in tumor suppression. Cancer Biol. Ther., 15, 655-664.
-
Yan,
H.B.,
Wang,
X.F.,
Zhang,
Q.,
Tang,
Z.Q.,
Jiang,
Y.H.,
Fan,
H.Z.,
Sun,
Y.H.,
Yang,
P.Y. &
Liu,
F.
(2014) Reduced expression of the chromatin remodeling gene ARID1A enhances gastric cancer cell migration and invasion via downregulation of E-cadherin transcription. Carcinogenesis, 35, 867-876.