Abstract
Fibroblast growth factor receptor 2 (FGFR2) has been proved to be a significant prognostic factor and a potential therapeutic target in several types of cancer, including gastric cancer. FGFR2 consists two isoforms: FGFR2-IIIb and FGFR2-IIIc, which can be stimulated by different ligands and trigger different downstream signaling pathways. As a specific ligand to FGFR2-IIIb, fibroblast growth factor 10 (FGF10) is expressed in the gastric mesenchyme cell and is involved in stomach development and morphogenesis, but its expression and clinical significance is not well elucidated in gastric cancer. We analyzed FGF10 expression by immunohistochemistry in 178 samples of gastric adenocarcinoma (134 male and 44 female patients, with the average age of 63.2 years old and the average follow-up of 21.6 months). Using the arbitrarily scoring method based on positive cell percentage and staining intensity, we sub-divided the patients into FGF10 high-expression group (58 patients) and low-expression group (120 patients). We thus found that FGF10 expression is significantly associated with lymph node invasion (P = 0.004) and distant metastasis (P = 0.032). Importantly, FGF10 expression is an independent unfavorable prognostic factor (P = 0.042). Moreover, FGF10 knockdown significantly decreased the migration of cultured gastric adenocarcinoma cells, suggesting that FGF10 could promote the invasion of gastric adenocarcinoma. In conclusion, FGF10 expression was identified as a poor prognostic biomarker in gastric adenocarcinoma, and FGF10 could promote the invasion of gastric cancer cells. We suggest that FGF10 could be a potential and promising drug target in gastric adenocarcinoma.
Introduction
Gastric cancer is one of the most common malignancies with increasing incidence worldwide (Torre et al. 2015). It accounts for about 8% of the total cases of cancer and 10% of total deaths, second only to lung cancer (Jemal et al. 2011). Gastric cancer is characterized of silent clinical features in early stage, although the rate of early diagnosis is elevating along with the development of endoscopy and radiography, which results in that many patients were diagnosed in advanced stage and lose surgical opportunity. In recent years, the finding of several biomarkers such as vascular endothelial growth factor (VEGF) and human epidermal growth factor receptor-2 (HER2) in gastric cancer immediately lead to the use of monoclonal antibodies targeted on gastric cancer and the increase of overall survival rate (Duff et al. 2003; Yasui et al. 2005; Stern 2012). However, the 5-year overall survival rate of gastric cancer in stage II is 30% to 50%, and in stage III is only 10% to 25% (Wohrer et al. 2004), which could be ascribed to the silent clinical features, early lymph metastasis and easy recurrence. Therefore, there are urgent requirements for predictive, prognostic and therapeutic biomarker in gastric cancer. Gastric adenocarcinoma is the most dominant histological type in gastric cancer, accounting for more than 90% (Macdonald 2006; Ma et al. 2010). It is generally accepted that different histological types usually have different pathogenesis and prognosis. Therefore, the research of new predictive, diagnostic or prognostic biomarkers for gastric cancer should be focused on gastric adenocarcinoma.
Fibroblast growth factor receptor 2 (FGFR2) is one of the fibroblast growth factor family, which consist of FGFR1, 2, 3, and 4. In FGFR family, it is generally acknowledged that FGFR2 is an effective biomarker and also a potential molecular target in gastric cancer (Kunii et al. 2008). Both FGFR2 gene amplification and protein overexpression have been demonstrated to be associated with poorer prognosis in gastric cancer (Hong et al. 2013; Su et al. 2014). Moreover, FGFR2 is considered as a therapeutic target in gastric cancer and monoclonal antibodies to FGFR2 have been demonstrated to inhibit gastric tumor growth in vivo (Zhao et al. 2010). More precisely, the pharmacological function of antibody to FGFR2-IIIb isoform was demonstrated by experiments in vitro with gastric cancer cell lines (Bai et al. 2010).
As generally acknowledged, FGFRs induce the downstream signaling pathway after interacting with their ligands, mostly FGFs, by which they play an essential role in basic cellular process like proliferation, migration or differentiation. In human beings, there were 22 FGFs discovered till now. Interestingly, the two isoforms of FGFR2, FGFR2-IIIb and FGFR2-IIIc, have different affinity to different FGFs (Hong et al. 2013). FGFR2-IIIb binds to FGF1, 3, 7, 10 and 22 more specifically, while FGFR2-IIIc has higher affinity to FGF1, 2, 4, 6, 8, 9, 17 and 18. Thus, FGF1 is a ligand to both FGFR2-IIIb and FGFR2-IIIc. Among these FGFs, FGF10 is generally considered as the specific ligand to FGFR2-IIIb (Dell and Williams 1992). Moreover, FGF10 was proved to be essential in the stomach development and morphogenesis. A previous study demonstrated that FGF10 is expressed in normal stomach mesenchyme cells just beneath the gastric glands, suggesting it may be involved in mesenchymal-to-epithelial signaling (Speer et al. 2012), but the pathologic role of FGF10 in gastric cancer was not elucidated. We thus suspected FGF10 as a potential biomarker in gastric adenocarcinoma and performed experiments to verify this hypothesis.
FGFR2 has attracted much attention in the study of gastric cancer, and the antibody to FGFR2-IIIb exhibited anti-tumor activity in gastric cell lines (Bai et al. 2010). However, the prognostic value of FGF10, the specific FGFR2-IIIb ligand, is still blank till now. In our study, we detected the expression of FGF10 in 178 cases of gastric adenocarcinoma, and analyzed the correlation between FGF10 and clinicopathologic parameters by Chi-square test. The prognostic value of FGF10 was evaluated with univariate and multivariate analyses, respectively. In addition, the expression levels of FGF10 were compared in different gastric adenocarcinoma cell lines using Western blotting analysis.
Patients and Methods
Patents and follow-up
Total of 225 patients were diagnosed as gastric adenocarcinoma and underwent surgical operation and in Qilu Hospital and Yishui Central Hospital from 2004 to 2010. These 225 patients comprised the primary cohort, from where the validation cohort was selected according to the criteria: (1) available tissue samples and medical records, (2) available follow-up, and (3) no severe perioperative complications. The validation cohort consisted of 178 patients, 134 males and 44 females, with the average age of 63.2 years old and the average follow-up of 21.6 months. All the tissue specimens were obtained with prior patient consent and approval of the Institutional Clinical Ethics Review Board of both Qilu Hospital and Yishui Central Hospital. The diagnosis of gastric adenocarcinoma was confirmed by two senior pathologists, and the tumor TNM stage was defined according to the guideline of 7th American Joint Committee on Cancer/Union for International Cancer Control.
Human cell lines and reagents
A gastric adenocarcinoma cell line, SNU1, was purchased from Cell Bank of the Chinese Academy of Sciences (Shanghai, China). A gastric adenocarcinoma cell line, SNU16, was from American Type Culture Collection (ATCC) (Manassas, USA). Gastric adenocarcinoma cell lines, MKN-7 and MKN-28, were purchased from RIKEN Bioresource Center (Tsukuba, Japan). All cell lines were cultured in RPMI-1640 medium (HyClone, USA) supplemented with 10% fetal bovine serum and 100 U/ml penicillin and 100 µg/ml streptomycin (HyClone, USA) in 5% CO2 resuscitation. All antibodies were purchased without special instruction from Santa Cruz Biotechnology (Santa Cruz, CA, USA). All reagents without special instruction was purchased from Sigma-Aldrich Corporation.
Immunohistochemistry and evaluation
The immunohistochemistry (IHC) was performed as described previously (Liu et al. 2015). Briefly, samples were first formalin-fixed and paraffin-embedded, then deparaffinized for 20 minutes and rehydrated in graded ethanol. The endogenous peroxidase activity was blocked by 3% hydrogen peroxide and antigen retrieval was achieved by heating in citrate buffer (pH = 6.0) with a microwave oven. Primary antibody dilution was used to incubate samples at 4°C overnight, followed by incubation in biotin-labeled secondary antibody (Beyotime Institute of Biotechnology, Shanghai, China). The samples were finally visualized with 3,3′-diaminobenzidine substrate and counterstained with hematoxylin. The negative control was incubated with phosphate-buffered saline instead of primary antibody, with other procedures all the same, while positive control was placental tissue sections that express FGF10. Each stained section was evaluated by two senior pathologists unaware of the clinical information, with conflicting cases adjudicated by a third pathologist. Five sights were selected randomly and observed with a light microscope for the immunohistochemistry. The score of positive cell percentage were as follows: 0, less than 10% positive cells; 1, 10%-30% positive cells; 2, 30-50% positive cells; and 3, > 50% positive cells. The score of staining intensity was defined as: 0 for negative staining, 1 for weak staining, 2 for moderate staining, and 3 for strong staining. IHC total score was calculated as the product of positive cells multiplied by staining intensity, which ranged from 0 to 9. The cut-off was arbitrarily defined as: score ≥ 4 is high FGF10 expression and score < 4 is low FGF10 expression.
Matrigel invasion assay
Cell invasion was detected with transwell assay in 8-um-core matrigel-precoated transwell chamber (BD Biosciences Company, Franklin Lakes, NJ, USA). Cells were first transfected with FGF10 siRNA first, with control group only transfected with lipofectamine 2000 and without siRNA. Forty-eight hours after transfection, 105 cells were seeded into per well within DMEM containing 1% fetal bovine serum and incubated for 24 hours, with DMEM containing 10% fetal bovine serum as a chemoattractant in lower compartment. The invading cells of the lower surface were stained with crystal violet after cells of upper compartment swabbed. The wells were observed and invaded cell number was counted from at least eight fields per assay. Cell number without FGF10 knockdown was set as the baseline and the invasion index of siFGF10 group was calculated by the ratio of baseline. Data are presented as averages of triplicate experiments.
FGF10 knockdown and transfection
FGF10 knockdown siRNA and scrambled siRNA were purchased from Santa Cruz Company (sc-39462) according to previous report (Abolhassani et al. 2014). Transfection of siRNA into gastric cancer cells was performed with reagent RNAiMAX (Invitrogen Company, USA) according to the manual. Validation of successful FGF10 knockdown was performed by immunoblotting analysis.
Immunoblotting analysis
Gastric cancer cells were first lysed with RIPA lysis buffer (Beyotime Biotechnology, Shanghai, China), and then centrifuged at 10,000 × g for 15 minutes at 4°C. The superior was regarded as total cellular protein sample, and the concentration was quantified with Bradford detection kit. Equal amount protein (about 10 ug) was electrophoresed in SDS-PAGE gel, transferred to PVDF membrane (PALL Company, USA) and incubated in primary antibody (1:1,000) overnight in 4°C. After washed by Tris-buffered saline (TBS) for 3 times, the membrane was incubated in secondary antibody for 2 hours at 37°C and subsequently visualized by ECL (Millipore Corporation, Billerica, MA, USA).
Statistical analysis
All data were analyzed with software SPSS 13.0 (IBM Corporation, USA). Chi-square test was used to analyze the relation between FGF10 expression and other clinicopathologic parameters. Kaplan-Meier method was used to evaluate the correlation between FGF10 and overall survival rate. Cox proportional hazards regression model was used to analyze the independent prognostic factors. P value less than 0.05 was considered as statistically significant.
Results
Expression of FGF10 in gastric adenocarcinoma
In our experiment, FGF10 was mainly expressed in cytoplasm, which is consistent with the fact that it is a secreted growth factor (Fig. 1). According to the criteria described in Patients and Methods, the score of staining intensity was considered as 0, 1, 2 or 3, while score of positive cells also varied from 0 to 3. The total score was calculated by score of staining intensity × score of positive cell percentage, which ranged from 0 to 9. The cut-off of total score was set as 4, dividing the validation cohort into FGF10 high-expression group (mean ± SD: 5.26 ± 1.82) and low-expression group (mean ± SD: 1.30 ± 1.11). In the validation cohort, the percentage of FGF10 high-expression group is 32.5% (58/178).
Correlation between FGF10 expression and clinicopathologic parameters
To search for the parameters affecting FGF10-involved processes of gastric adenocarcinoma, we further analyzed the correlations between FGF10 expression and other clinicopathologic factors with Chi-square test (Table 1).
Patients with FGF10 high expression were turned out to have higher risk of positive lymphatic invasion (P = 0.004) and distant metastasis (P = 0.032), indicating that FGF10 high expression may promote the invasion of gastric adenocarcinoma. Moreover, FGF10 expression tended to be related with TNM stage, but the tendency is not statistically significant (P = 0.078), which also could be explained as a subsequent consequence of the association with lymphatic invasion and distant metastasis.
Prognostic value of FGF10
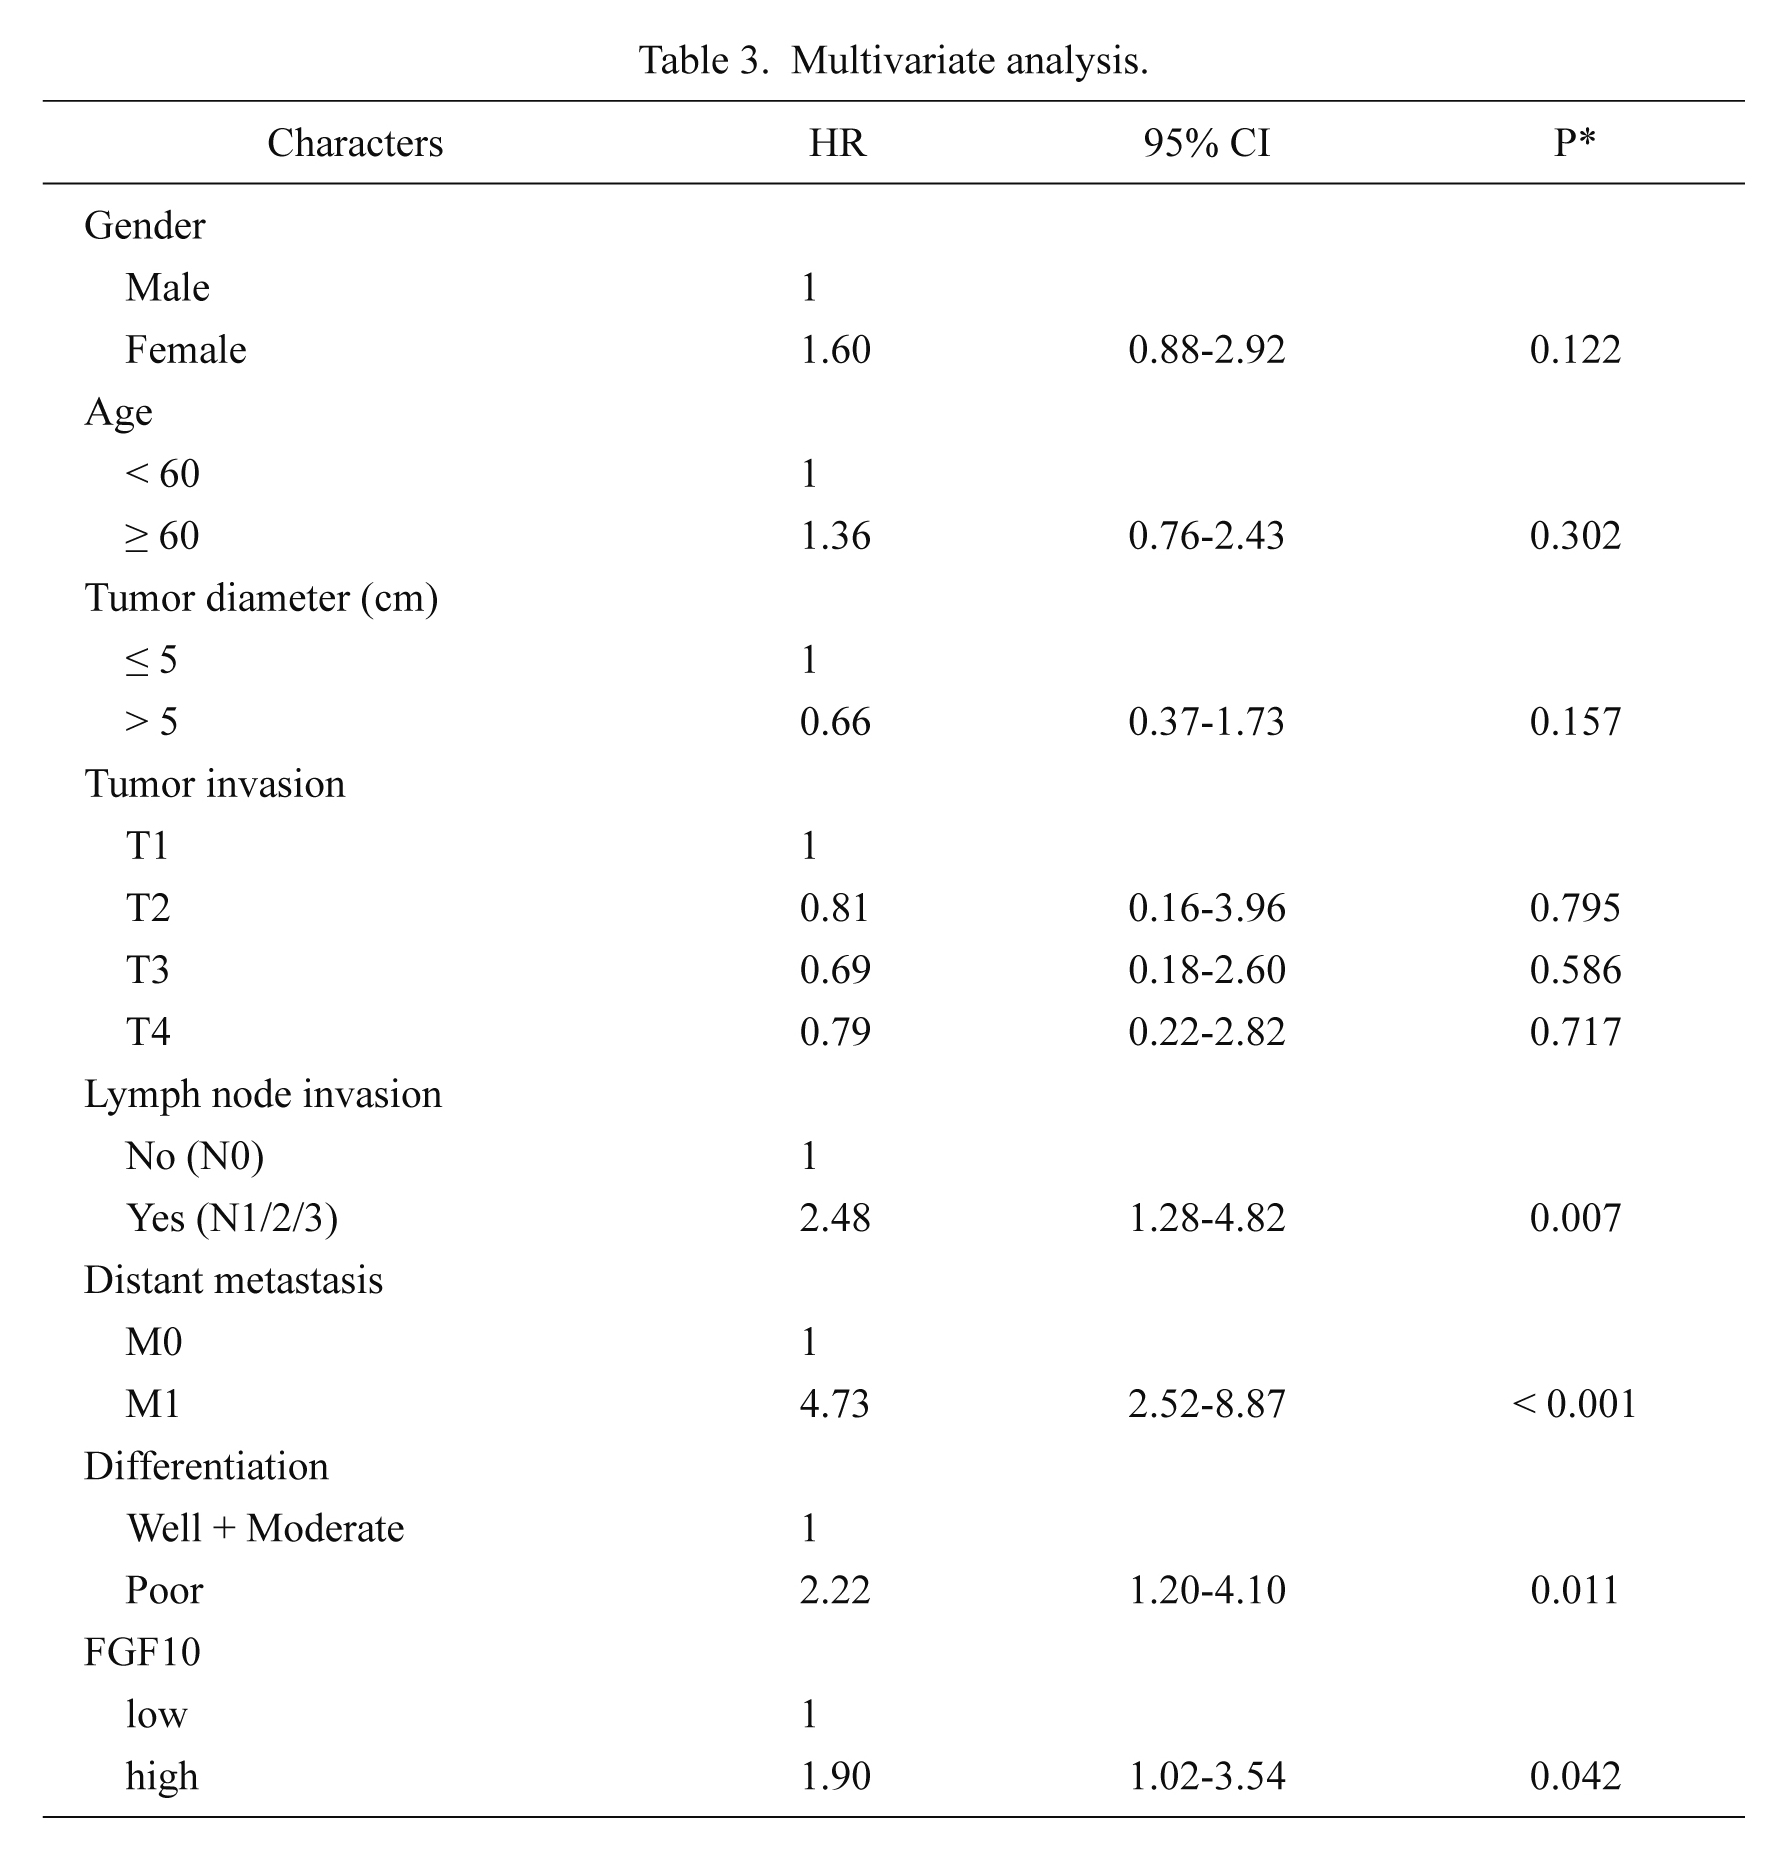
To evaluate the prognostic value of FGF10 in gastric adenocarcinoma, we further calculated the prognostic significance of FGF10 by univariate with Kaplan-Meier method and by multivariate analysis by Cox-regression model. The univariate analysis was first performed to examine the correlation between overall survival rate and clinicopathologic factors including FGF10 expression (Table 2). With Kaplan-Meier method, FGF10 high expression was proved to be associated with poorer prognosis of gastric adenocarcinoma (Fig. 2). Moreover, lymph node invasion, distant metastasis, differentiation and TNM stage were also identified as prognostic factors of gastric adenocarcinoma (P = 0.003, P < 0.001, P = 0.047 and 0.007, respectively). Furthermore, multivariate analysis was performed with Cox-regression model to confirm the independent prognostic factor. In multivariate analysis, FGF10 high expression was identified as an independent prognostic factor in gastric adenocarcinoma (P = 0.042), with hazard ratio as 1.90 (Table 3). Besides, the independent prognostic factors included lymph node invasion, distant metastasis and differentiation (P = 0.007, P < 0.001 and P = 0.011, respectively).

In the previous clinical analysis, we have observed that FGF10 high expression was significantly associated with lymphatic invasion and distant metastasis, pointing out the possibility that FGF10 may induce the invasion of gastric adenocarcinoma. So we performed experiments with gastric adenocarcinoma cell lines to examine it. Firstly, the expression of FGF10 and its specific ligand FGFR2 in different gastric cancer cell lines was first detected. These cell lines included SNU1, SNU16, MKN28 and MKN7. SNU1 was originated from a poorly differentiated primary carcinoma of the stomach. SNU16 was derived from metastatic site of gastric cancer. MKN28 and MKN7 were originated from a moderately differentiated gastric tubular adenocarcinoma. Interestingly, expression of FGF10 and FGFR2 varied much in different cell lines (Fig. 3A). SNU16 cells had the highest expression of FGF10 and FGFR2. This is interestingly consistent with the fact that SNU16 cells were derived from metastatic site of gastric cancer, suggesting that invaded tumor had higher expressive level of FGF10 and FGFR2 (Park et al. 1998). We observed that FGF10 expression is highly associated with lymphatic invasion and distant metastasis, so we hypothesized that FGF10 may play an important role in gastric cancer cell invasion. To verify this hypothesis, we conducted FGF10 RNA knockdown and confirm successful knockdown in SNU16 cells with immunoblotting analysis (Fig. 3B). Subsequently, we compared the invasive ability of SNU16 cells with or without FGF10 knockdown (Fig. 3C). As expected, the invasion of SNU16 cells was impaired after FGF10 knockdown, demonstrating that FGF10 could promote the invasion of gastric adenocarcinoma cells. The role of FGF10 in gastric cancer invasion indicated that FGF10 may function in the FGF10-FGFR2 paracrine pathway and suggested the therapeutic value of FGF10 as a potential drug target.

Discussion
In our study, we detected the expression of FGF10 and analyzed the correlation between it and overall survival rate for the first time. As the specific ligand of FGFR2, the acknowledged prognostic biomarker in gastric cancer, FGF10 was identified as an independent prognostic factor in gastric adenocarcinoma. Moreover, we demonstrated that FGF10 could promote the invasion of gastric adenocarcinoma cell lines with experiments in vitro, indicating that FGF10 may play the oncogenic role in a FGF10-FGFR2 paracrine pathway and that FGF10 could be considered as a potential drug target in gastric adenocarcinoma.
FGF family were broadly involved in cellular physiological and pathological processes including embryonic development, cell growth, morphogenesis, tissue repair, tumor growth and invasion (Turner et al. 2012). As a specific ligand of FGFR2 and one of FGF family, FGF10 had been proved to be associated with the progression and prognosis in many kinds of cancers, including breast cancer, lung cancer, and bladder cancer (Chung and Koh 2013; Abolhassani et al. 2014; Suzuki et al. 2015). Moreover, the oncogenic role of FGF10 paracrine signaling pathway has been revealed (Itoh and Ohta 2014). FGF10 exhibited mitogenic activity of epidermal cells instead of fibroblasts (Beer et al. 2005). A study of FGF10 homolog in the mouse has shown that FGF10 is a primary factor in the process of embryonic epidermal morphogenesis and wound healing (Ye et al. 2005), which supports the possible role of FGF10 in cancer invasion.
In our previous study, we demonstrated that FGF1 expression was significantly associated with poorer progression in gastric adenocarcinoma (Liu et al. 2015). However, FGF1 is a potent ligand to both FGFR2-IIIb and FGFR2-IIIc. Thus, it remains unclear whether the FGF1-triggered signaling pathway was mediated by FGFR2-IIIb or FGFR2-IIIc. The role of different isoforms of FGFR2 in gastric cancer is still controversy. Previous study pointed that monoclonal antibody to FGFR2-IIIb exhibited anti-tumor function in gastric cancer cell lines, suggesting the oncogenic role of FGFR2-IIIb. However, the evidence exploring the biased signaling pathway of FGFR2 different isoforms is still very little. Our results supported the oncogenic role of FGFR2-IIIb in gastric cancer indirectly and more profound studies should be performed to further confirm that.
The features of FGFR family are the presence of multiple isoforms and their crosstalk in signaling pathways. Different kinds of FGFs, FGFRs and their isoforms dramatically increase the redundancy complexity of FGFR signaling pathway. Besides FGF10, there are still more FGFR2 ligands to research and more mysteries to reveal, which needs more experiments to verify. The FGFR2 signaling in gastric cancer may be much complicated than only FGF1-FGFR2 and FGF10-FGFR2IIIb. We hope our series study of FGFR2 paracrine signaling pathway in gastric cancer can trigger more interest on FGFR2 signaling conduction and help developed effective therapeutic targeted drug and improve the survival time of patients suffering with gastric adenocarcinoma.
In conclusion, we detected the expression of FGF10 in gastric adenocarcinoma and analyzed the correlation between FGF10 and clinicopathologic features as well as overall survival rate. As a result, we found that FGF10 expression is significantly associated with lymphatic invasion, distant metastasis and poorer prognosis. With function assays, we demonstrated that FGF10 could induce the invasion of gastric cancer cells, suggesting the potential therapeutic role of FGF10 as a promising and potential drug target.
Acknowledgments
This study was supported by Research award fund for outstanding young scientists in Shandong Province (Grant No. BS2011YY016).
Conflict of Interest
The authors declare no conflict of interest.
References
-
Abolhassani,
A.,
Riazi,
G.H.,
Azizi,
E.,
Amanpour,
S.,
Muhammadnejad,
S.,
Haddadi,
M.,
Zekri,
A. &
Shirkoohi,
R.
(2014) FGF10: type III epithelial mesenchymal transition and invasion in breast cancer cell lines. J. Cancer, 5, 537-547.
-
Bai,
A.,
Meetze,
K.,
Vo,
N.Y.,
Kollipara,
S.,
Mazsa,
E.K.,
Winston,
W.M.,
Weiler,
S.,
Poling,
L.L.,
Chen,
T.,
Ismail,
N.S.,
Jiang,
J.,
Lerner,
L.,
Gyuris,
J. &
Weng,
Z.
(2010) GP369, an FGFR2-IIIb-specific antibody, exhibits potent antitumor activity against human cancers driven by activated FGFR2 signaling. Cancer Res., 70, 7630-7639.
-
Beer,
H.D.,
Bittner,
M.,
Niklaus,
G.,
Munding,
C.,
Max,
N.,
Goppelt,
A. &
Werner,
S.
(2005) The fibroblast growth factor binding protein is a novel interaction partner of FGF-7, FGF-10 and FGF-22 and regulates FGF activity: implications for epithelial repair. Oncogene, 24, 5269-5277.
-
Chung,
S.S. &
Koh,
C.J.
(2013) Bladder cancer cell in co-culture induces human stem cell differentiation to urothelial cells through paracrine FGF10 signaling. In Vitro Cell Dev. Biol. Anim., 49, 746-751.
-
Dell,
K.R. &
Williams,
L.T.
(1992) A novel form of fibroblast growth factor receptor 2. Alternative splicing of the third immunoglobulin-like domain confers ligand binding specificity. J. Biol. Chem., 267, 21225-21229.
-
Duff,
S.E.,
Li,
C.,
Jeziorska,
M.,
Kumar,
S.,
Saunders,
M.P.,
Sherlock,
D.,
O’Dwyer,
S.T. &
Jayson,
G.C.
(2003) Vascular endothelial growth factors C and D and lymphangiogenesis in gastrointestinal tract malignancy. Br. J. Cancer, 89, 426-430.
-
Hong,
L.,
Han,
Y.,
Liu,
J. &
Brain,
L.
(2013) Fibroblast growth factor receptor 2: a therapeutic target in gastric cancer. Expert Rev. Gastroenterol. Hepatol., 7, 759-765.
-
Itoh,
N. &
Ohta,
H.
(2014) Fgf10: a paracrine-signaling molecule in development, disease, and regenerative medicine. Curr. Mol. Med., 14, 504-509.
-
Jemal,
A.,
Bray,
F.,
Center,
M.M.,
Ferlay,
J.,
Ward,
E. &
Forman,
D.
(2011) Global cancer statistics. CA Cancer J. Clin., 61, 69-90.
-
Kunii,
K.,
Davis,
L.,
Gorenstein,
J.,
Hatch,
H.,
Yashiro,
M.,
Di Bacco,
A.,
Elbi,
C. &
Lutterbach,
B.
(2008) FGFR2-amplified gastric cancer cell lines require FGFR2 and Erbb3 signaling for growth and survival. Cancer Res., 68, 2340-2348.
-
Liu,
N.,
Zhang,
J.,
Sun,
S.,
Yang,
L.,
Zhou,
Z.,
Sun,
Q. &
Niu,
J.
(2015) Expression and clinical significance of fibroblast growth factor 1 in gastric adenocarcinoma. Onco. Targets Ther., 8, 615-621.
-
Ma,
B.B.,
Hui,
E.P. &
Mok,
T.S.
(2010) Population-based differences in treatment outcome following anticancer drug therapies. Lancet Oncol., 11, 75-84.
-
Macdonald,
J.S.
(2006) Gastric cancer: new therapeutic options. N. Engl. J. Med., 355, 76-77.
-
Park,
I.C.,
Park,
M.J.,
Lee,
S.H.,
Choe,
T.B.,
Jang,
J.J. &
Hong,
S.I.
(1998) Increased susceptibility of the c-Myc overexpressing cell line, SNU-16, to TNF-alpha. Cancer Lett., 125, 17-23.
-
Speer,
A.L.,
Al Alam,
D.,
Sala,
F.G.,
Ford,
H.R.,
Bellusci,
S. &
Grikscheit,
T.C.
(2012) Fibroblast growth factor 10-fibroblast growth factor receptor 2b mediated signaling is not required for adult glandular stomach homeostasis. PLoS One, 7, e49127.
-
Stern,
H.M.
(2012) Improving treatment of HER2-positive cancers: opportunities and challenges. Sci. Transl. Med., 4, 127rv2.
-
Su,
X.,
Zhan,
P.,
Gavine,
P.R.,
Morgan,
S.,
Womack,
C.,
Ni,
X.,
Shen,
D.,
Bang,
Y.J.,
Im,
S.A.,
Ho Kim,
W.,
Jung,
E.J.,
Grabsch,
H.I. &
Kilgour,
E.
(2014) FGFR2 amplification has prognostic significance in gastric cancer: results from a large international multicentre study. Br. J. Cancer, 110, 967-975.
-
Suzuki,
T.,
Yasuda,
H.,
Funaishi,
K.,
Arai,
D.,
Ishioka,
K.,
Ohgino,
K.,
Tani,
T.,
Hamamoto,
J.,
Ohashi,
A.,
Naoki,
K.,
Betsuyaku,
T. &
Soejima,
K.
(2015) Multiple roles of extracellular fibroblast growth factors in lung cancer cells. Int. J. Oncol., 46, 423-429.
-
Torre,
L.A.,
Bray,
F.,
Siegel,
R.L.,
Ferlay,
J.,
Lortet-Tieulent,
J. &
Jemal,
A.
(2015) Global cancer statistics, 2012. CA Cancer J. Clin., 65, 87-108.
-
Turner,
C.A.,
Watson,
S.J. &
Akil,
H.
(2012) The fibroblast growth factor family: neuromodulation of affective behavior. Neuron, 76, 160-174.
-
Wohrer,
S.S.,
Raderer,
M. &
Hejna,
M.
(2004) Palliative chemotherapy for advanced gastric cancer. Ann. Oncol., 15, 1585-1595.
-
Yasui,
W.,
Oue,
N.,
Aung,
P.P.,
Matsumura,
S.,
Shutoh,
M. &
Nakayama,
H.
(2005) Molecular-pathological prognostic factors of gastric cancer: a review. Gastric Cancer, 8, 86-94.
-
Ye,
F.,
Duvillie,
B. &
Scharfmann,
R.
(2005) Fibroblast growth factors 7 and 10 are expressed in the human embryonic pancreatic mesenchyme and promote the proliferation of embryonic pancreatic epithelial cells. Diabetologia, 48, 277-281.
-
Zhao,
W.M.,
Wang,
L.,
Park,
H.,
Chhim,
S.,
Tanphanich,
M.,
Yashiro,
M. &
Kim,
K.J.
(2010) Monoclonal antibodies to fibroblast growth factor receptor 2 effectively inhibit growth of gastric tumor xenografts. Clin. Cancer Res., 16, 5750-5758.