Abstract
The relationship between Parkinson’s disease (PD) and olfactory dysfunction has been investigated via psychophysical and electrophysiological assessments. Despite the increasing number of electrophysiological studies focusing on olfactory function, there are still some limitations to observe the chemosensory event-related potentials (CSERP), which are electrophysiological responses of the brain to olfactory and trigeminal stimulations, because of the low sensitivity (low signal-to-noise ratio). Recent studies attempted to establish new techniques to increase the sensitivity for evaluating the CSERP and brain responsiveness. We aimed to inspect CSERP via entropy analysis in assessing chemosensory related brain responses that has been used for the first time. Twelve newly diagnosed and non-medicated PD patients and 12 healthy subjects participated in the study. Psychophysical and electrophysiological evaluation of olfaction were assessed via Sniffin’ Sticks Test (SST) and entropy analysis on CSERP in three time windows. The scores of odor threshold, odor identification and total scores of SST were lower (hyposmic) in PD patients compared to healthy subjects. Electrophysiological assessments revealed a significant change in entropy among time windows for olfactory stimulation with phenyl ethyl alcohol and trigeminal stimulation with carbon dioxide (both p < 0.05) in healthy subjects but not in PD patients. Entropy findings indicate that the brain operates in ordered state among healthy subjects in response to olfactory/trigeminal stimuli, whereas the PD patients displayed a chaotic pattern. This pattern in the PD patients suggests the lack of proper smell function. It should be studied if this pattern can be used as a biomarker for PD.
Introduction
Functionality of the olfactory system has an important role in precaution, nutrition, and quality of life (Doty 2009). The elements of the olfactory system have not yet been well understood despite its importance. Olfactory dysfunction has been studied in attention deficit hyperactivity disorders (Sanders and Gillig 2009), diabetes mellitus and Addison’s disease, cortisone or antibiotics use, alcohol abuse (Sanders and Gillig 2009), congenital disorders, such as Down syndrome, Kallmann syndrome, CHARGE syndrome (Yousem et al. 1996; Huart et al. 2011), Alzheimer’s disease (Schubert et al. 2008), and Parkinson’s disease (PD) (Leboucq et al. 2013) for the last two decades.
The association between PD and olfactory dysfunction has been first presented by Ansari and Johnson (1975). In 1980’s, Quinn et al. (1987) and Ward et al. (1983) reported more findings of olfactory dysfunction in PD. In 1988, Doty et al. (1988) showed that there is no odorant that is specific to PD detected with the University of Pennsylvania Smell Identification Test (UPSIT), a psychophysical olfactory test. In contrast to this finding, Hawkes and Shephard (1993) suggested that PD patients might have a specific anosmia. Supporting these findings, Daum et al. (2000), Double et al. (2003), and Silveira-Moriyama et al. (2005) obtained similar results to those of Hawkes and Shephard (1993). However according to one of the recent reports on PD and specific hyposmia/anosmia, Haehner et al. (2013) showed that there is no specific hyposmia in PD.
An emphasis on the estimation of risk and early diagnosis of PD based on its non-motor symptoms is observed in recent studies (Pont-Sunyer et al. 2015). In one study conducted on the sense of smell, it has been suggested that PD may be detected by the presence of anosmia together with executive dysfunctions long before motor symptoms occur (Ponsen et al. 2009). Additionally, hyposmia or anosmia has been reported to be an important indicator for PD and this condition has been supported by morphological studies pointing out PD to coexist with olfactory bulbus atrophy (Wang et al. 2011).
In general, olfactory function has been evaluated via psychophysical tests. Electrophysiological studies on the olfactory system have increased; especially after the invention of odorant controlled system (Kobal 1981) which is named as olfactometer. Chemosensory event-related potentials (CSERP) approach -electrophysiological brain responses to olfactory and trigeminal stimulations- is one of the most efficient methods used to evaluate the dysfunction of the olfactory system (Stuck et al. 2006; Morgan and Murphy 2010). Despite its objectivity, CSERP has some limitations due to temporal jitter and low stimulus number (Boesveldt et al. 2007). Furthermore another study showed that CSERP could be observed by only 70% probability in subjects who had normal olfactory function (Lötsch and Hummel 2006). On the other hand, another study indicates that background noise level is high in pathological conditions (Boesveldt et al. 2007).
Accordingly the efforts targeting the objective display of olfactory dysfunction has been vastly shadowed by the noise conditions. Due to these limitations, researchers have tried to eliminate the noise in the CSERP. In line with this, Huart et al. (2012, 2013) suggested different techniques to analyze the CSERP. Olcay (2014) suggested different techniques to capture the CSERP related components, which could be hidden at ongoing Electroencephalography (EEG). This research focused on entropy evaluation of normal olfactory function compared to olfactory dysfunctions (i.e. anosmic, hyposmic vs. normosmic subjects). Besides the increased signal-to-noise level, the overall electrophysiological response seems to be “null”, not displaying a response curve.
In the present study we aimed to develop a novel technique for assessment and analysis of CSERP olfactory electrophysiological responses via entropy analysis. We propose the usage of this method especially for the problematic conditions with limited sweep numbers and poorer signal quality (i.e. olfactory dysfunction). Here, the entropy is defined as the measure of disorder of any system. The concept of entropy enables the determination of changes in the brain due to internal/external stimulation. The change of entropy might be evaluated using the signal’s frequency content’s power distribution over time.
Materials and Methods
Twelve newly diagnosed (de novo) PD patients (7 male; mean age: 53.92 ± 9.04 years) and 12 healthy controls (7 male; mean age: 52.42 ± 7.69) were included in the study. Modified Hoehn and Yahr stage scores of PD patients were varied between “0-2.5” (Goetz et al. 2004). The control participants had no previous diagnosis of any neurological or psychiatric disorder. All of the subjects’ history was taken and examined by the same ENT specialist before the olfactory testing in order to exclude any sinonasal pathologies such as allergic or infectious rhinitis, rhinosinusitis with or without polyps, or significant nasal septal deviation which might negatively affect olfactory function. The informed consents were taken before participation to the study. The study has been approved by the Clinical Ethical Committee of Dokuz Eylul University.
The psychophysical olfactory evaluation for both the PD patients and the control group was carried out with Sniffin’ Sticks Test (SST) (Hummel et al. 2007). The olfactory threshold, discrimination, and identification scores were calculated. The Turkish version (Oniz et al. 2013) of SST identification test, which was modified for the local population, was employed for obtaining olfactory identification scores.
Chemosensory stimuli were presented using an olfactometer (Om2b, Burghart M.T., Germany). Two different types of stimuli were used in the olfactometer as chemosensory stimuli: 2-phenyl-ethyl-alcohol (PEA) as olfactory stimulant and carbon dioxide (CO2) as trigeminal stimulant. Stimulus intensities were set at 60% v/v for PEA and 50-60% v/v for CO2. The stimulus duration was selected as 200 milliseconds (ms). Interstimulus interval ranged between 15-17 seconds and was randomly assigned via a computer.
The EEG recordings were conducted using 64-channel recording system (Synamps64, Compumedics Neuroscan Inc., Australia), embedded interactive stimulus unit (EMISU) (Ozgoren et al. 2009), the olfactometer, and additional hardware. The participants’ EEG recordings were carried out in a special room with electromagnetic and acoustic isolation. SCAN 4.3 was used to assess the EEG recordings and analysis. The vertical electrooculogram (VEOG) was recorded by placing electrodes 2 cm below and above the left eye.
EEG data were digitized at 1 kHz sampling frequency and filtered with a 50-Hz notch filter to attenuate the power line effects in recordings. EEG epochs were started from −1000 ms before stimulus and lasted until 2000 ms after stimulus. Trials, in which ocular activity exceeded 50 µV, were discarded. Following artifact rejection the signals were corrected to baseline. Additionally, offline band-pass filter with low cutoff frequency 0.5 Hz and high cutoff frequency 48 Hz was applied and then epochs were averaged. CZ electrode was used for further analysis.
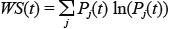
The calculation of time related Shannon entropy was carried out by calculating the relative energy of each frequency within small rectangular windows in the time domain. Once the relative energies were calculated, the entropy was evaluated according to the formula below via MATLAB (Shannon and Weaver 1949).
The CMOR (complex Morlet) main wavelet function -commonly employed in literature- was used for frequency and entropy analysis related to brain responses to chemosensory stimuli with the same parameters used by Huart et al. (2012). The aim of the frequency analysis was to determine the similarity between the compressed (or extended) and shifted versions, in the frequency plane, of the main wavelet function of the EEG signal frequency components obtained from the CZ channel. Based on the above-mentioned similarity coefficients, the entropy change over time of the EEG recording was calculated using these wavelet coefficients and the Shannon entropy formula. Entropy values were normalized within the range of “0” to “1”, with “0” representing the minimum entropy value and “1” representing the maximum entropy value. Mean entropy values were calculated for both groups at three different time windows and evaluated for pre-stimulus, post-stimulus, and late post-stimulus periods. Time windows were set at [−800, 0], [300, 1100], and [1400, 1900] ms intervals and named as TW1, TW2, and TW3, respectively.
Statistical analysis
Descriptive Statistics of the data were calculated and normality was determined via Shapiro-Wilk tests. For the psychophysical evaluation, the t-test was performed for comparisons between the PD patients and control groups. Threshold of the statistical significance for “p” value was set to “0.05”. Friedman test was employed to compare entropy values for each group under three different time windows. Also, for the Post-Hoc analysis Wilcoxon test was employed for the paired comparisons of entropy values of time windows (i.e. TW1-TW2, TW2-TW3, TW1-TW3).
Results
Psychophysical test results
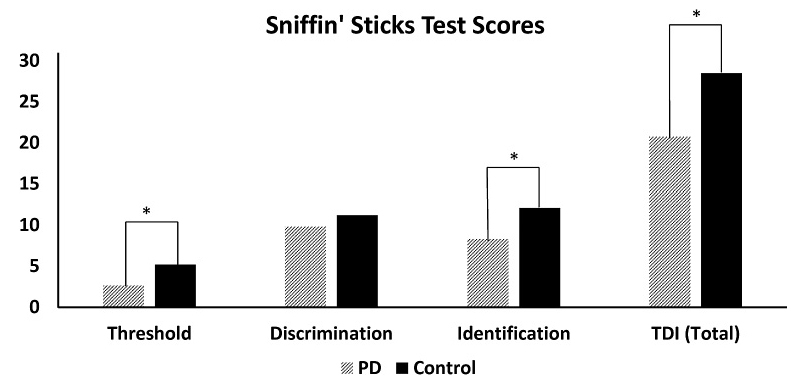
The SST was applied to 10 of the patients with PD. The two of the 12 patients who reported feeling uncomfortable during the test were dropped out. Data obtained from SST of 10 PD (7 male; with mean age of 55.5 ± 9.3) patients and age and sex-matched 10 control group participants (7 male; with mean age of 54.0 ± 6.6) were evaluated. There was no significant difference between groups in respect to age. Mean threshold scores were 2.6 (SD: ± 1.9) for PD patients and 5.2 (± 2.0) for control group, and mean discrimination scores for PD patients and control group were 9.8 (± 2.4) and 11.2 (± 2.4), respectively. Additionally, identification scores were 8.3 (± 3.2) for PD patients and 12.1 (± 1.8) for control group respectively. The PD patients scored 20.7 (± 5.7) where the control group scored 28.5 (± 4.3) in total. Therefore, the PD patients behaviorally have been found to be “hyposmic”.
Statistically significant differences were found in favor of the control group for odor threshold, odor identification, and total scores of SST (p < 0.01 for each) when the groups were compared via t-tests by means of threshold, discrimination, identification, and total scores of SST. No statistically significance was found in odor discrimination scores of SST. All mean SST scores are demonstrated in Fig. 1.
Entropy results
The data collected from twelve newly diagnosed PD patients (7 male; mean age: 53.9 ± 9.1 years) and 12 healthy control subjects (7 male; mean age: 52.4 ± 7.7) were included to evaluate the entropy. As the measures obtained from the PD patients and control groups for PEA and CO2 sessions were not found to have a normal distribution, non-parametric tests were conducted for statistical analysis. Averaged CSERP signal, scalogram, and entropy values of CSERP are demonstrated for one subject from each group to both stimuli in Fig. 2.
The difference between entropy values of time windows in the control group for both PEA and CO2 sessions were investigated with Friedman tests. Statistically significant differences were found between time windows (both p < 0.05). Wilcoxon test was conducted for paired comparisons to determine statistical differences between entropy values of time windows. Statistical differences were found between TW1 (.87)-TW2 (.79) and TW2 (.79)-TW3 (.87) in PEA session (both p < 0.05). Also statistical differences were found between TW1 (.90)-TW2 (.83) (p < 0.05) and TW2 (.83)-TW3 (.90) in CO2 session (both p < 0.005). A decrease in entropy was observed from TW1 to TW2 and an entropy increase was observed from TW2 to TW3 in both PEA and CO2 sessions.
Differences between entropy values of time windows in the PD patients for both the PEA and CO2 sessions were investigated with Friedman test and no significant differences were found between the three time windows in each condition (Entropy values in PEA session; TW1: .88, TW2: .86, TW3: .95 and in CO2 session; TW1: .93, TW2: .87, TW3: .93).
Discussion
Our study has displayed hyposmia using psychophysical tests in de novo PD patients. Furthermore the recently developed entropy method has proven to be useful, even with the highest noise levels. The electrophysiological entropy results verified the deteriorated olfactory functioning in PD patients whereas a clear entropy transition pattern pointing out intact functions was found in control subjects.
Event related potentials related to olfaction are known to have higher noise due to temporal jittering and due to fewer numbers of stimuli compared to visual or auditory stimulations (Boesveldt et al. 2007). In our study we have observed a similar problem with the increased jitter and noise especially in PD patients. On the other hand, possibility of failure to observe CSERP in even healthy individuals (Lötsch and Hummel 2006) is a limiting factor in the use of electrophysiological measurements as an indicator. However the possibility to use the CSERP has become applicable as a possible biomarker tool with our new technique opposed.
There are a limited number of studies in which brain responsiveness to chemosensory stimuli was investigated using frequency analysis (Huart et al. 2012, 2013; Olcay 2014). Huart et al. (2012, 2013) were especially in search of a new method to increase signal to noise ratio. Huart et al. (2013) applied this novel method to the CSERP recordings obtained from normosmic, hyposmic, and anosmic individuals. It was confirmed that even though an individual was evaluated as anosmic by means of psychophysiological tests, olfactory function was found to be preserved when frequency analysis was applied according to the results of the study mentioned above. The study of Huart et al. (2013) validated the possible use of frequency analysis in the clinical setting. Our results clearly showed a decreased behavioral performance for PD patients (hyposmic) and failure to display CSERP entropy transition indicating a troubled smell function. Frequency patterns in PD patients were observed to be somewhat higher than controls in this manner. This analysis could not be conducted at a sufficiently large group and therefore was not reported in this current study. These observations support the prediction by Huart et al. (2013) that de-synchronization -which causes higher frequency activity on background EEG- may increase especially in various pathological cases.
In addition, the CSERP recordings of normosmic, hyposmic, and anosmic individuals were subjected to frequency analysis and the participant’s responses and frequency analysis results were compared in the study conducted by Olcay (2014). Besides, another wavelet denoising method was carried out on the CSERP recordings to make CSERP components more visible. In the same study, the change of entropy was investigated and compared across three different time windows. These comparisons revealed that entropy values decreased towards “0” after the stimulus was presented and then increased only in normosmic group afterwards (Olcay 2014). In the literature, entropy values approaching to “0” were considered to reflect more regular and integrated brain processing “as a whole” (Basar 2006). Another interesting finding obtained from entropy analysis carried out in the scope of this present study, lends further support to this notion. While the entropy value when stimulus was presented (post-stimulus) was significantly lower compared to pre-stimulus and late post-stimulus periods in the control group, no statistical difference was found in entropy values of pre-stimulus, post-stimulus, and late post-stimulus for PD patients. This is a critical finding where the lack of entropy transition reflects olfactory dysfunction.
The regular functioning of the brain implies that the pre-stimulus chaotic state in the brain of healthy subjects is to be replaced by a regular pattern when the stimulus is presented and thus to return to a chaotic state following stimulus response. In contrast with this, in the light of entropy results, “continuous chaotic state” of PD patients during the processing of chemosensory stimuli is concluded to indicate that the functioning of the brain has been disturbed due to pathology. This situation requires further clarification in future studies in different pathologies that causes olfactory dysfunction. This novel technique is promising to become a useful tool for reassessing patients who are difficult to diagnose and those who are found to be anosmic, since entropy analysis might bring some of the hidden information of the signals to surface.
Acknowledgments
This study was granted as a doctoral thesis by Dokuz Eylul University, Department of Scientific Research Projects coded by 2012.KB.SAG.083. Assist. Prof. Dr. Emre Çek contributed to the verification of MATLAB routines, Bilal Orkan Olcay contributed to the calculation of entropy and comments on the manuscript, Dr. Behice Bircan Kursun and Dr. Didem Oz performed neurological evaluation of patients, and Ipek Ergonul commented and edited the manuscript.
Conflict of Interest
The authors declare no conflict of interest.
References
-
Ansari,
K.A. &
Johnson,
A.
(1975) Olfactory function in patients with Parkinson’s disease. J. Chronic Dis., 28, 493-497.
-
Basar,
E.
(2006) The theory of the whole-brain-work. Int. J. Psychophysiol., 60, 133-138.
-
Boesveldt,
S.,
Haehner,
A.,
Berendse,
H.W. &
Hummel,
T.
(2007) Signal-to-noise ratio of chemosensory event-related potentials. Clin. Neurophysiol., 118, 690-695.
-
Daum,
R.F.,
Sekinger,
B.,
Kobal,
G. &
Lang,
C.J.G.
(2000) Riechprüfung mit “sniffin’ sticks” zur klinischen Diagnostik des Morbus Parkinson. Nervenarzt, 71, 643-650.
-
Doty,
R.L.
(2009) The olfactory system and its disorders. Semin. Neurol., 29, 74-81.
-
Doty,
R.L.,
Deems,
D.A. &
Stellar,
S.
(1988) Olfactory dysfunction in parkinsonism: a general deficit unrelated to neurologic signs, disease stage, or disease duration. Neurology, 38, 1237-1244.
-
Double,
K.L.,
Rowe,
D.B.,
Hayes,
M.,
Chan,
D.K.Y.,
Blackie,
J.,
Corbett,
A.,
Joffe,
R.,
Fung,
V.S.,
Morris,
J. &
Halliday,
G.M.
(2003) Identifying the pattern of olfactory deficits in Parkinson disease using the brief smell identification test. Arch. Neurol., 60, 545-549.
-
Goetz,
C.G.,
Poewe,
W.,
Rascol,
O.,
Sampaio,
C.,
Stebbins,
G.T.,
Counsell,
C.,
Giladi,
N.,
Holloway,
R.G.,
Moore,
C.G.,
Wenning,
G.K.,
Yahr,
M.D. &
Seidl,
L.
(2004) Movement Disorder Society Task Force report on the Hoehn and Yahr staging scale: status and recommendations. Mov. Disord., 19, 1020-1028.
-
Haehner,
A.,
Maboshe,
W.,
Baptista,
R.B.,
Storch,
A.,
Reichmann,
H. &
Hummel,
T.
(2013) Selective hyposmia in Parkinson’s disease? J. Neurol., 260, 3158-3160.
-
Hawkes,
C.H. &
Shephard,
B.C.
(1993) Selective anosmia in Parkinson’s disease? Lancet, 341, 435-436.
-
Huart,
C.,
Legrain,
V.,
Hummel,
T.,
Rombaux,
P. &
Mouraux,
A.
(2012) Time-frequency analysis of chemosensory event-related potentials to characterize the cortical representation of odors in humans. PLoS One, 7, e33221.
-
Huart,
C.,
Meusel,
T.,
Gerber,
J.,
Duprez,
T.,
Rombaux,
P. &
Hummel,
T.
(2011) The depth of the olfactory sulcus is an indicator of congenital anosmia. AJNR Am. J. Neuroradiol., 32, 1911-1914.
-
Huart,
C.,
Rombaux,
P.,
Hummel,
T. &
Mouraux,
A.
(2013) Clinical usefulness and feasibility of time-frequency analysis of chemosensory event-related potentials. Rhinology, 51, 210-221.
-
Hummel,
T.,
Kobal,
G.,
Gudziol,
H. &
Mackay-Sim,
A.
(2007) Normative data for the “Sniffin’ Sticks” including tests of odor identification, odor discrimination, and olfactory thresholds: an upgrade based on a group of more than 3,000 subjects. Eur. Arch. Otorhinolaryngol., 264, 237-243.
-
Kobal,
G.
(1981) Elektrophysiologische Untersuchungen des menschlichen Geruchssinns, Thieme Verlag, Stuttgart.
-
Leboucq,
N.,
Menjot de Champfleur,
N.,
Menjot de Champfleur,
S. &
Bonafé,
A.
(2013) The olfactory system. Diagn. Interv. Imaging, 94, 985-991.
-
Lötsch,
J. &
Hummel,
T.
(2006) The clinical significance of electrophysiological measures of olfactory function. Behav. Brain Res., 170, 78-83.
-
Morgan,
C.D. &
Murphy,
C.
(2010) Differential effects of active attention and age on event-related potentials to visual and olfactory stimuli. Int. J. Psychophysiol., 78, 190-199.
-
Olcay,
B.O.
(2014) Analysis of Olfactory Evoked Potentials, M.Sc. Thesis. Izmir Institute of Technology, Urla, Izmir.
-
Oniz,
A.,
Erdogan,
I.,
Ikiz,
A.O.,
Evirgen,
N. &
Ozgoren,
M.
(2013) The Modified Sniffin’ Sticks Test in Turkish Population Based on Odor Familiarity Survey. J. Neurol. Sci. Turk., 30, 270-280.
-
Ozgoren,
M.,
Erdogan,
U.,
Bayazit,
O.,
Taslica,
S. &
Oniz,
A.
(2009) Brain asymmetry measurement using EMISU (embedded interactive stimulation unit) in applied brain biophysics. Comput. Biol. Med., 39, 879-888.
-
Ponsen,
M.M.,
Stoffers,
D.,
Twisk,
J.W.R.,
Wolters,
E.C. &
Berendse,
H.W.
(2009) Hyposmia and executive dysfunction as predictors of future Parkinson’s disease: a prospective study. Mov. Disord., 24, 1060-1065.
-
Pont-Sunyer,
C.,
Hotter,
A.,
Gaig,
C.,
Seppi,
K.,
Compta,
Y.,
Katzenschlager,
R.,
Mas,
N.,
Hofeneder,
D.,
Brücke,
T.,
Bayés,
A.,
Wenzel,
K.,
Infante,
J.,
Zach,
H.,
Pirker,
W.,
Posada,
I.J., et al.
(2015) The onset of nonmotor symptoms in Parkinson’s disease (the ONSET PD study). Mov. Disord., 30, 229-237.
-
Quinn,
N.P.,
Rossor,
M.N. &
Marsden,
C.D.
(1987) Olfactory threshold in Parkinson’s disease. J. Neurol. Neurosurg. Psychiatry, 50, 88-89.
-
Sanders,
R.D. &
Gillig,
P.M.
(2009) Cranial nerve I: olfaction. Psychiatry (Edgmont), 6, 30-35.
-
Schubert,
C.R.,
Carmichael,
L.L.,
Murphy,
C.,
Klein,
B.E.K.,
Klein,
R. &
Cruickshanks,
K.J.
(2008) Olfaction and the 5-year incidence of cognitive impairment in an epidemiological study of older adults. J. Am. Geriatr. Soc., 56, 1517-1521.
-
Shannon,
C.E. &
Weaver,
W.
(1949) The mathematical theory of communication, University of Illinois Press, Champaign, IL.
-
Silveira-Moriyama,
L.,
Williams,
D.,
Katzenschlager,
R. &
Lees,
A.
(2005) Pizza, mint, and licorice: smell testing in Parkinson’s disease in a UK population. Mov. Disord., 20, 139.
-
Stuck,
B.A.,
Frey,
S.,
Freiburg,
C.,
Hörmann,
K.,
Zahnert,
T. &
Hummel,
T.
(2006) Chemosensory event-related potentials in relation to side of stimulation, age, sex, and stimulus concentration. Clin. Neurophysiol., 117, 1367-1375.
-
Wang,
J.,
You,
H.,
Liu,
J.F.,
Ni,
D.F.,
Zhang,
Z.X. &
Guan,
J.
(2011) Association of olfactory bulb volume and olfactory sulcus depth with olfactory function in patients with Parkinson disease. AJNR Am. J. Neuroradiol., 32, 677-681.
-
Ward,
C.D.,
Hess,
W.A. &
Calne,
D.B.
(1983) Olfactory impairment in Parkinson’s disease. Neurology, 33, 943-946.
-
Yousem,
D.M.,
Geckle,
R.J.,
Bilker,
W.,
McKeown,
D.A. &
Doty,
R.L.
(1996) MR evaluation of patients with congenital hyposmia or anosmia. AJR Am. J. Roentgenol., 166, 439-443.