Abstract
The 2011 Tohoku-Oki Earthquake is a typical subduction-zone earthquake and is the 4th largest earthquake after the beginning of instrumental observation of earthquakes in the 19th century. In fact, the 2011 Tohoku-Oki Earthquake displaced the northeast Japan island arc horizontally and vertically. The displacement largely changed the tectonic situation of the arc from compressive to tensile. The 9th century in Japan was a period of natural hazards caused by frequent large-scale earthquakes. The aseismic tsunamis that inflicted damage on the Japan Sea coast in the 11th century were related to the occurrence of massive earthquakes that represented the final stage of a period of high seismic activity. Anti-compressive tectonics triggered by the subduction-zone earthquakes induced gravitational instability, which resulted in the generation of tsunamis caused by slope failing at the arc-back-arc boundary. The crustal displacement after the 2011 earthquake infers an increased risk of unexpected local tsunami flooding in the Japan Sea coastal areas.
Introduction
Authenticated chronicles that recorded daily events in Japan refer to the occurrence of a highly destructive disaster on the 26th of May in the 11th year of the Jogan Era (July 13, AD 869). The literary style describing the disaster is very concise, consisting of 151 kanji characters; however, the contents are quite surprising. According to the archives, a great earthquake (the AD 869 Jogan Earthquake, moment magnitude > 8.3-8.6) (Minoura et al. 2001; Namegaya and Satake 2014) took place off the Pacific coast of northeast Japan at midnight on May 26, destroying the strongly-built walled town situated in the northern part of the Sendai plain. The earthquake was followed by a gigantic tsunami, which reached the coast after a while and washed away everything. The description that seawater flooded the whole surface of the earth, deeply submerging the land, infers extensive sinking of the plain. The earthquake may have triggered crustal subsidence.
On March 11, 2011, the gigantic earthquake with moment magnitude of 9.0 took place in the offshore of the Pacific side of Tohoku region. The earthquake is the 4th largest one since the beginning of instrumental observation of earthquakes. Although the seismic intensity reached 7 in Tohoku region, damages to humans, buildings and other infrastructures were relatively limited, comparing with the tsunami damages (Ishigaki et al. 2013). The tsunami extensively flooded the coastal plains in Sendai Bay, ran up steep incised valleys in Sanriku Coast, caused nearly 19,000 deaths, most of reason was identified as drowning (Ishigaki et al. 2013), total destruction of coastal communities and infrastructures, and the fatal accident of the Fukushima Daiichi Nuclear Power Plant.
The earthquake was caused by the huge slip (up to 27 m near the epicentral area; Ozawa et al. 2011) of the fault that exists between the converging boundary of the oceanic (Pacific) and continental (North American) plates (subduction zone) (Fig. 1A). The Geospatial Information Authority of Japan operates GPS monitoring on the datum at 20 km intervals, and it was observed at the time of the 2011 earthquake that the northeast Japan arc moved horizontally (max. 5.3 m to the east) and vertically (max. 1.2 m downward) (Ozawa et al. 2011). The catastrophic lowering of stress caused by the large-scale destruction of the fore-arc crust resulted in gravitational deformation of the arc. The subsidence has recovered regionally to some extent since the 2011 earthquake; however, an E-W extension still exists in the arc. Given that the AD 869 Jogan Earthquake is a predecessor of the 2011 Tohoku-Oki Earthquake, we interpret the Jogan event to have reduced the plate convergence, possibly weakening the tectonic coupling between the arc and the back-arc.
Throughout the districts along the coast of Japan various documents and legends that recall tsunami disasters exist. Tradition has it that about 1,000 years ago an unexpected tsunami destroyed a small town facing the Japan Sea. The stricken town was situated on the coast where the present city of Masuda now stands in southwest Japan (Fig. 1A). On midnight of the 23th of May in the 3rd year of the Manju Era (June 16, AD 1026) the tsunami invaded the coast (but no earthquake was felt), causing devastating damage and a great loss of life (Matsui 1995). Minoura and Nakata (1994) discovered tsunami deposits in the coastal sequence of the Masuda plain and the adjoining basin (Shimotoda, Fig. 1A) and found that the deposits were formed by the AD 1026 Manjyu Tsunami (139 years after the AD 887 earthquake in the Nankai Trough). Water tank experiment results suggest that the tsunami was not of seismic origin but was generated by undersea slope failing. The bathymetric chart shows a well-preserved collapsed topography (Fig. 2A), indicating that the submarine slide was a recent event. There are no historical records of tsunami-genic earthquakes or eruptions that occurred in the Far East at that time (Matsui 1995); thus, this seabed feature may be evidence of an undersea slope collapse that caused the AD 1026 Manjyu Tsunami. Before entering to this study, we carried out a preliminary numerical modeling that takes into account the scale of the slope collapse and the volume of sediment transfer. The numerical result demonstrates that a tsunami generated in the area of the submarine slide struck the coast of Masuda (Fig. 3A; see the section “Numerical reconstruction of the tsunami events” below for the details). The modeled inundated area is consistent with the extent of flood damage estimated from recounts of local tradition and documents (Matsui 1995).
It is probable that undersea slope failing was the important mechanism of tsunami generation in the Japan Sea. Unexpected tsunami flooding has caused serious damages on the coast (Watanabe 1998). The 2011 Tohoku-Oki Earthquake largely changed the tectonic situation of the arc from compressive to tensile. The tectonic situation probably induced gravitational instability, which might have triggered slope collapse along the shelf break. Elucidating the cause of unexpected tsunamis is the urgent requisite for disaster prevention on the Japan Sea coast. We review the recent geological findings of unexpected tsunamis on the northern Japan Sea coast in the light of historical and tectonic data and numerical modeling.

Historical tsunami flooding on the Japan Sea coast
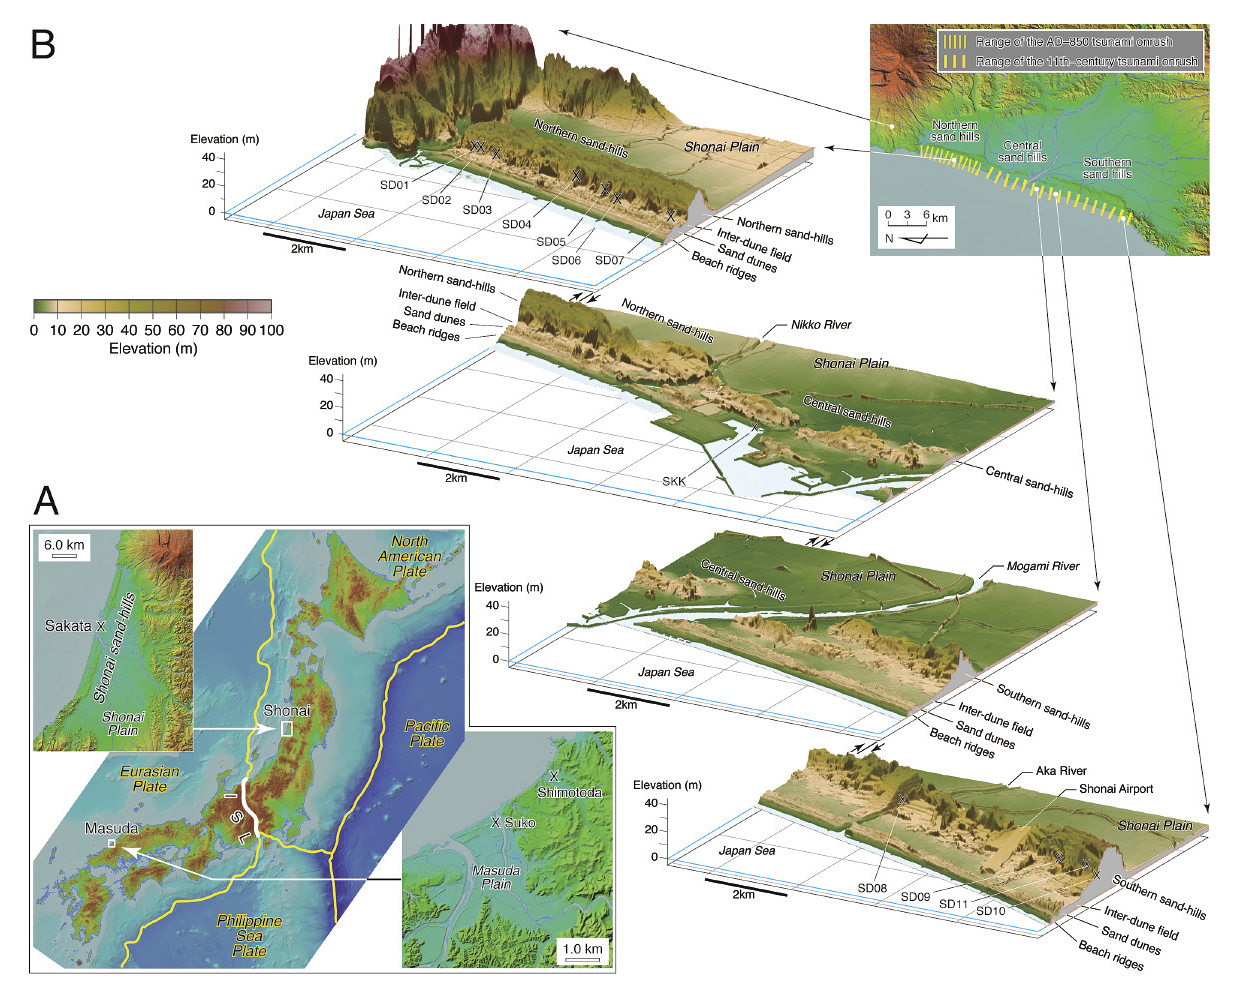
The authenticated chronicle of the 16th of October in the 3rd year of the Kasho Era (November 27 AD 850) records the occurrence of a major earthquake and a tsunami off the Japan Sea coast of Sakata (Fig. 1A). The tsunami reached the coast immediately after the earthquake, causing extensive damage to seaside villages (Usami et al. 2013). In the Shonai region, sand hills of the largest scale in Japan range north to south parallel to the coast (Fig. 1A), except for the central area, where the meandering of the Mogami River interrupts the growth of the hills (Fig. 1B). The hills are formed by aeolian deposits, stratigraphically classified into two formations based on the development of humic soil: the Older Sand and the Younger Sand (Sumida 1975). On the top of the paleosol layer above the Older Sand in the northern sand-hills (Fig. 1B), Yamanoi et al. (2014) discovered a 10 to 20 cm thick clayey-silt layer, which is overlain by megaripple-bedded medium sand (Fig. 4A). The AD 915 Towada-A tephra (Aoki and Machida 2006; Table 1) is intercalated in the sand, suggesting that the silt was deposited just before the last eruption of the Towada volcano. Lenticular lamination is formed by suspension or rolling transport of ooze fragments by continuous water flows (Schieber et al. 2010). The occurrence of saltwater diatoms (Table 2) and the development of lenticular lamination (Fig. 4A) indicate that seawater currents caused clayey-silt transport and deposition. The silt layer occurs as a thin carpet covering the surface of troughs of the former landform that was formed by erosion and soilification acting on the Older Sand (Fig. 5A, B). The trough axis dips westward, suggesting that the seawater currents came from the coast and run up through valleys. The tephrochoronology (older than AD 915, Table 1) and the accelerator mass spectrometry (AMS) dating (younger than AD 800; Yamanoi et al. 2014) indicate that the layer was formed in the 9th or early in the 10th century. The AD 850 Kasho Earthquake is the only tsunami-genic earthquake generated off the coast of Shonai (Usami et al. 2013). It follows therefore that the silt layer was formed by the tsunami flooding in AD 850. The clayey silt layer was found only in the northern sand-hills, suggesting that the tsunami hit mostly the northern coast of Shonai.


Geological evidence of unexpected tsunami flooding over the Shonai sand-hills
On the western hillside of the southern sand-hills, we recognized the development of another 20 to 30 (partly 40) cm thick clayey-silt layer, which is underlain by humic sandy soils. The layer, consisting of massive gray clayey-silt with unsorted brownish soil-rich silt at the base (Fig. 4C, D), is overlain by megaripple-laminated medium sand. In Fig. 4E and F we show the vertical sequence observed at the geological sites of SD06 and SD07, respectively, in the northern sand-hills. The elevation of the layer increases toward the south and reaches up to 33.5 m in the southern end of the hills (Fig. 1B). Lenticular fabric (e.g. Fig. 4A; Schieber et al. 2010) is again visible in the clayey silt. In some places, the soil-rich silt includes tephra flakes. At the horizon 30 to 40 cm below the soil/silt interface, there is a 1-2 cm thick layer of volcanic fallout (Fig. 4F). Electron probe microanalysis (EPMA) of volcanic grass shards shows that the fallout layer and the tephra flakes are correlated to the AD 915 Towada-A tephra (Table 1). The tephrochoronology and the AMS dating on plant seeds and stems (2σ AMS ages AD 980-1041, Table 3) indicate that the clayey-silt layer was formed in the period from the early to middle 11th century. Similar to the northern sand-hills, the silt layer occurs as a thin carpet covering the surface of troughs of the former landform. The fossil diatom assemblage (Table 2) provides evidence of seawater transport of sediments. The trough axis dips westward, suggesting that the currents came from the seashore and climbed up through valleys on the hillsides.
At a point 1.5 kilometers west of the central sand-hills (Fig. 1B) 2-m-thick layers of dark-gray organic mud is overlaid by ~20-cm-thick well-sorted felsic medium-grain sand. Yamanoi and Arakawa (1988) interpreted the mud to be a deposit filling inter-dune ponds. Fossil reed stems growing from the mud were flattened by the sand deposition. The stems lie in a west to east orientation (N85°E) (Yamanoi et al. 2014). The flame structure rising from the underlying organic mud suggests an abrupt deposition of sand in the pond (Fig. 4B). The stem orientation and the sediment fabric (highly sorted and having a flame structure) and the occurrence of saltwater frustules (Table 2) indicate that seawater currents with suspended marine sand flowed up the beach and rapidly entered the pond. The AMS age of the plant stems (2σ calendar age AD 1030-1154, Table 3) overlaps that of the silt from the southern sand-hills, indicating that the 11th century tsunami reached the coast of the central sand-hills. Using a settling tube we extracted fine fractions (< 1.0 μm) from the organic mud samples (inter-dune deposit) and the clayey sit (tsunami deposit from the sand-hills). The X-ray mineralogy of the clayey silt agrees well with that of the organic mud (major clay minerals: illite and chlorite; accessory component: smectite). The mineralogical results infer that the fine fractions in the deposit of the AD 850 and the 11th century tsunamis originate from inter-dune lacustrine environments. Sand grains characteristic of the foreshore or shoreface environments of Shonai (0.3-0.8 mm diameter with a peak of 0.5 mm) are the main component of the felsic medium sand but are present in very small amounts or undetectable in the tsunami deposit. This suggests that most of the marine sand remained on the coast and was not reworked by succeeding currents.

Geological structures in the area off the coast of Shonai
An active uplift zone extends for more than 50 km from north to south along the Japan Sea coast of Shonai (Horikawa et al. 2011) (Fig. 6). To the west of the zone a steep slope spreads out westward. The seabed features suggest the occurrence of a slope collapse and the bathymetric charts indicate mass flow (Fig. 2B); this evidence points to extensive gravitational instability at the shelf margin. The seismic reflection profiling data (Geological Survey of Japan; GSJ, 2005, 2013) shows intra-layering of slump structures in the vertical sequence under the slope (Fig. 6), which is geophysical evidence of repeated gravity sliding. Thus, the movement of the uplift zone is considered to have exerted a great influence on the development of the slump zone. The Headquarters for Earthquake Research Promotion of Japan (2014) showed that the AD 850 Kasho Earthquake magnitude (M) 7.0 took place in the center of the uplift zone (Fig. 6). This earthquake was followed by a tsunami, and the deposit brought in by this tsunami was found in the northern sand-hills. The GSJ seismic reflection profiling data suggests that the scale of the single fault-displacement was several meters at the most. The water depth of the focal region is too shallow (< 100 m) to produce a large-scale tsunami generated solely by a submarine earthquake. Therefore, we infer that the water mass oscillation created by slope collapse and mass slide, which is triggered by the earthquake, was the main tsunami generation mechanism. The slope is narrow and steep (Fig. 2B), and extends for about 40 km along the west side of the uplift zone (Fig. 6).
To the south of the slump zone, some remarkable features of large-scale collapse and mass flow were observed (Fig. 2B). The GSJ seismic reflection profiles crossing this area from west to east show the gravitational pull-apart of the westward dipping surface layer at the shelf break (Fig. 6). Small and irregular folding of the surface layer is recognized on the mid-slope. These bathymetric features reflect the occurrence of recent submarine sliding.
Numerical reconstruction of the tsunami events
Assuming that large-scale collapse took place outside the shelf break, and based on the bathymetric feature and geometry of the slide and mass flow, we performed a numerical modeling of tsunamis in the AD 1026 in Masuda and the AD 850 and 11th century in Shonai. The submarine slide identified in the bathymetric chart (Fig. 2) was set to the generation region of the tsunamis. For past submarine slides, the bathymetry prior to the slope collapse, the volume of mass failure, and the direction and duration of the collapse are difficult to constrain. Thus, first-order approximations of the volume of the mass failure were computed using the elastic model of normal faults; these were used to simulate the change of bathymetry and water level caused by the submarine slide.
The area of possible submarine collapse offshore of the Masuda Plain can be divided into two segments based on the slope inflection that appears around the center of the lateral trend (Fig. 2A). Then, two rectangular normal faults, with lengths of 25 and 42 km and a width of 15 km, were placed to cover the area of the collapse (Fig. 3A1). Two different types of undersea movements were identified in the bathymetric chart of the area off the coast of Shonai (Fig. 2B). One is surface slide, which is characteristic of the Sakata-Oki slump zone. The other is slope collapse and mass flow. To the south of the slump zone we recognized extensive submarine relief, showing the occurrence of slope failing with a relative height exceeding 800 m. We established a model area in the slump zone, which is divided into two segments by the slope inflection that appears around the center of the lateral trend. The two rectangular normal faults, each 18 km long and 6 km wide, were placed to cover the area of the surface slide (Fig. 3B1). The area of slope collapse and mass flow was covered by a single rectangular normal fault, 18 km long and 20 km wide (Fig. 3C1). The dimensions (length and width) of the displacement were determined based on the distribution of characteristic reflectors recorded in the GSJ bottom-profiling data (Fig. 6).
The fault parameters used to compute the sea-floor deformation caused by the simulated submarine slide are shown in Table 4. The sea-floor deformation and the water-level change were computed using the elastic model of finite rectangular fault (Okada 1985), considering the additional uplift or subsidence of the water surface due to the horizontal displacement of the seafloor (Tanioka and Satake 1996). Since the tsunami source models (fault parameters) share the dip angle and slip amount, the resulting seafloor deformation by each model is almost identical in terms of the range of the bathymetric change; the subsidence of the water level by the submarine slide reaches 10-50 m, whereas the uplift of water level is up to 10-60 m. The total volume of mass failure offshore of Shonai is estimated to have been 5.7 km3 for the AD 850 tsunami and 8.5 km3 for the 11th century tsunami. We calculated the volume of mass failure for the AD 1026 tsunami as 8.6 km3.
The tsunami propagation from the wave source to the nearshore and the coast inundation were numerically solved using the conventional depth-averaged nonlinear shallow-water model discretized by the staggered leap-frog scheme (TUNAMI-N2) (Goto et al. 1997). This numerical code was extensively utilized in numerous studies and validated through analysis of modern tsunamis (e.g. Sugawara et al. 2014).
The computational domain for the model of the AD 1026 Manju Tsunami covers an area of 245 km in the east-west direction and 256 km in the south-north direction, with a spatial resolution of 135 m. The tsunami inundation of the Masuda Plain was calculated using bathymetry/topography data with a resolution of 45 m (Fig. 3A2). Both computational domains were coupled to compose a nesting grid system. The computational domain for the model of the tsunamis generated offshore of Shonai covers an area of 72 km in the east-west direction and 108 km in the south-north direction, with a resolution of 45 m (Fig. 3B2, C2). A uniform Manning’s roughness n = 0.025, which is typical for seafloor or bare ground (Kotani et al. 1998), was applied throughout the computational domains. The tsunami propagation and inundation/run-up were computed for three hours from the initiation of the undersea displacement.
Although the duration of the slope collapse and slide is unknown, an instantaneous change of bathymetry and water level ranging from −60 m to +50 m is unrealistic. In addition, the momentary setup of initial tsunami waveform with high amplitude may cause numerical oscillation. In this study, we introduced the rise time of the water level to avoid numerical oscillation. The iterative computations of the tsunami generation and propagation were carried out to find the suitable rise time for the initial waveform. Based on the result, we applied a rise time of 5 min to the numerical model of the AD 850 Kasho and the AD 1026 Manju tsunamis. A rise time of 7 min was estimated for the 11th-century tsunami that occurred offshore of Shonai.
The simulation of the AD 850 Kasho tsunami demonstrated that the waves generated by a series of undersea disturbances will strike the coast of the northern sand-hills with waves more than 16 m high (Fig. 3B). The modeled inundation area is consistent with the distribution (extent and elevation) of the tsunami deposit. The simulation of the tsunami in the 11th century show that the wave height increases toward the south and reaches a height of more than 30 m on the coast of the southernmost part of the hills (Fig. 3C). The extent and the elevation of the tsunami flooding agree well with the distribution of the 11th century tsunami deposit.
Discussion
The numerical results relating to the origin of the AD 850 tsunami emphasize the importance of assessing tsunami hazards from undersea mass movement in the Japan Sea. Although there are no records of a tsunami-genic earthquake in the Japan Sea in the 11th century (Usami et al. 2013), the numerical modeling infers that the tsunami was non-seismic and caused by slope failure. The failure occurred approximately 150 years after the AD 869 Jogan Earthquake. There is a time difference of about 200 years between the AD 850 and the 11th century tsunamis; however, in both cases seawater flooding extended over thickly vegetated hills. The Younger Sand started to develop just after the AD 850 tsunami in the northern sand-hills. Full-scale planting to prevent sand drift began in AD 1721 (Sumida 1975); hence, the northern sand-hills were barren of vegetation for about 900 years. The shelf off the coast of Shonai receives large amounts of sand through the Mogami River (Ikehara et al. 1994); the AD 850 and 11th century tsunamis may have shifted this sand to the coast across the beach. There has been no notable sea-level change along the coast of Northeast Japan during the last 2,000 years (Matsumoto 1984), and the supply of aeolian grains arising from shoreline emergence is insignificant on the Shonai coast. It can therefore be argued that the aeolian deposit originates mostly in the marine sand transported to the coast by surging currents. The 2011 tsunami brought foreshore sand to the coast (Minoura 2011), where it accumulated and then drifted inland with wind blowing from the sea. Thus, the sand was probably transported inland by seasonal winds. The volume of the tsunami-genic deposits may have regulated the size of the aeolian formations. If that is the case, tsunamis were the most important factor for the development of sand-hills along the Japan Sea coast.
We do not have a sufficient understanding of natural catastrophes; therefore the danger of natural events must be inspected in the context of history. Here, we return to the subject on the history of earthquakes in Japan. Eighteen years after the occurrence of the AD 869 Jogan event, a massive earthquake occurred in the Nankai Trough (the AD 887 Ninna Earthquake) (Usami et al. 2013). Seismic shocks and a tsunami caused extensive damage along the Philippines Sea coast of southwest Japan. Following these earthquakes, the Japanese islands experienced a period of low seismic activity for 200 years, until the end of the 11th century when another massive earthquake occurred in the Nankai Trough (Usami et al. 2013). Thus it follows that the aseismic tsunamis took place toward the end of this period. In view of the stretching and sinking of the northeast Japan arc due to the 2011 earthquake, we would expect neutral to extensional tectonic conditions throughout the Japanese islands immediately after the massive earthquakes of the 9th century. The eastern margin of the Japan Sea crust is bordered by a series of large-scale cliffs and steep slopes rising from the sea floor. These topographic features, formed during the opening of the Japan Sea in the Miocene (e.g. Minoura and Hasegawa 1992), were preserved as a result of the tectonic coupling between the arc and the back-arc. The seismic destruction of the forearc lowered the E-W compressive stress on the arc, leading to a decrease in the stability of those cliffs and slopes. The sediment supply probably led to top-heavy conditions at the shelf margin, and we assume that tectonic instability caused by subduction-zone earthquakes is the main cause of the aseismic tsunamis in the Japan Sea. This raises the question of what caused the slope failing about 150 years after the 9th-century earthquakes.
During the 9th century Japan experienced a series of large-scale earthquakes exceeding M 7, and the Jogan and Ninna Earthquakes were the final seismic events (Table 5). Seismic shocks trigger soft-sediment liquefaction, which leads to fluidization of bottom deposits (Singh and Jain 2007). If the fluidized beds shift across the shelf to the deeper regions at every earthquake, the shelf margins may have avoid overloading until the occurrence of the massive earthquakes in the 9th century. During the long period of low seismicity after the earthquakes (Table 5) a considerable amount of sediment might have been accumulated. Finally, after 150 years of accumulation of sediment deposit gravitational instability developed at the shelf margin in the Japan Sea causing the tsunami events.
Concluding remarks
The 9th century in Japan was a period of natural hazards caused by frequent large-scale earthquakes. The largest-scale subduction-zone earthquakes took place in the final stage of a period of high seismic activity. The aseismic tsunamis that inflicted damage on the Japan Sea coast in the 11th century were aftereffects of the subduction-zone earthquakes. Extensional tectonics resulting from the earthquakes induced gravitational instability, which led to the generation of tsunamis caused by slope failing at the arc-back-arc boundary.
An earthquake of M 7.5 was observed off the coast of Niigata in 1964. Two shallow earthquakes exceeding M 7.0 took place to the north of Masuda (the 1872 Hamada Earthquake and 2000 Tottori Earthquake). Additionally, an inland local earthquake of M 7.0 occurred in Shonai in 1894. Except for these cases, no earthquakes over M 7.0 were recorded in and around Shonai and Masuda during the last 150 years (Usami et al. 2013). A considerable amount of sediment that was supplied during this time interval has accumulated on the continental shelves. Noting the arc subsidence after the 2011 subduction-zone earthquake, we emphasize the high probability of unexpected flooding caused by slope-failure tsunamis in the Japan Sea.
Acknowledgments
We wish to thank two anonymous reviewers for providing valuable comments. The manuscript has been considerably improved based on their suggestions. We are grateful to M. Shiba for his assistance with the glass shards analysis and T. Kamata who helped our sediment sampling in Shonai. We thank T. Nakata, who presented bathymetric evidence suggesting the occurrence of a submarine slide 135 km offshore of Masuda.
Conflict of Interest
The authors declare no conflict of interest.
References
-
Ando,
K.
(1990) Environmental indicators based on freshwater diatom assemblages and its application to reconstruction of paleo-environments. Ann. Tohoku Geogr. Assoc., 42, 73-88 (in Japanese, abstract in English).
-
Aoki,
K. &
Machida,
H.
(2006) Major element composition of volcanic glass shards in the late Quaternary widespread tephras in Japan - Distinction of tephras using K2O-TiO2 diagrams. Bull. Geol. Surv. Japan, 57, 239-258 (in Japanese, abstract in English).
-
Geological Survey of Japan (GSJ)
(2005) Database of Offshore Geologic Structure. https://gbank.gsj.jp/marineseisdb/index_E.html [Accessed: July 1, 2015].
-
Geological Survey of Japan (GSJ)
(2013) 3.5kHz SBP database. https://gbank.gsj.jp/sbp_db/pages/cover-E.html [Accessed: July 1, 2015].
-
Goto,
C.,
Ogawa,
Y.,
Shuto,
N. &
Imamura,
F.
(1997) Numerical method of tsunami simulation with the leap-frog scheme. IOC Manuals and Guides No. 35, IUGG/IOC Time Project, UNESCO, Paris.
-
Horikawa,
H.,
Okamura,
Y. &
Murakami,
F.
(2011) Seismic reflection profiling of the shallow structure of the Sakata-oki uplift, northeast Japan. Ann. Rep. Act. Fault and Paleoearth. Res., 11, 83-96.
-
Ikehara,
K.,
Nakajima,
K. &
Katayama,
H.
(1994) Sedimentological map of the vicinity of Awashima, scale 1:200,000, and its explanatory notes. Geological Survey of Japan, Tsukuba, Japan (in Japanese, abstract in English).
-
Ishigaki,
A.,
Higashi,
H.,
Sakamoto,
T. &
Shibahara,
S.
(2013) The Great East-Japan Earthquake and devastating tsunami: an update and lessons from the past Great Earthquakes in Japan since 1923. Tohoku J. Exp. Med., 229, 287-299.
-
Kosugi,
M.
(1988) Classification of living diatom assemblages as the indicator of environments, and its application to reconstruction of paleoenvironments. Daiyonki-Kenkyu, 27, 1-20 (in Japanese, abstract in English).
-
Kotani,
M.,
Imamura,
F. &
Shuto,
N.
(1998) Tsunami run-up simulation and damage estimation by using GIS. Proceedings of Coastal Engineering, JSCE, 45, 356-360.
-
Matsui,
T.
(1995) Report on the scientific investigation of the AD 1026 Manjyu Tsunami. Tokyo University, Tokyo (in Japanese).
-
Matsumoto,
H.
(1984) Beach ridge ranges on Holocene coastal plains in northeast Japan: the formative factors and periods. Geogr. Rev. Jpn., 57, 720-738 (in Japanese, abstract in English).
-
Minoura,
K.
(2011) Hydro-sedimentological study of tsunami run-up. Iwanami-Kagaku, 81, 1077-1082 (in Japanese).
-
Minoura,
K. &
Hasegawa,
A.
(1992) Crustal structure and origin of northeast Japan arc. Island Arc, 1, 2-15.
-
Minoura,
K.,
Imamura,
F.,
Sugawara,
D.,
Kono,
Y. &
Iwashita,
T.
(2001) The 869 Jogan tsunami deposit and recurrence interval of large-scale tsunami on the Pacific coast of northeast Japan. J. Nat. Dis. Sci., 23, 83-88.
-
Minoura,
K. &
Nakata,
T.
(1994) Discovery of an ancient tsunami deposit in coastal sequences of southwest Japan: verification of a large historic tsunami. Island Arc, 3, 66-72.
-
Namegaya,
Y. &
Satake,
K.
(2014) Reexamination of the AD 869 Jogan earthquake size from tsunami deposit distribution, simulated flow depth, and velocity. Geophys. Res. Lett., 41, 2297-2303.
-
Okada,
Y.
(1985) Surface deformation due to shear and tensile faults in a half-space. Bull. Seismo. Soc. America, 75, 1135-1154.
-
Ozawa,
S.,
Nishimura,
T.,
Suito,
H.,
Kobayashi,
T.,
Tobita,
M. &
Imakiire,
T.
(2011) Coseismic and postseismic slip of the 2011 magnitude-9 Tohoku-Oki earthquake. Nature, 475, 373-376.
-
Schieber,
J.,
Southard,
J.B. &
Schimmelmann,
A.
(2010) Lenticular shale fabrics resulting from intermittent erosion of water-rich muds: interpreting the rock record in the light of recent flume experiments. J. Sediment. Res., 80, 119-128.
-
Singh,
S. &
Jain,
A.K.
(2007) Liquefaction and fluidization of lacustrine deposits from Lahaul-Spiti and Ladakh Himalaya: Geological evidences of paleoseismicity along active fault zone. Sediment. Geol., 196, 47-57.
-
Sugawara,
D.,
Takahashi,
T. &
Imamura,
F.
(2014) Sediment transport due to the 2011 Tohoku-Oki tsunami at Sendai: results from numerical modeling. Mar. Geol., 358, 18-37.
-
Sumida,
K.
(1975) On the forming and fixing of sand dunes in some coastal dune regions along the Sea of Japan and the East China Sea in Holocene. Quat. Res., 14, 251-276 (in Japanese, abstract in English).
-
Tanioka,
Y. &
Satake,
K.
(1996) Tsunami generation by horizontal displacement of ocean bottom. Geophys. Res. Lett., 23, 861-864.
-
The Headquarters for Earthquake Research Promotion of Japan
(2014) http://www.jishin.go.jp/main/yosokuchizu/tohoku/tohoku.htm [Accessed: June 24, 2015].
-
Usami,
T.,
Ishii,
H.,
Imamura,
T.,
Takemura,
M. &
Matsuura,
R.
(2013) Materials for comprehensive list of destructive earthquakes in Japan, University of Tokyo Press, Tokyo (in Japanese).
-
Watanabe,
H.
(1998) Comprehensive list of tsunamis to hit the Japanese Islands, 2nd ed., University of Tokyo Press, Tokyo (in Japanese).
-
Wessel,
P.,
Smith,
W.H.F.,
Scharroo,
R.,
Luis,
J. &
Wobbe,
F.
(2013) Generic Mapping Tools: improved version released. EOS Trans. AGU, 94, 409-410.
-
Yamanoi,
T. &
Arakawa,
C.
(1988) Chronostratigraphical and paleontological studies on the argillaceous deposit found in the northern Sakata port. Appl. Geol. Yamagata, 18, 44-47 (in Japanese).
-
Yamanoi,
T.,
Tokanai,
F.,
Kato,
K.,
Konno,
S. &
Minoura,
K.
(2014) Tsunami deposit found in the Shonai sand-hills. Appl. Geol. Yamagata, 34, 1-12 (in Japanese).