Abstract
The improvement of the quality of life (QOL) of children with disabilities has been considered important. Therefore, the Special Needs Education Assessment Tool (SNEAT) was developed based on the concept of QOL to objectively evaluate the educational outcome of children with disabilities. SNEAT consists of 11 items in three domains: physical functioning, mental health, and social functioning. This study aimed to verify the reliability and construct validity of SNEAT using 93 children collected from the classes on independent activities of daily living for children with disabilities in Okinawa Prefecture between October and November 2014. Survey data were collected in a longitudinal prospective cohort study. The reliability of SNEAT was verified via the internal consistency method and the test-pretest method; both the coefficient of Cronbach’s α and the intra-class correlation coefficient were over 0.7. The validity of SNEAT was also verified via one-way repeated-measures ANOVA and the latent growth curve model. The scores of all the items and domains and the total scores obtained from one-way repeated-measures ANOVA were the same as the predicted scores. SNEAT is valid based on its goodness-of-fit values obtained using the latent growth curve model, where the values of comparative fit index (0.983) and root mean square error of approximation (0.062) were within the goodness-of-fit range. These results indicate that SNEAT has high reliability and construct validity and may contribute to improve QOL of children with disabilities in the classes on independent activities of daily living for children with disabilities.
Introduction
Children with chronic conditions often go through long-term treatment, which may be complex and may negatively impact their well-being. For children undergoing long-term treatment, as for all other children, school education is considered important for their growth and development (Kohara et al. 2012). In planning treatment and interventions for children with chronic conditions it is important to measure quality of life and health-related quality of life (HRQOL) (Taylor et al. 2008). In this context, the necessity of evaluating the educational outcome of children taking special needs education, based on their QOL, has been on the rise.
Kohara et al. (2014b) verified the effectiveness of using HRQOL to evaluate educational outcome for the purpose of improving the QOL of children with disabilities, and to address the need for a tool for evaluating educational outcome according to the QOL of children with disabilities. The study results that they obtained confirmed that the classes on independent activities of daily living for children with disabilities are related with HRQOL. Based on those results, the Special Needs Education Assessment Tool (SNEAT) was developed by including therein the common components of the classes on independent activities of daily living for children with disabilities and HRQOL (Han et al. 2014). The classes on independent activities of daily living for children with disabilities are specified in the Course of Study in School for Special Needs Education and are composed of the six domains of health maintenance, mental stability, developing interpersonal relationships, understanding the environment, body movement, and communication. They aim to help children with disabilities live an independent life by enabling them to acquire the knowledge, skills, attitudes, and habits required to overcome difficulties in learning and living, and have played an important role in the education of children with disabilities (Ministry of Education, Culture, Sports, Science and Technology 2009). Kohara et al. (2014a) first verified the content validity of SNEAT by conducting an expert survey among researchers on special needs education and QOL and in-service teachers. The follow-up survey that they conducted on the content validity of SNEAT among 89 in-service teachers in Okinawa Prefecture in Japan also showed that over 90% of the respondent teachers agreed that the contents of SNEAT are valid.
The expert survey, however, was conducted based on the subjective opinions of experts, which necessitates scientific verification of the reliability and construct validity of SNEAT. As such, this study aimed to verify the reliability and construct validity of SNEAT by utilizing SNEAT in the classes in special support schools.
Subjects and Methods
Subjects and procedures
Survey data were collected in a longitudinal prospective cohort study. A cover letter was sent to school principals explaining the purpose of the research and the benefits that all the participating school principals could obtain from their participation in it. After obtaining the school principals’ consent to participate in the research, packages containing the SNEAT manual were sent to all the participating schools. The SNEAT questionnaire sets were distributed to the 120 classes on independent activities of daily living for children with disabilities in the 10 special support schools in Okinawa Prefecture. The class on independent activities of daily living for children with disabilities was conducted once a week (four times) for one month, between October and November 2014, using SNEAT. The data were collected by mail between December 2014 and January 2015. The class participants (i.e., the teachers and students) and the class contents were the same for all the classes. The selection of the classes on independent activities of daily living for children with disabilities was implemented via the random sampling method.
Questionnaire
SNEAT is a tool for evaluating the educational outcome of the classes on independent activities of daily living for children with disabilities (Han et al. 2014). The SNEAT questionnaire has a total of 11 items in three domains (physical functioning, mental health, and social functioning) (see Appendix) and enables the teachers to evaluate the educational outcome of their students (Han et al. 2014).
For each item, the evaluators are asked to indicate the extent of their agreement or disagreement using a 5-point scale, where 1 = strongly disagree; 2 = disagree; 3 = neutral; 4 = agree; and 5 = strongly agree.
In addition, the face sheet was added to record the contents of the class and the information on the students, such as their grade level (elementary, middle, or high school), gender, and type of disability (intellectual disability, physical disability, health impairment, developmental disability, multiple disabilities). Items for recording the information on the teachers who are the evaluators of the classes were also added, such as their age, gender, length of teaching at a special support school, and possession of a special teaching certificate.
Statistical analysis
Reliability of SNEAT: Reliability of SNEAT was estimated using the internal consistency method and the test-retest method (Han et al. 2004). The internal consistency of SNEAT was assessed with Cronbach’s α. In the test-retest method, there was an interval of 14-19 days between the two tests. The intra-class correlation co-efficient (ICC) was used. A minimum Cronbach’s α co-efficient of 0.7 was considered satisfactory for group-level comparisons (Cronbach 1951).
Validity of SNEAT: For this study, the latent growth curve model, which is one of an experimental intervention method, and structural equation modeling (SEM), among the methods of construct validity, were utilized, and longitudinal data were employed to verify the validity of SNEAT. Constructs can become bases of validity when they succeed in predicting the changes after experimental interventions, and a tool for measuring constructs reflects the changes that occurred, if any (Murakami 2006). That is, the scores of all the domains and the total score of SNEAT are expected to increase when the educational outcome is longitudinally measured because SNEAT is a tool for evaluating educational outcomes.
To analyze the obtained data, one-way repeated-measures ANOVA (matched design) were used. The items in each domain of SNEAT are listed in descending order of difficulty, and as such, the scores of the items in each domain are ranked in the descending orders of Q1 to Q4, Q5 to Q8, and Q9 to Q11. SPSS ver.17.0 was used for statistical analysis. The latent growth curve model can be used to analyze the repeated-measures data, which is different from general path analysis (Kano and Miura 2002). In the latent growth curve model, unlike in general path analysis, path coefficients are not the subjects of the data analysis because all the path coefficients from the observed to the latent variables are fixed parameters (Toyoda 2007).
The model fitness was assessed with the following fit indices: comparative fit index (CFI) and root mean square error of approximation (RMSEA). When conducting analysis via SEM, the researchers themselves are to choose the fit index that they would use, based on their judgment. A model is considered acceptable, when two or more fit indices are met including RMSEA (Steiger 1998). For adequately fitting models, these fit indices should meet the following criteria: CFI > 0.90 (Han et al. 2005) and RMSEA < 0.1 (Koshio 2004). In this research, maximum likelihood estimation was used for the parameter estimation. Amos ver.4.0 was employed for statistical analysis.
Ethical considerations
The study objective and ethical considerations were explained by the researcher in charge to the Board of Education of each target school to obtain their consent to participate in the study, and their return of the accomplished sheets was regarded as meaning that they were giving their consent to participate in the study. After obtaining the school principals’ consent, the consent of the teachers to participate in this study was also sought. A meeting was then held to explain the contents of the study, the research method to be employed, and the study’s privacy policy to the school principals and teachers who agreed to participate in the study.
Results
Subject characteristics
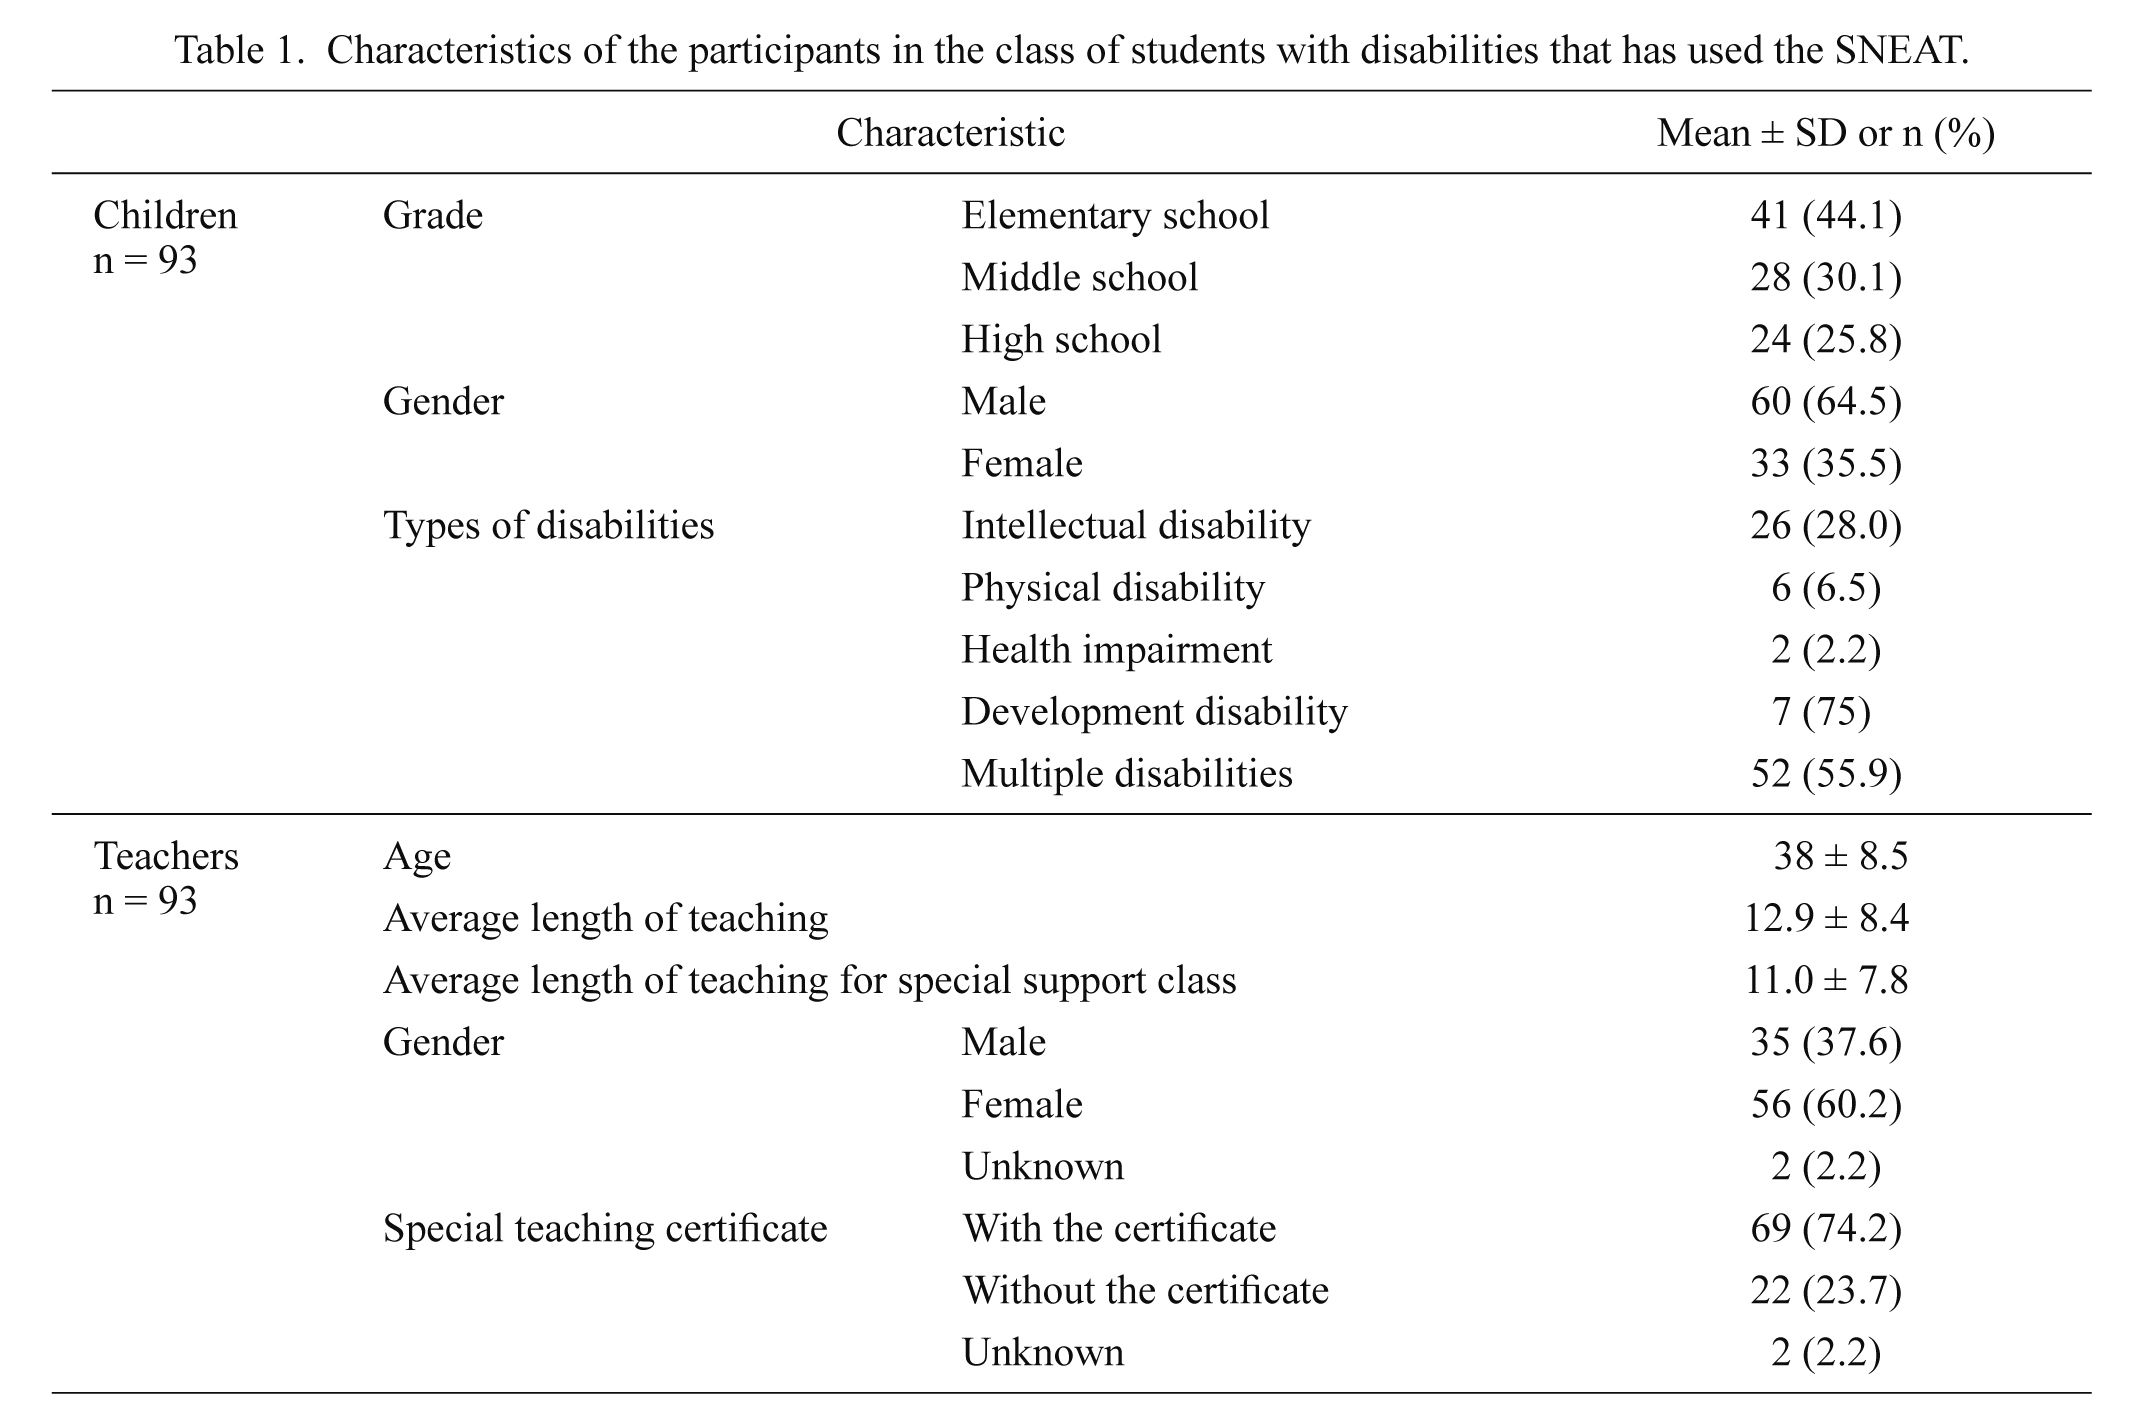
A total of 100 accomplished questionnaires were collected among the 120 that had been distributed (83.3% response rate), but of these, only 93 questionnaires could be analyzed because of the incomplete responses of the others. As the classes on independent activities of daily living for children with disabilities are usually conducted on a one-to-one basis, 93 children and 93 teachers (evaluators) participated in such classes using SNEAT. The characteristics of the participants in the said classes using SNEAT are shown in Table 1. As for the types of disabilities, the number of children with multiple disabilities was the highest. The average length of teaching of the teachers (evaluators) was 12.9 years, and the average length of teaching special support classes was 11.0 years. In addition, 72.7% of the teachers had a special teaching certificate.
Reliability of SNEAT
The internal consistency reliability (Cronbach’s α coefficient) ranged from 0.742 to 0.854 for all the domains, and the internal consistency reliability of all the items was 0.901. The test-retest reliability (ICC) ranged from 0.679 to 0.856, and the test-retest reliability (ICC) was 0.833 for all the items (Table 2).
Validity of SNEAT
Validity determined via the experimental intervention method: In the results of the experimental intervention, the scores of the domains and the total scores from the first to the fourth class significantly increased (Fig. 1).
The average scores of the domain of physical health were 16.75 in the first class, 17.76 in the second class, 18.80 in the third class, and 18.78 in the fourth class. In the results of the analysis of one-way repeated-measures ANOVA, there were significant differences (p < 0.05) among the first, second, third, and fourth classes. The average scores of the domain of mental health were 23.20 in the first class, 23.96 in the second class, 24.33 in the third class, and 24.62 in the fourth class, and those of the domain of social functioning were 20.37 in the first class, 20.82 in the second class, 21.46 in the third class, and 21.48 in the fourth class. In the results of the analysis through one-way repeated-measures ANOVA, there were significant differences (p < 0.05) among the first, third, and fourth classes. The total scores changed from 60.32 in the first class to 62.54 in the second class, 64.10 in the third class, and 64.89 in the fourth class. In the results of the analysis through one-way repeated-measures ANOVA, there were significant differences (p < 0.05) among the first, second, third, and fourth classes. The scores of the items decreased, with the scores of the items within each domain decreasing from Q1 to Q4, from Q5 to Q8, and from Q9 to Q11 (Fig. 2). The items of each domain of SNEAT are listed in descending order of difficulty. As such, the hypothesis was verified because the scores of each domain were ranked in the descending orders of Q1 to Q4, Q5 to Q8, and Q9 to Q11.
To conclude, as it was confirmed that the obtained scores of the items, the scores of each domain, and the total scores of SNEAT were the same as the predicted scores, the construct validity of SNEAT was verified via the experimental intervention method (Fig. 3).
Validity determined via the latent growth curve model: As for the analysis via the latent growth curve model, SNEAT showed a high level of fitness: χ2 = 25.622; degree of freedom (DF) = 19; CFI = 0.983; and RMSEA = 0.062. The validity was verified because the values of CFI and RMSEA were within the goodness-of-fit range. As for the factors affecting the SNEAT scores, four factors were clearly identified: the teacher’s length of teaching special support classes, the teacher’s possession of a special teaching certificate, the student’s grade level, and the type of disability of the student. This means that these four variables affect the evaluation of the outcome of special needs education (Fig. 4).
Discussion
QOL has been thought of as one of the most critical and fundamental concerns in today’s institution (Demirel 2014; Narehan et al. 2014). In particular, educational activities considering the aspects of QOL are required in special needs education for children with disabilities. There have been some studies on the relationship between QOL and educational outcome, including studies on the prognosis of children with cancer by Barrera et al. (2005) and Ishida et al. (2011) and a study on the prognosis of children who have undergone pediatric hematopoietic stem cell transplantation (HSCT). As these studies were conducted for prognosis purposes and included many measures and items, however, it is difficult to use them in school. Furthermore, it is hard to find a tool for regularly evaluating educational outcome in the aspect of QOL. In this context, SNEAT, a tool that may be used in the field of special needs education and that may be combined with QOL, was developed, and its reliability and validity were verified in this study.
The present study was the first attempt to develop a tool for evaluating the outcome of special needs education combined with QOL. It is also the first study to be conducted to identify the factors affecting the outcome of special needs education using the latent growth curve model.
The internal consistency reliability and test-retest reliability were satisfactory for all the domains and items. As for the coefficient of Cronbach’s α and the ICC, the values of all the items were higher than those of each domain. Educational activity refers to all the areas that include the domains of physical, mental health, and social functioning. Therefore, the fact that the values of all the items were higher than those of each domain suggests that comprehensive educational activities can be measured by SNEAT.
As for the verification of construct validity, the high level of construct validity of SNEAT was confirmed using the experimental intervention method and the latent growth curve model. One-way repeated-measures ANOVA were used to observe the changes in the educational outcomes using the experimental intervention method. In the results, the scores of the physical and social functioning domains and the total score significantly increased (p < 0.05) in the first and fourth classes. It is assumed that the scores changed slowly because there were no significant changes in the second and fourth classes. As educational outcome usually does not show dramatic changes, SNEAT may be considered an acceptable tool for evaluating it. The fitness level of the model was found to be high in the results of its analysis using the latent growth curve model. As for the factors affecting the scores, four factors were clearly identified: the teacher’s length of teaching special support classes, the teacher’s possession of a special teaching certificate, the student’s grade level, and the type of disability of the student. With classroom assessment taking its place as a major component of the educational process, the quality of teaching and learning relies in part on the teachers’ assessment skills (Daniel and King 1998). And, the aforementioned studies tend to confirm that classroom assessment practices may be unique from one grade level, teaching experience, and subject area to another (Alkharusi 2011). The results of this study seem to correspond with those of the precedent studies because they showed that the teacher’s length of teaching and the student’s grade level are the factors that affect the scores, even though the precedent studies were conducted not for special needs education but for general education. The reason that the factors affecting the evaluation of the class included the possession of a special teaching certificate and the type of disability of the child was that this study was conducted for classes for students with special needs, and it can be said that special education is a kind of education that requires teacher expertise on both education and disabilities.
A study implementing third-party assessment needs to be conducted, because in the present study, the same teachers who implemented the class conducted the evaluation. This study also had a regional limitation because the data for the study were collected only within Okinawa Prefecture in Japan. Considering, however, that scientific evaluation is required for the improvement of the QOL of children with disabilities and of special needs education, it is expected that the results of this study will play an important role in evaluating the educational outcome of children with disabilities. To increase the objectivity of SNEAT, further studies involving third-party evaluation of the class and of the correlation between the self-evaluation of the teachers and the third-party evaluation need to be conducted. In addition, an evaluation model for the educational outcome of the special needs education in Japan needs to be established via nationwide data collection in Japan, and the evaluation scale to be used for such model needs to be standardized.
Acknowledgments
The authors wish to thank the educational officials for special support education in Okinawa Prefecture for their assistance in this study. This work was supported by JSPS KAKENHI Grant No. 26-4304.
Conflict of Interest
The authors declare no conflict of interest.
References
-
Alkharusi,
H.
(2011) Teachers’ classroom assessment skills: influence of gender, subject area, grade level, teaching experience and in-service assessment training. Journal of Turkish Science Education, 8, 39-48.
-
Barrera,
M.,
Shaw,
A.K.,
Speechley,
K.N.,
Maunsell,
E. &
Pogany,
L.
(2005) Educational and social late effects of childhood cancer and related clinical, personal, and familial characteristics. Cancer, 104, 1751-1760.
-
Cronbach,
L.J.
(1951) Coefficient alpha and the internal structure of tests. Psychometrika, 16, 297-334.
-
Daniel,
L.G. &
King,
D.A.
(1998) Knowledge and use of testing and measurement literacy of elementary and secondary teachers. Journal of Educational Research, 91, 331-344.
-
Demirel,
H.
(2014) An investigation of the relationship between job and life satisfaction among teachers. Social and Behavioral Sciences, 116, 4925-4931.
-
Han,
C.W.,
Kohara,
A. &
Kohzuki,
M.
(2014) Development of scale to Special Needs Education Assessment Tool (SNEAT). Asian J. Human Services, 7, 125-134.
-
Han,
C.W.,
Lee,
E.J.,
Iwata,
T.,
Kataoka,
H. &
Kohzuki,
M.
(2004) Development of the Korean version of Short-Form 36-Item Health Survey: health related QOL of healthy elderly people and elderly patients in Korea. Tohoku J. Exp. Med., 203, 189-194.
-
Han,
C.W.,
Yajima,
Y.,
Lee,
E.J.,
Nakajima,
K.,
Meguro,
M. &
Kohzuki,
M.
(2005) Validity and utility of the Craig Hospital Inventory of Environmental Factors for Korean community-dwelling elderly with or without stroke. Tohoku J. Exp. Med., 206, 41-49.
-
Ishida,
Y.,
Honda,
M.,
Kamibeppu,
K.,
Ozono,
S.,
Okuyama,
J.,
Asami,
K.,
Maeda,
N.,
Sakamoto,
N.,
Inada,
H.,
Iwai,
T.,
Kakee,
N. &
Horibe,
K.
(2011) Social outcomes and quality of life of childhood cancer survivors in Japan: a cross-sectional study on marriage, education, employment and health-related QOL (SF-36). Int. J. Hematol., 93, 633-644.
-
Kano,
Y. &
Miura,
A.
(2002) Graphic Multivariate Analysis via AMOS, EQS, CALIS, Gendai-Sugakusha, Kyoto.
-
Kohara,
A.,
Han,
C, Zamami, E. &
Kohzuki,
M.
(2014a) The development of the Special Needs Education Assessment Tool (SNEAT) to Evaluate the Educational Outcome of Special Needs Education: Centering on the Content Validity Verification. Asian J. Human Services, 7, 60-71.
-
Kohara,
A.,
Kwon,
H. &
Han,
C.
(2014b) The Possibility of the Use of Health Related QOL in the Development of Evaluation Scale for the Outcome of Special Needs Education : Based on the Consideration of the Current Conditions of the Education for Students with Health Impairment. Asian J. Human Services, 6, 59-71.
-
Kohara,
A.,
Mori,
K.,
Han,
C. &
Tanaka,
A.
(2012) The research trend and issue of hospital school in the education for the health impaired. Asian J. Human Services, 3, 198-207.
-
Koshio,
S.
(2004) The Analysis of Psychology and Survey via SPSS and Amos, Tokyo-Tosho, Tokyo.
-
Ministry of Education, Culture, Sports, Science and Technology
(2009) The new Courses of Study, Kaibundo-Shuppan, Tokyo.
-
Murakami,
Y.
(2006) Shinri syakudo no tsukurikata, Kitaoji Publishing Company, Kyoto.
-
Narehan,
H.,
Hairunnisa,
M.,
Norfadzillah,
R.A. &
Freziamella,
L.
(2014) The effect of quality of work life (QWL) programs on quality of life (QOL) among employees at multinational companies in Malaysia. Procedia Soc. Behav. Sci., 112, 24-34.
-
Steiger,
J.H.
(1998) A note on multiple sample extensions of the RMSEA fit index. Struct. Equ. Modeling, 5, 411-419.
-
Taylor,
R.M.,
Gibson,
F. &
Franck,
L.S.
(2008) A concept analysis of health-related quality of life in young people with chronic illness. J. Clin. Nurs., 17, 1823-1833.
-
Toyoda,
H.
(2007) Covariance Structure Analysis: Amos, Tokyo-Tosho, Tokyo.