Abstract
(Pro)renin receptor ((P)RR), a receptor for renin and prorenin, is implicated in the pathophysiology of diabetes mellitus, hypertension and their complications. Soluble (P)RR (s(P)RR) is composed of extracellular domain of (P)RR and thus exists in blood. We have reported that plasma concentrations of s(P)RR were elevated in male patients with obstructive sleep apnea syndrome (OSAS). The aim of the present study was to clarify the difference in plasma s(P)RR concentrations between male and female OSAS patients. Plasma s(P)RR concentrations were studied in 289 subjects (206 males and 83 females) consisting of 259 OSAS patients and 30 non-OSAS control subjects. The 259 OSAS patients were classified into mild (5 ≤ apnea hypopnea index (AHI) < 15 events/h), moderate (15 ≤ AHI < 30), and severe OSAS (AHI ≥ 30). Plasma s(P)RR levels were significantly elevated in all three OSAS groups compared to non-OSAS control subjects (AHI < 5) in the entire cohort and male subjects, whereas in female subjects, the significant elevation was found only in severe OSAS. Plasma s(P)RR levels were significantly correlated with AHI in both sexes, with a higher r value found in male subjects (male r = 0.413, p < 0.0001; female r = 0.263, p < 0.05). Importantly, when OSAS patients (26 males and 15 females) with AHI ≥ 20 underwent continuous positive airway pressure treatment, plasma s(P)RR levels were significantly decreased. In conclusion, plasma s(P)RR levels are elevated in both male and female OSAS patients in parallel with the disease severity.
Introduction
(Pro)renin receptor ((P)RR), a specific receptor for renin and prorenin, is a single-pass transmembrane protein consisting of 350 amino acids (Nguyen et al. 2002; Nguyen 2011). It is widely expressed in various organs including brain, pituitary, heart and kidney (Hirose et al. 2009b, 2010; Takahashi et al. 2010a, b; Nguyen 2011; Takahashi et al. 2015). Prorenin is an inactive precursor of renin. Its prosegment prevents the substrate angiotensinogen from reaching the enzymatic active center. When prorenin binds with (P)RR, the prosegment is removed from the enzymatic active center, resulting in enzymatic activation (Nabi et al. 2006). In addition, renin and prorenin activated the (P)RR-mediated intracellular signaling (e.g., the mitogen-activated protein kinase pathway) (Huang et al. 2006; Ichihara et al. 2006; Saris et al. 2006). (P)RR has been implicated in the pathophysiology of type 2 diabetic mellitus (T2DM), cardiovascular diseases including hypertension, and their complications, such as diabetic nephropathy (Nguyen et al. 2002; Ichihara et al. 2006; Nguyen 2011). Certain gene polymorphism of the (P)RR gene was associated with blood pressure in the Japanese men (Hirose et al. 2009a).
Moreover, (P)RR was found as a truncated form of (P)RR at the C-terminal region associated with vacuolar H+-ATPase (v-ATPase), an ATP-dependent multi-subunit proton pump (ATP6 accessory protein 2) (Ludwig et al. 1998). The v-ATPase plays fundamental and physiological roles in the cellular function, including endocytosis, intracellular membrane transport, prohormone processing, transport of neurotransmitters, and left-right patterning during development (Nishi and Forgac 2002; Adams et al. 2006). (P)RR- and v-ATPase-mediated acidification was shown to be essential for the Wnt/β-signaling pathway, which is important in stem cell biology, embryonic development, and diseases, including cancer (Cruciat et al. 2010).
The extracellular domain of (P)RR is cleaved by furin and exists as soluble (P)RR (s(P)RR) in blood (Cousin et al. 2009). Plasma concentrations of s(P)RR were elevated in patients with chronic kidney disease (CKD) (Hamada et al. 2013). Watanabe et al. (2012, 2013) showed that increased plasma s(P)RR concentrations at early pregnancy may predict the development of gestational diabetes mellitus and hypertension later in pregnancy. We have previously reported that plasma concentrations of s(P)RR were elevated in 58 male patients with obstructive sleep apnea syndrome (OSAS) in parallel with the severity of disease (Nishijima et al. 2014).
OSAS occurs more frequently in men than in women (24% of men and 9% of women) (Young et al. 1993, 2008), and is highly associated with obesity (Young et al. 1993) and the metabolic syndrome (Lam et al. 2006). Intermittent hypoxemia is thought to cause hypertension, T2DM, dyslipidemia, and renal disorder via inflammatory cytokine production (Ryan et al. 2005), enhanced oxidative stress (Pialoux et al. 2009; Almendros et al. 2011), and increased sympathetic nervous system (Narkiewicz et al. 1999; Leuenberger et al. 2005).
The reason for the higher prevalence of OSAS in men is not clear, but sex differences are implicated, including structural and functional differences in the upper airway (Pillar et al. 2000), body fat distribution (Millman et al. 1995), and hormone levels (Netzer et al. 2003). However, plasma concentrations of s(P)RR have not been studied in female OSAS patients, and the difference in plasma s(P)RR levels between male and female OSAS patients has not been clarified. In the present study, we therefore studied plasma concentrations of s(P)RR in female OSAS patients, and compared with those in male OSAS patients, the number of which was increased from our previous report (Nishijima et al. 2014).
Materials and Methods
Subjects
We studied 289 subjects (206 males and 83 females) who visited the Division of Behavioral Sleep Medicine of the Iwate Medical University School of Medicine for overnight polysomnography (PSG) because they were suspected to have OSAS based on heavy snore or symptoms such as excessive daytime sleepiness. This study was approved by the Ethics Review Boards of Iwate Medical University and Tohoku University Graduate School of Medicine (Approval number: H25-48), and written informed consent was obtained from all subjects. We included 72 patients (58 male OSAS patients and 14 male non-OSAS control subjects) who were described in our previous study (Nishijima et al. 2014). In contrast to our previous study (Nishijima et al. 2014), the present study included 29 patients with drug-resistant hypertension, 62 patients with T2DM, and 53 patients with CKD (estimated glomerular filtration rate (eGFR) < 60 ml/min/1.73 m2). None of the patients with CKD were undergoing hemodialysis. The studied population contained no patients with chronic heart disease, chronic obstructive pulmonary disease, or neurological diseases. The subjects with hypertension were taking angiotensin-converting enzyme inhibitors (n = 21), angiotensin receptor antagonists (n = 79), calcium channel blockers (n = 85), direct renin inhibitors (n = 6), α-adrenergic blocking agents (n = 4), β-adrenergic blocking agents (n = 26) and diuretics (n = 28).
PSG testing was performed between 8 p.m. and 6 a.m. using a SomnoStar-α apparatus (SensorMedics, Yorba Linda, CA, USA) in a designated examination room equipped with an air conditioning system at the Iwate Medical University Hospital following the criteria of the American Academy of Sleep Medicine (Iber et al. 2007). Subjective excessive daytime sleepiness severity was assessed using the Epworth Sleepiness Scale (ESS) (Johns 1991). Thirty subjects (19 males and 11 females) with apnea hypopnea index (AHI) < 5 events/h were used as control (non-OSAS group). The 259 OSAS patients (187 males and 72 females) were classified into three groups following AHI (a measure of OSAS severity); patients with mild OSAS (mild OSAS) [n = 38 (25 males and 13 females), 5 ≤ AHI < 15 events/h], patients with moderate OSAS (moderate OSAS) [n = 56 (35 males and 21 females), 15 ≤ AHI < 30 events/h], and patients with severe OSAS (severe OSAS) [n = 165 (127 males and 38 females), AHI ≥ 30 events/h].
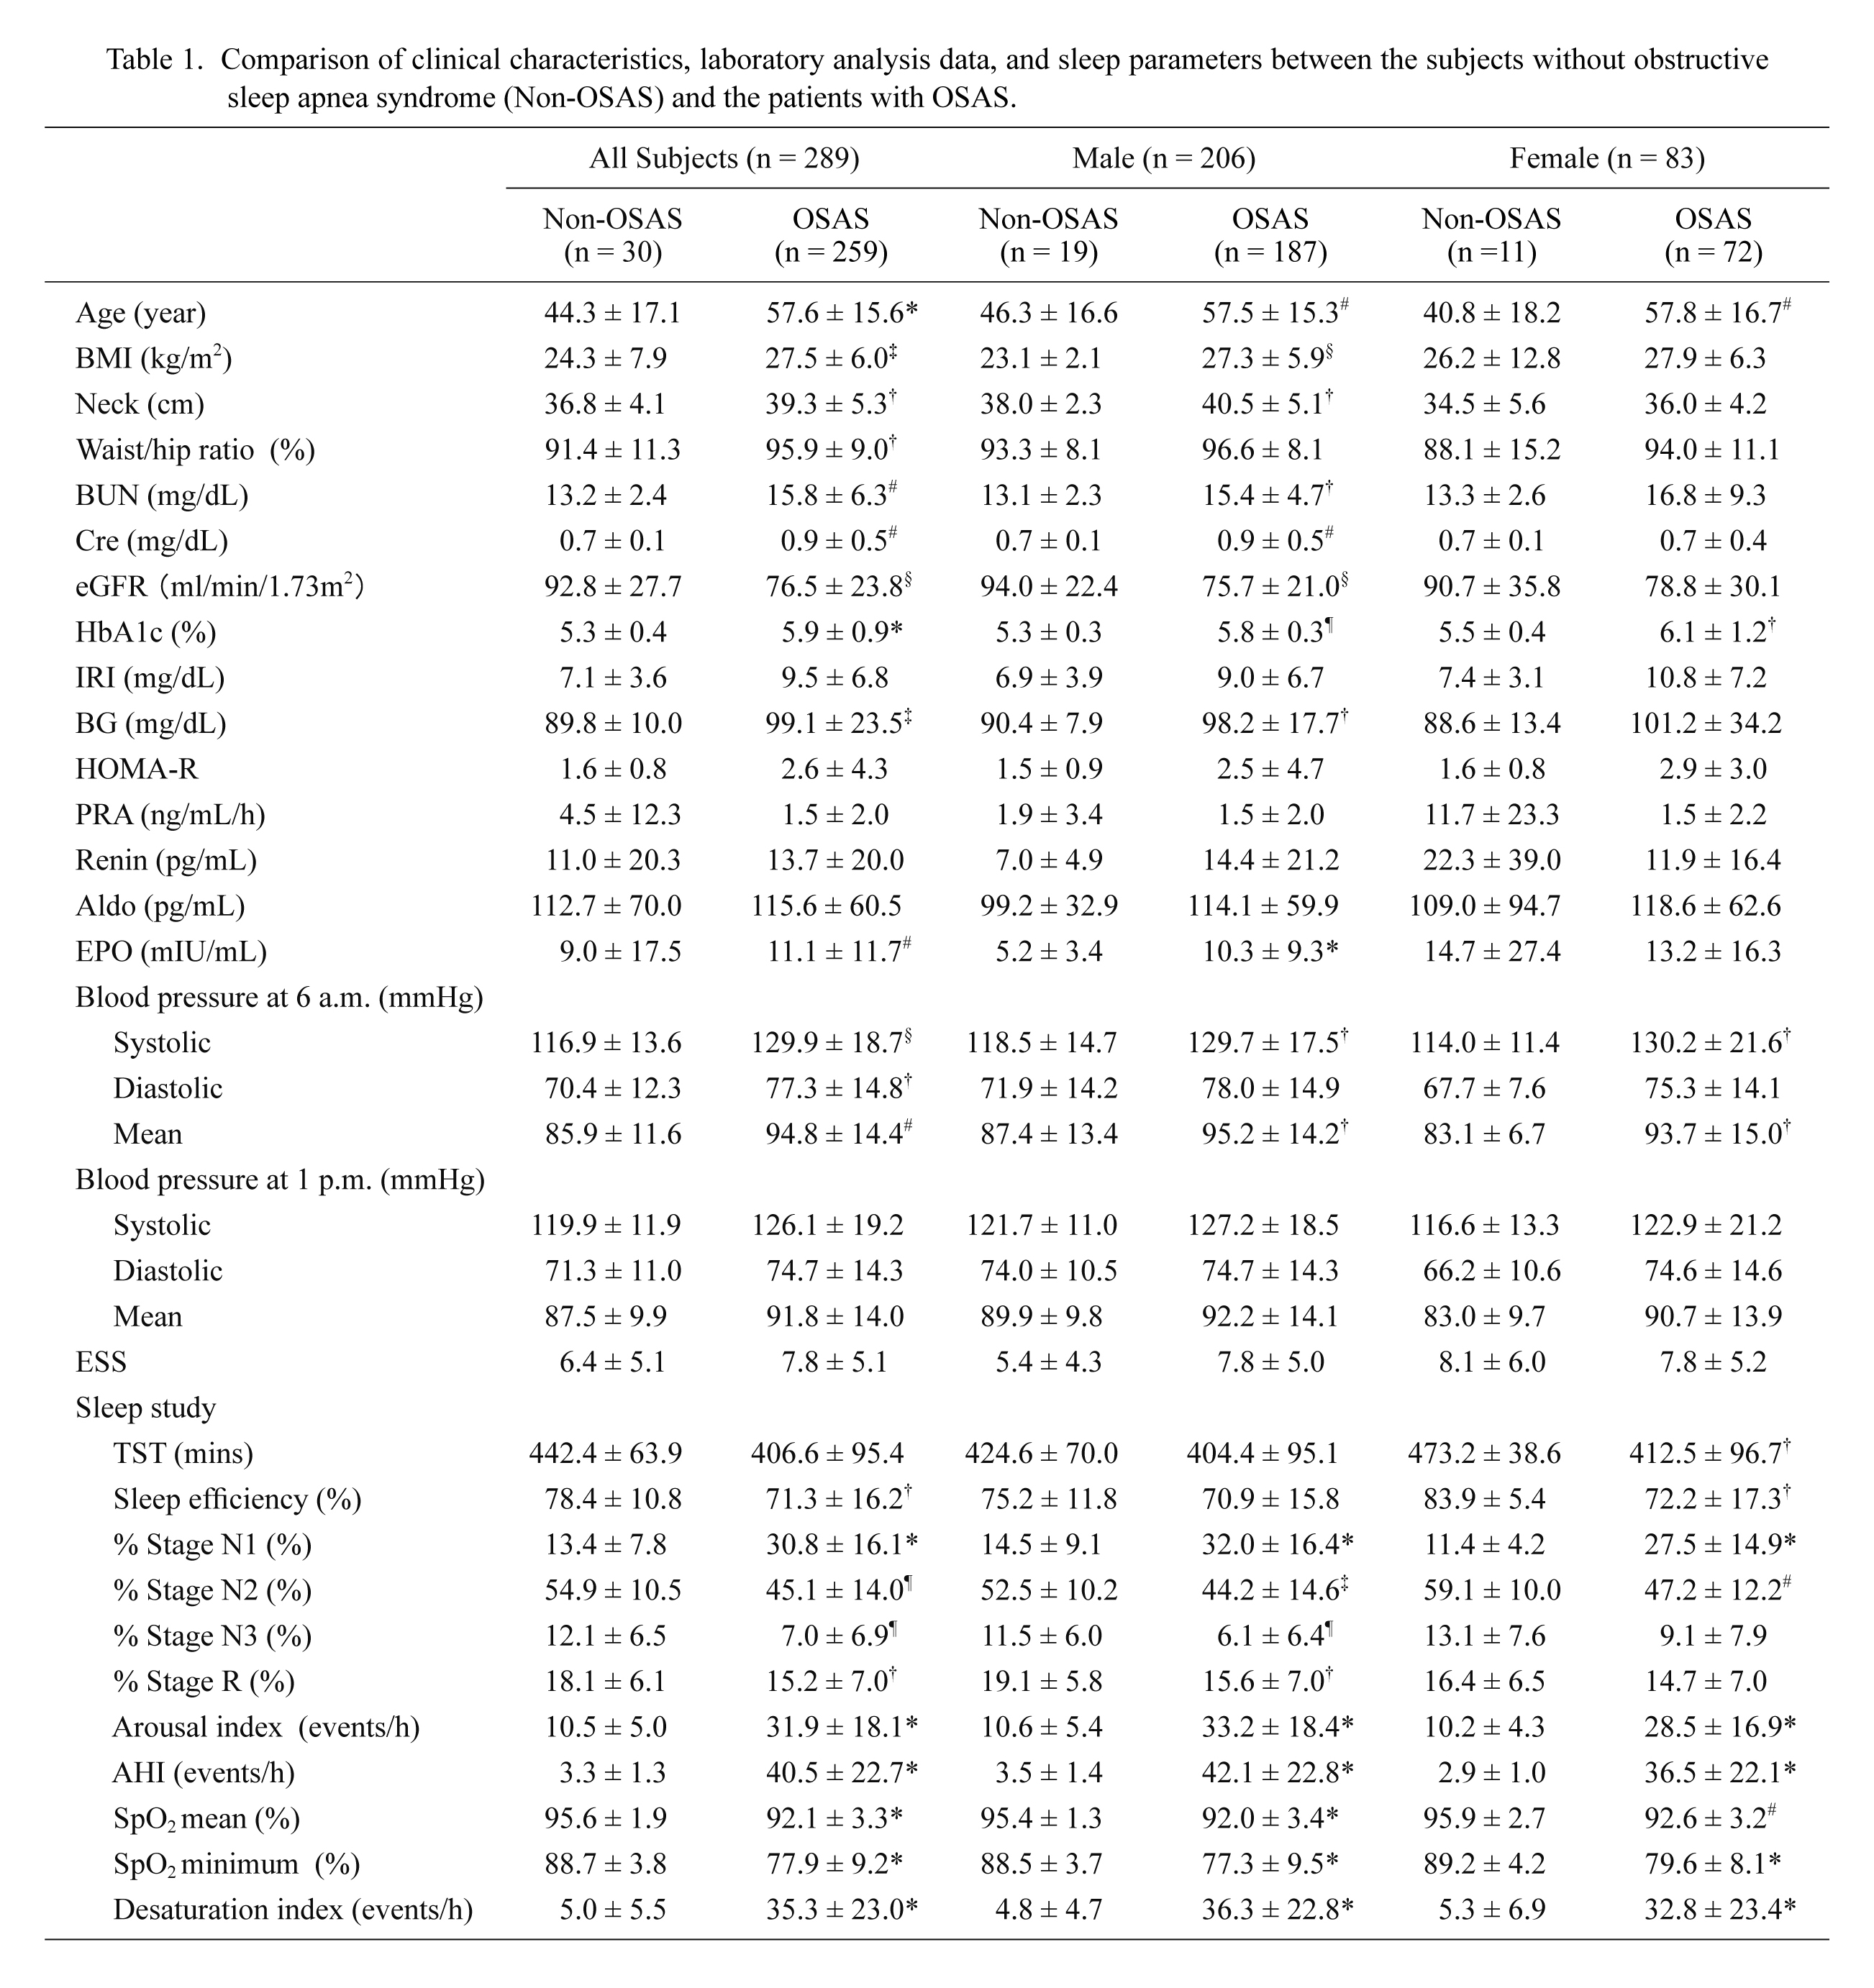
Clinical characteristics in 289 subjects are shown in Tables 1, 2 and 3. Table 1 shows comparison of clinical characteristics, laboratory analysis data, and sleep parameters between the non-OSAS group and the OSAS group in the total cohort (all subjects), male subjects, and female subjects, respectively. The age, the body mass index (BMI), neck circumference, waist/hip ratio, blood urea nitrogen (BUN), serum creatinine levels, hemoglobin A1c (HbA1c), blood glucose levels, plasma erythropoietin levels, and systolic, diastolic and mean blood pressure at 6 a.m. were significantly higher, and eGFR was significantly lower in OSAS patients than in non-OSAS control subjects of the total cohort. This tendency was similar in both sexes except for serum creatinine levels and plasma erythropoietin levels in the female subjects, and some other parameters that did not reach the statistical significance. In the sleep study, % stage non-REM sleep 1, arousal index (ArI), AHI and desaturation index were significantly greater, and sleep efficiency, % stage non-REM sleep 2 and 3, % stage REM sleep, and mean and minimum peripheral artery oxygen saturation were significantly lower in OSAS patients than in non-OSAS control subjects of the total cohort. This tendency was again similar in both sexes although the difference in some parameters did not reach the statistical significance.
Tables 2 and 3 show comparison of clinical characteristics among three groups of OSAS (mild, moderate and severe) in male and female OSAS patients, respectively. BMI, waist/hip ratio and HbA1c in male subjects (Table 2), and the age, BMI, neck circumference, HbA1c and systolic blood pressure in female subjects (Table 3) were significantly higher in severe OSAS patients, compared to mild or moderate OSAS patients. In the sleep study, % stage non-REM sleep 1, ArI, AHI, and desaturation index were significantly higher, and % stage non-REM sleep 3, and mean and minimum peripheral artery oxygen saturation were significantly lower in severe OSAS patients, compared to mild or moderate OSAS patients in both sexes (Tables 2 and 3). % Stage non-REM sleep 2 was significantly lower in male severe OSAS patients (Table 2) whereas % stage REM sleep was significantly lower in female severe OSAS patients (Table 3), when compared to respective mild or moderate OSAS patients. Moreover, the incidence of essential hypertension was significantly higher in severe OSAS patients, compared to mild or moderate OSAS patients in both sexes (Tables 2 and 3).


Blood samples were collected from cubital veins using aprotinin-added vacuum blood collection tubes at approximately 6 a.m. after undergoing PSG. Plasma was immediately isolated by centrifugation at 3,000 r.p.m. at 4°C and stored at −60°C until measurement. Plasma s(P)RR was measured by enzyme-linked immunosorbent assay (ELISA; Immuno-Biological Laboratories Co., Ltd., Fujioka, Japan) following the manufacturer’s protocols in the Department of Endocrinology and Applied Medical Science of Tohoku University Graduate School of Medicine (Nishijima et al. 2014).
Measurement of plasma renin activity and plasma renin and aldosterone concentrations
Plasma renin activity (PRA) and plasma concentrations of renin and aldosterone were measured by radioimmunoassay (SRL, Inc., Tokyo, Japan).
Nasal continuous positive airway pressure (nCPAP)
Forty one (26 males and 15 females) out of the 259 OSAS patients were treated with nCPAP (REMstar Auto M series, Philips Respironics, Andover, MA, USA). The 41 OSAS patients (8 patients with 20 ≤ AHI < 30 events/h, and 33 patients with AHI ≥ 30 events/h) were selected for nCPAP treatment based on the application criteria for the Japanese social insurance system (AHI > 20 events/h). With informed consent, blood samples were obtained from these patients before and after the nCPAP treatment for a mean of 250.9 days, and plasma s(P)RR levels were measured. Sleep parameters before and after the treatment of nCPAP in 41 OSAS patients are shown in Table 4.
The automatic pressure adjustment mode (auto CPAP) was used for the pressure setting for the initial 2 weeks of nCPAP treatment. An appropriate pressure was then determined based on the records from Average Device Pressure < 90% of time of the treatment monitor (on-board memory) installed in the nCPAP device, and the pressure was adjusted during the following treatment period.
Statistical analysis
The data are shown as means ± standard deviation (S.D.) unless otherwise stated. All statistical analyses were performed with StatView 5.0 (Abacus Concepts, Berkeley, CA, USA) and Stata 12 (StataCorp LP, College Station, TX, USA). Comparisons of clinical characteristics including PSG data between the non-OSAS and OSAS groups were done by Mann-Whitney U test. Comparison of clinical characteristics and plasma s(P)RR levels among the groups was done by one-way ANOVA followed by Tukey-Kramer test. Incidence of comorbidities was compared among three OSAS groups in each sex using m × n contingency table (Statcel 3, ESUMI Co., Ltd, Japan) followed by chi-square test with Yates’ correction for continuity.
The association between plasma s(P)RR levels and clinical characteristics including sleep parameters obtained by PSG were analyzed by Peason’s correlation coefficient. Linear trends in proportions across the categories were analyzed with chi-square test for independence. The influence of anti-hypertensive drugs on plasma s(P)RR concentrations was analyzed by analysis of covariance. Comparisons of plasma s(P)RR levels and clinical data before and after nCPAP treatment were done by paired Student’s t-test.
Results
Relationship between plasma s(P)RR concentrations and OSAS severity
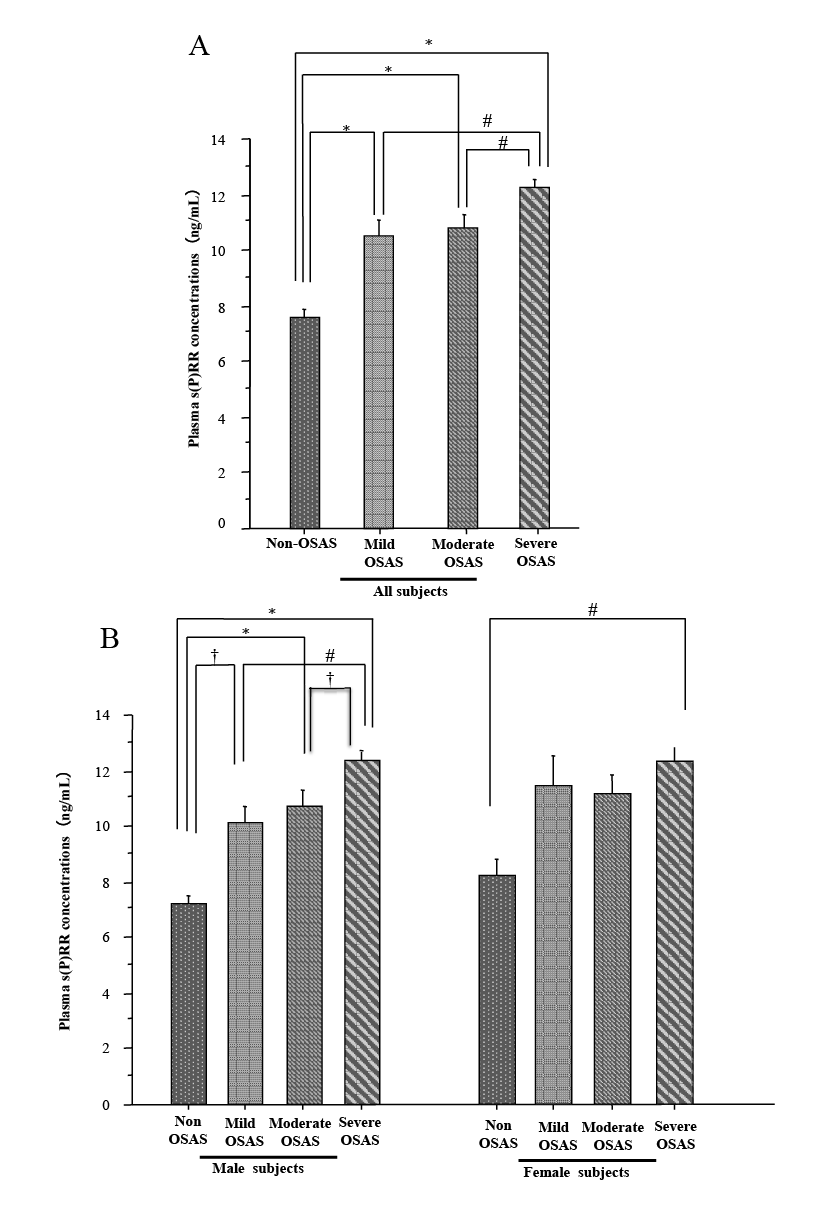
Plasma s(P)RR concentrations were significantly elevated in all three groups of OSAS patients (mild OSAS 10.5 ± 3.4 ng/mL, n = 38; moderate OSAS 10.8 ± 3.4 ng/mL, n = 56; and severe OSAS 12.3 ± 3.2 ng/mL, n = 165) compared to non-OSAS control subjects (7.5 ± 1.9 ng/mL, n = 30) in the entire cohort (p < 0.0001) (Fig. 1A). In the male subjects, plasma s(P)RR concentrations were also significantly elevated in all three groups of OSAS patients (mild OSAS 10.0 ± 3.3 ng/mL, n = 25; moderate OSAS 10.8 ± 3.4 ng/mL, n = 35; and severe OSAS 12.3 ± 3.2 ng/mL, n = 127) compared to non-OSAS control subjects (7.2 ± 1.6 ng/mL, n = 19) (Fig. 1B, the left panel). By contrast, in the female subjects, plasma s(P)RR concentrations were significantly elevated only in severe OSAS (12.2 ± 3.1 ng/mL, n = 38) compared to non-OSAS control subjects (8.2 ± 2.0 ng/mL, n = 11) (p < 0.005) (Fig. 1B, the right panel).
Plasma s(P)RR concentrations in 206 male subjects (11.3 ± 3.5 ng/mL) were not significantly different from those in 83 female subjects (11.3 ± 3.3 ng/mL). Furthermore, there was no significant difference in plasma s(P)RR concentrations between male and female subjects in each group (non-OSAS, mild OSAS, moderate OSAS, or severe OSAS).
Relationship between plasma s(P)RR concentrations and clinical characteristics including PSG parameters
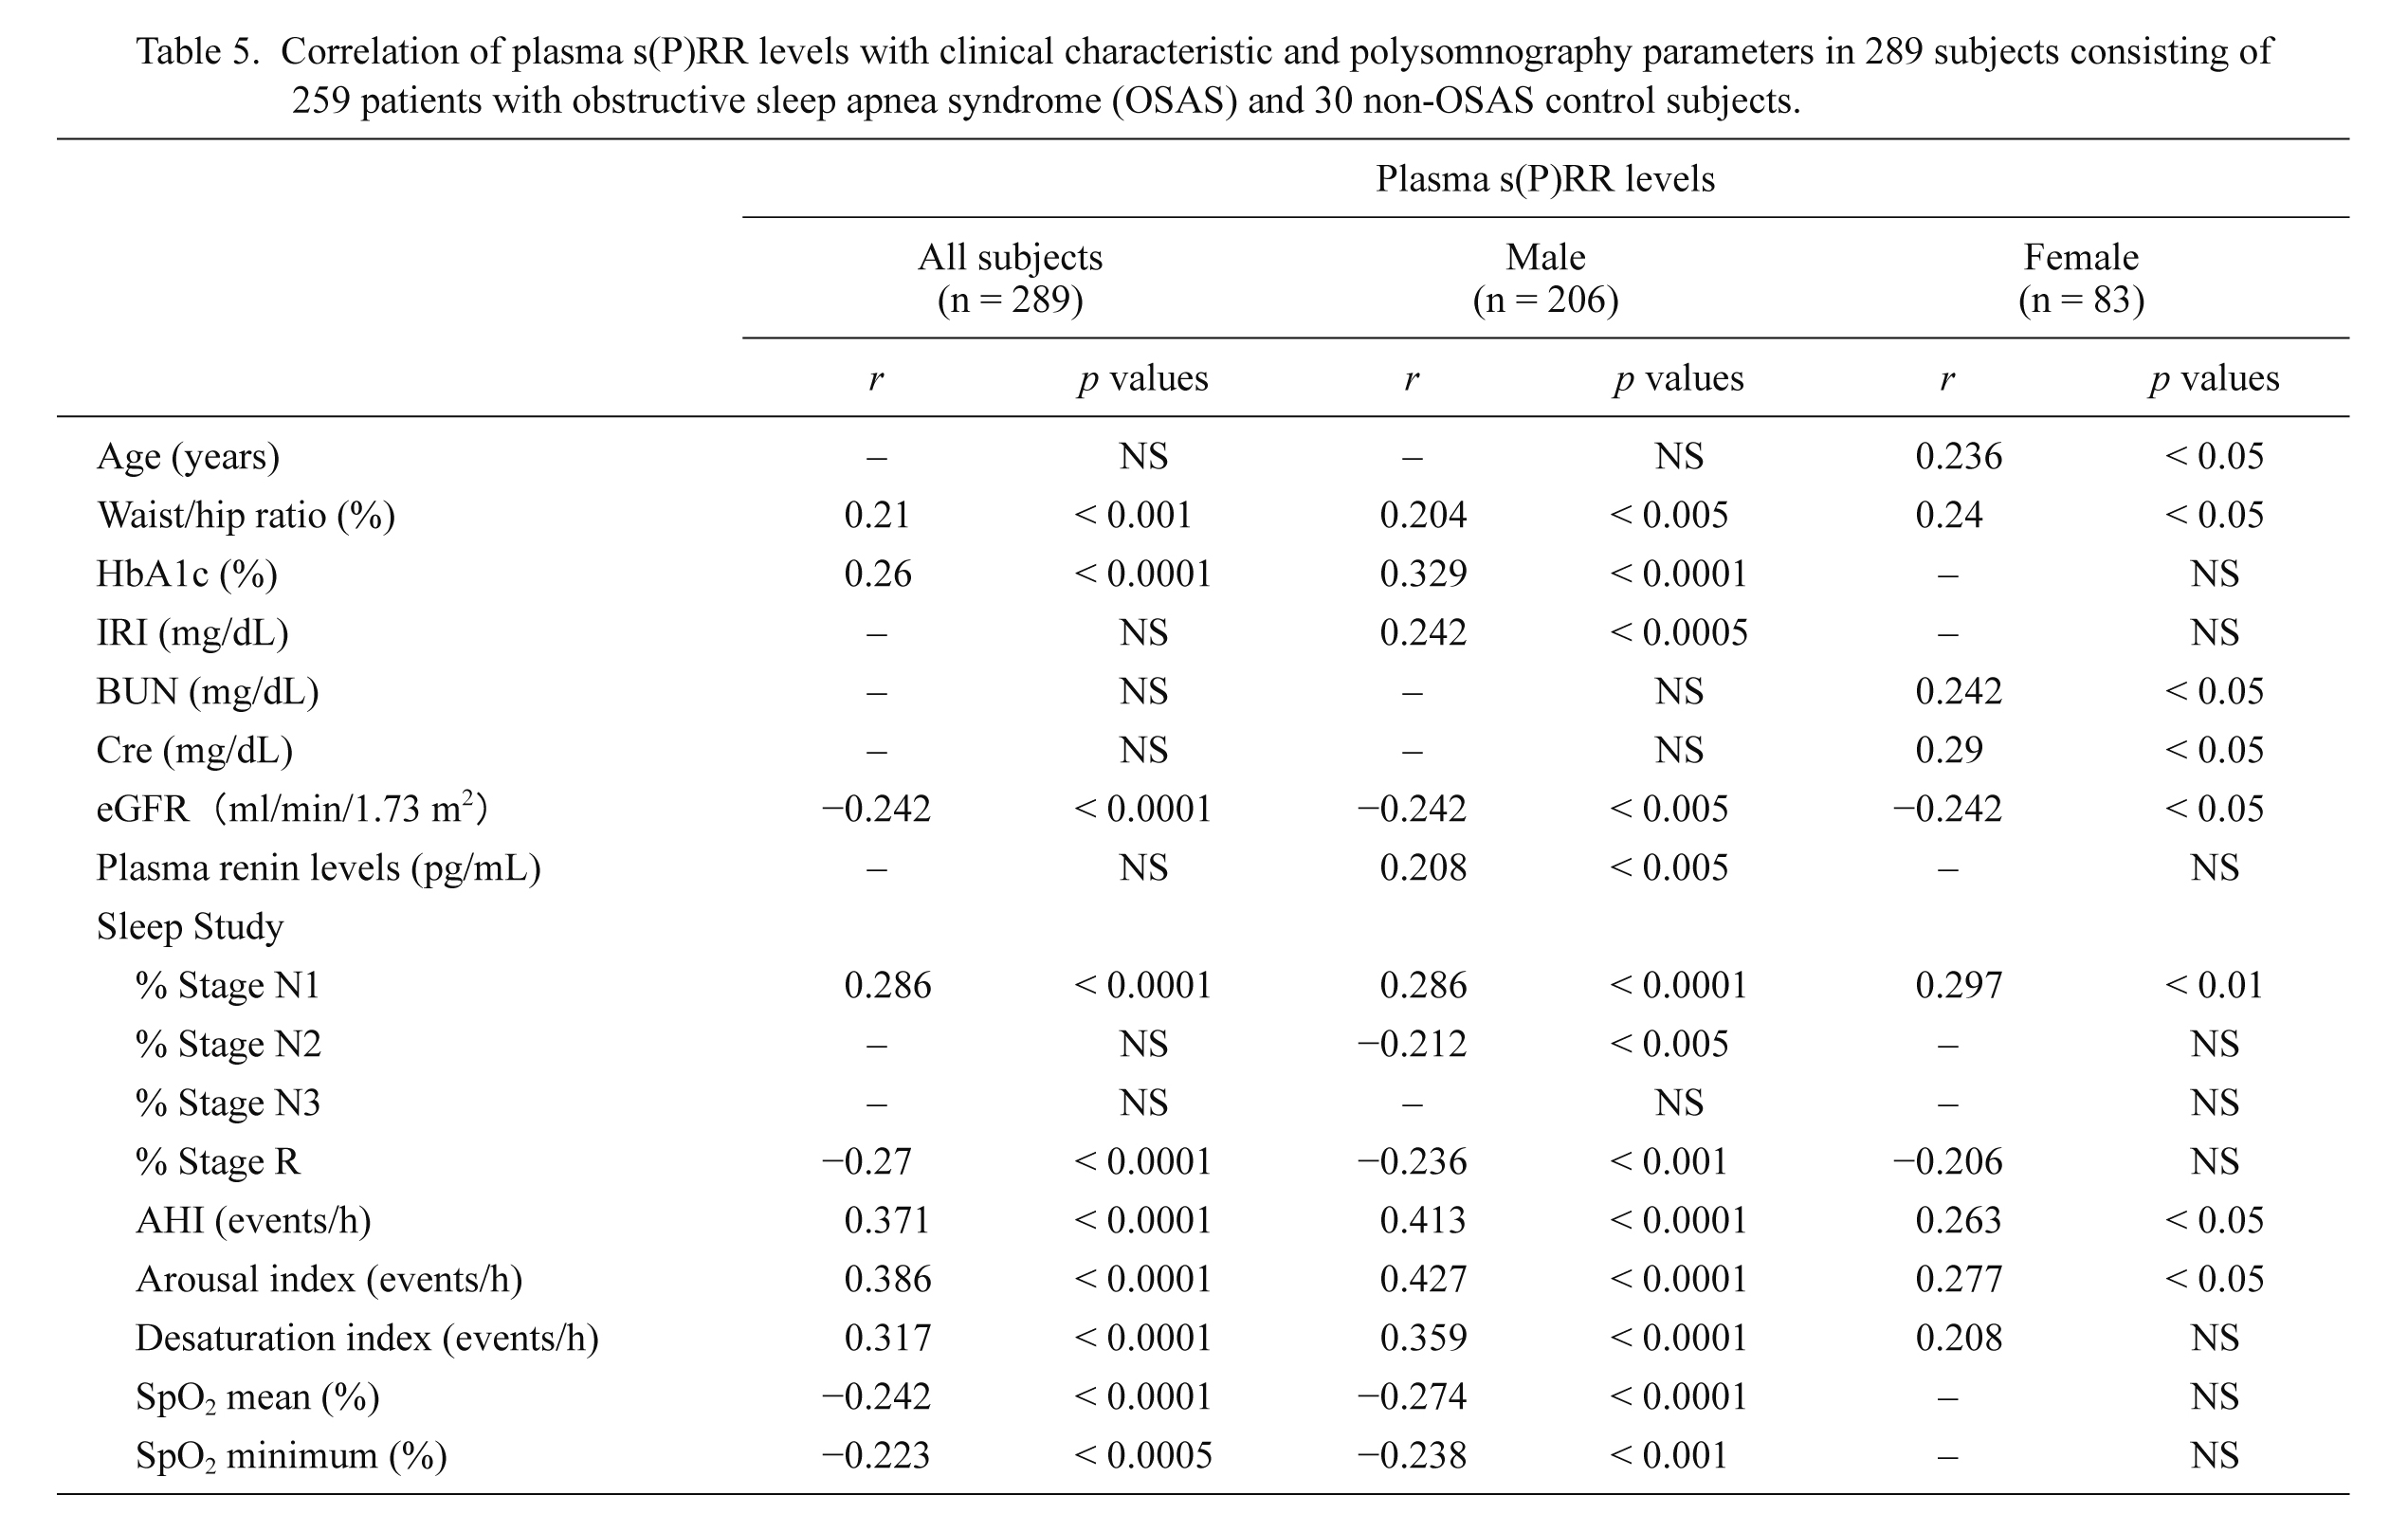
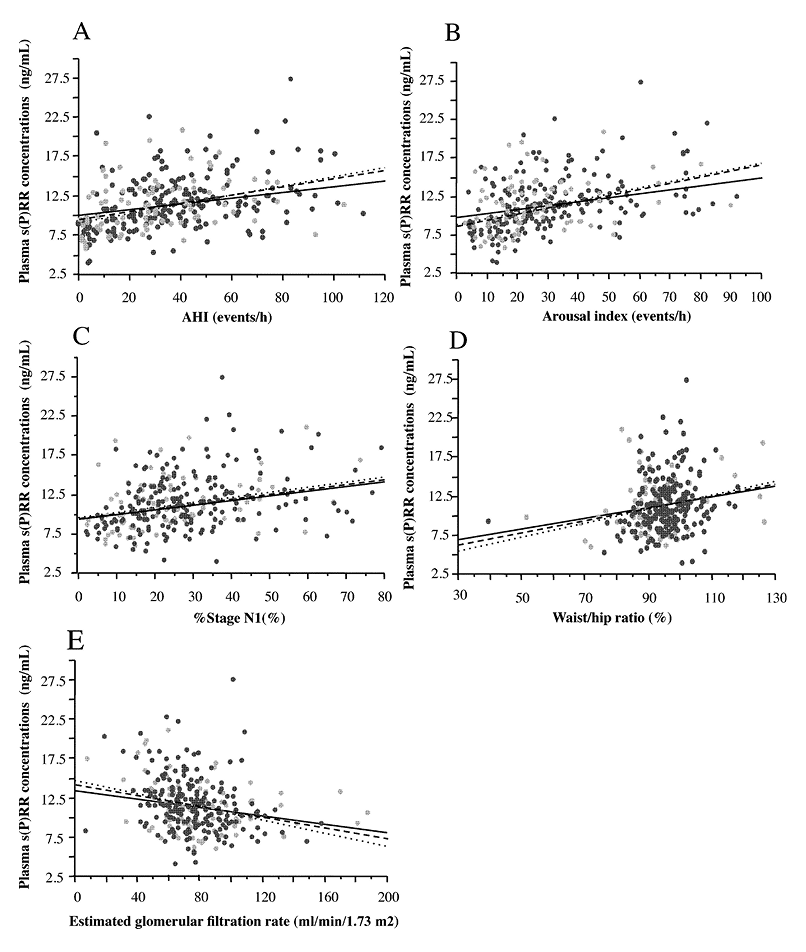
Correlations between plasma s(P)RR concentrations and clinical characteristics including PSG findings were studied in the entire cohort (n = 289), male subjects (n = 206) and female subjects (n = 86), respectively. Significant results were summarized in Table 5. The plasma s(P)RR concentrations showed significant positive correlations with AHI and ArI in either the entire cohort (AHI r = 0.371, p < 0.0001; ArI r = 0.386, p < 0.0001), male subjects (AHI r = 0.413, p < 0.0001; ArI r = 0.427, p < 0.0001), or female subjects (AHI r = 0.263, p < 0.05; ArI r = 0.277, p < 0.05) (Fig. 2A, B, Table 5), indicating that plasma s(P)RR concentrations reflected the severity of OSAS. The r values in the correlations of plasma s(P)RR levels with AHI and ArI were greater in the male subjects than in the female subjects.
Furthermore, the plasma s(P)RR levels in male subjects showed significant positive correlations with the waist/hip ratio (Fig. 2D), HbA1c, immuoreactive insulin (IRI), plasma renin levels, % stage non-REM sleep 1 (Fig. 2C) and desaturation index, and significant inverse correlations with eGFR (Fig. 2E), % stage non-REM sleep 2, % stage REM sleep, and mean and minimum peripheral artery oxygen saturation (Table 5). By contrast, the plasma s(P)RR levels in female subjects showed significant positive correlations with the age, the waist/hip ratio (Fig. 2D), BUN, serum creatinine levels, and %stage non-REM sleep 1 (Fig. 2C), and a significant inverse correlation with eGFR (Fig. 2E) (Table 5).
Plasma s(P)RR concentrations were not significantly correlated with plasma renin activity (PRA) or plasma aldosterone levels in the entire cohort, male subjects or female subjects (p > 0.05) (data not shown).
We then studied the relationship between plasma s(P)RR concentrations, and the presence of hypertension, T2DM or CKD in 187 male and 72 female OSAS patients, respectively.
There was no significant difference in plasma s(P)RR concentrations between OSAS patients complicated with hypertension and those without hypertension in both sexes (male 12.0 ± 3.6 ng/mL, n = 105 vs. 11.3 ± 3.0 ng/mL, n = 82, p > 0.15; female 11.6 ± 3.1 ng/mL, n = 35 vs. 11.9 ± 3.3 ng/mL, n = 37, p > 0.7) (Fig. 3A, B). The analysis of covariance showed no significant difference in plasma s(P)RR concentrations between OSAS patients with and without one of the following anti-hypertensive drugs; angiotensin-converting enzyme inhibitors (n = 21), angiotensin receptor antagonists (n = 79), calcium channel blockers (n = 85), direct renin inhibitors (n = 6), α-adrenergic blacking agents (n = 4), β-adrenergic blacking agents (n = 26) and diuretics (n = 28). Thus, anti-hypertensive drugs had no significant effects on plasma s(P)RR concentrations in OSAS patients.
On the other hand, plasma s(P)RR concentrations were significantly higher in OSAS patients with T2DM than in those without it in both sexes (male 13.2 ± 3.5 ng/mL, n = 41 vs. 11.3 ± 3.3 ng/mL, n = 146, p < 0.005; female 13.6 ± 3.1 ng/mL, n = 21 vs. 11.0 ± 2.9 ng/mL, n = 51, p < 0.001) (Fig. 3A, B). Moreover, plasma s(P)RR concentrations were significantly higher in OSAS patients with CKD than in those without CKD (male 12.8 ± 3.4 ng/mL, n = 39 vs. 11.4 ± 3.3 ng/mL, n = 148, p < 0.05; female 14.0 ± 3.9 ng/mL, n = 13 vs. 11.2 ± 2.8 ng/mL, n = 59, p < 0.005) (Fig. 3A, B).
We then grouped the OSAS patients into 4 groups; (1) patients without T2DM or CKD (119 males and 44 females), (2) patients with T2DM but no CKD (29 males and 15 females), (3) patients with CKD but no T2DM (27 males and 8 females), and (4) patients with both T2DM and CKD (diabetic nephropathy) (12 males and 5 females); and compared plasma s(P)RR concentrations in each sex (Fig. 3C, D). In male OSAS patients, plasma s(P)RR levels were significantly higher only in ‘patients with T2DM but no CKD’ than in ‘patients without T2DM or CKD’ (13.0 ± 3.7 ng/mL, n = 29 vs. 11.0 ± 3.2 ng/mL, n = 119, p < 0.005) (Fig. 3C). By contrast, in female OSAS patients, plasma s(P)RR levels were significantly higher in ‘patients with both T2DM and CKD (diabetic nephropathy)’ (16.7 ± 2.4 ng/mL, n = 5) than in other three groups (Fig. 3D).
Changes in plasma s(P)RR concentrations after nCPAP treatment
As shown in Table 4, the sleep parameters including AHI and ArI improved after treatment with nCPAP (duration of 250.9 ± 183.9 days) in the 41 OSAS patients (26 males and 15 females). In addition, the mean blood pressure at 6 a.m. decreased significantly from 95.2 ± 14.2 mmHg to 90.1 ± 12.4 mmHg (p < 0.05), and plasma renin concentrations increased significantly from 9.8 ± 11.8 pg/mL to 18.6 ± 27.2 pg/mL (p < 0.05) in the 41 patients treated with nCPAP. Moreover, in the 15 female patients treated with nCPAP, the systolic blood pressure at 6 a.m. decreased significantly from 142.0 ± 22.5 mmHg to 127.2 ± 22.9 mmHg (p < 0.05), but no such changes in the 26 male patients. No significant changes were observed in the other clinical data, such as BMI, serum creatinine levels, eGFR, HbA1c, IRI, blood glucose levels, HOMA-R, PRA, plasma aldosterone concentrations and plasma erythropoietin concentrations, between before and after nCPAP treatment.
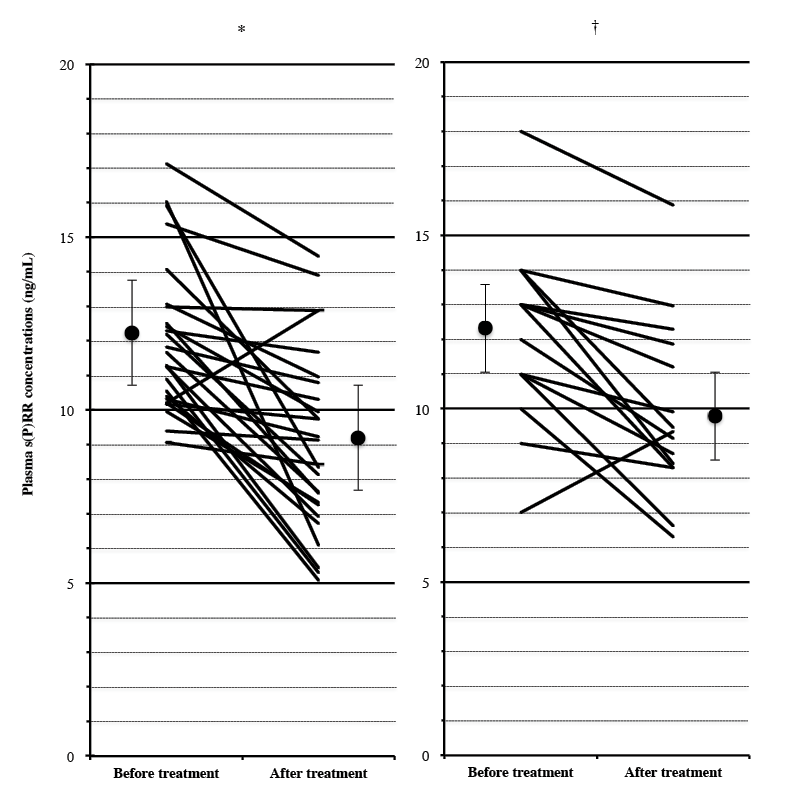
Plasma s(P)RR concentrations were significantly reduced from 12.1 ± 2.2 to 9.1 ± 2.6 ng/mL in male OSAS patients (p < 0.0001), and from 12.3 ± 2.6 to 9.9 ± 2.5 ng/mL in female OSAS patients (p < 0.05) after nCPAP treatment (Fig. 4). The presence of T2DM or CKD did not affect the reduction in plasma s(P)RR concentrations by nCPAP treatment significantly either in male or female subjects (data not shown). The patients treated with nCPAP included one male and one female OSAS patients with both T2DM and CKD. Both the patients also showed the reduction of plasma s(P)RR levels by nCPAP treatment (from 15.9 to 8.3 ng/mL and from 18.1 to 15.9 ng/mL, respectively).
Discussion
The present study has shown that plasma s(P)RR levels were elevated in OSAS patients of both sexes, with a higher association with the severity of OSAS found in male subjects. The (P)RR gene is located in the p11.4 region of the X chromosome (Nguyen 2011). In addition, OSAS occurs more frequently in men than in women (Young et al. 1993). We therefore sought sex differences of plasma s(P)RR concentrations in OSAS patients. There was no significant difference in the mean plasma s(P)RR concentrations between the male and female subjects without OSAS, consistent with the report on plasma s(P)RR in healthy subjects by Nguyen et al. (2014). However, studies on the relationship between plasma s(P)RR concentrations and clinical characteristics suggested that the severity of OSAS, the altered % sleep stages, hypoxemia during sleep and T2DM affected the plasma s(P)RR levels in male OSAS patients in a greater degree than in female OSAS patients. By contrast, the presence of diabetic nephropathy appeared to have greater effects on plasma s(P)RR levels in female OSAS patients. To the best of our knowledge, this is the first report of the sex difference in plasma s(P)RR concentrations in OSAS patients.
Plasma s(P)RR concentrations were elevated in OSAS patients complicated with T2DM or CKD in each sex. Although Watanabe et al. (2013) reported that increased plasma s(P)RR concentrations at early pregnancy may predict the development of gestational diabetes mellitus, there has been no report on elevated plasma levels of s(P)RR in patients with T2DM. Combination of OSAS and T2DM may synergistically elevate plasma s(P)RR concentrations in the present study. In addition, plasma s(P)RR concentrations were inversely correlated with eGFR, and were elevated in OSAS patients complicated with CKD in both sexes. This finding was consistent with the previous studies in non-OSAS subjects, which showed that serum s(P)RR levels correlated with renal function (Hamada et al. 2013; Morimoto et al. 2014). Particularly, higher plasma s(P)RR levels were found in female OSAS patients with both T2DM and CKD (diabetic nephropathy), but not in male OSAS patients with the same comorbidities, indicating that the presence of diabetic nephropathy is an important factor for plasma s(P)RR levels in female OSAS patients.
The present study has suggested that plasma s(P)RR concentrations are signif icantly related with the REM-non-REM cycle in OSAS patients, particularly in male patients. Fragmented sleep in OSAS patients with high ArI scores may result in the decrease of % stage REM sleep, which may partly explain the inverse correlation between plasma s(P)RR levels and % stage REM sleep in male OSAS patients. O’Connor et al. (2000) reported that obstructive sleep apnea during REM sleep is more common in women than in men, and that women have a greater clustering of respiratory events during REM sleep than do men have, probably ref lecting the sex differences in upper airway function during sleep. Obstructive sleep apnea is, therefore, less severe in women because of milder obstructive sleep apnea during non-REM sleep. The difference in obstructive sleep apnea during the REM-non-REM cycle between male and female may partly explain our f indings on the greater association between plasma s(P)RR levels and the REM-non-REM cycle in male patients.
It is noteworthy that (P)RR forms the functional complex with the v-ATPase, which plays fundamental and physiological roles in the cellular function, including prohormone processing and transport of neurotransmitters (Adams et al. 2006). Tani et al. (2015) reported that (P)RR, together with v-ATPase, played a stimulatory role in the secretion of growth hormone by pituitary tumor cells. Because (P)RR is widely distributed in the brain (Takahashi et al. 2010a, 2015), the complex of (P)RR and v-ATPase may also play essential roles in the processing and secretion of sleep-related neuropeptides, such as orexins (Nishijima et al. 2003). It is therefore tempting to speculate that s(P)RR in plasma may ref lect some disturbance in the brain function during obstructive sleep apnea. In this regard, Almendros et al. (2011) studied tissue oxygenation of brain, muscle and fat in a rat model of sleep apnea, and found that arterial oxygen saturation increased fast in brain after hypoxemia during obstructive apneas, but not in muscle or fat tissues. This response may cause harmful effects on the brain function by oxidative stress although it may protect against hypoxia.
(P)RR is expressed, however, in almost all types of organs and cells, including heart and kidney (Hirose et al. 2009b, 2010). In an 18-year study of the Wisconsin sleep cohort, Young et al. (2008) reported that all-cause mortality risk was significantly increased with severity of sleep disordered breathing, and that compared to individuals without sleep-disordered breathing, the adjusted mortality risks were highest for severe OSAS patients (AHI ≥ 30 events/h) who had not used CPAP; the hazard ratio for all-cause mortality was 3.8 and the hazard ratio for cardiovascular mortality was 5.2. Thus, they pointed out that a greater proportion of subjects with OSAS died of cardiovascular diseases. Another possible major source for elevated s(P)RR in plasma may therefore be cardiovascular and renal organs in OSAS patients.
Plasma s(P)RR concentrations significantly decreased in both male and female OSAS patients after nCPAP treatment. The p value of the male OSAS patients was lower than that of the female in the comparison of plasma s(P)RR levels between before and after the nCPAP treatment (p < 0.0001 vs. p < 0.05 in Fig. 4A), consistent with the finding that plasma s(P)RR levels before the nCPAP treatment were more highly associated with AHI and ArI in male subjects (Fig. 2A, B, Table 4). Harsch et al. (2004) reported that nCPAP treatment decreased the levels of various inflammatory cytokines and fasting leptin, and improved insulin sensitivity in OSAS patients. Moreover, Narkiewicz et al. (1999) reported that long-term CPAP treatment decreased muscle sympathetic nerve activity in OSAS patients. Possible mediators which affected changes in plasma s(P)RR concentration after nCPAP treatment may therefore include intermittent hypoxemia, oxidative stress, inflammatory cytokines, the sympathetic nerve activity, and the status of neurotransmitters/ neuromodulators in the brain. On the other hand, it remained to be clarified which mediator(s) was most directly related to the elevation of plasma s(P)RR concentrations and their reduction by treatment of nCPAP in OSAS patients.
The limitation of the present study was the small number of the female subjects. We confirmed actual power by the power analysis of the subjects in each sex (Cohen 1988). The actual power of the male subjects was more than 0.8 for the analysis shown in Figs. 1, 2 and 3, and 0.65 for Fig. 4. On the other hand, the actual power of the female subjects was more than 0.8 for the analysis shown in Fig. 2, but less than 0.35 for Figs. 1, 3 and 4. Further studies in the population containing a larger number of female OSAS patients are therefore required to draw a definite conclusion on the sex difference of plasma s(P)RR concentrations in OSAS patients.
In conclusion, plasma s(P)RR levels were elevated in OSAS patients of both sexes, with a higher association with the severity of OSAS found in male subjects. The severity of OSAS, the altered % sleep stages, hypoxemia during sleep and T2DM affected the plasma s(P)RR levels in male OSAS patients in a greater degree than in female OSAS patients. By contrast, the presence of diabetic nephropathy may have greater effects on the plasma s(P)RR levels in female OSAS patients. To the best of our knowledge, this is the first report of the sex difference in plasma s(P)RR concentrations in OSAS patients.
Acknowledgments
We thank the laboratory technicians of Iwate Medical University who performed PSG analysis. This work was partly supported by the funds of Iwate Medical University, School of Medicine, a Grant-in-aid for Scientific Research (C) from the Ministry of Education, Culture, Sports, Science and Technology (to K. Tak.) (No. 25461205), a Grant from the Kidney Foundation, Japan (to K. Tak.) (JKFB 14-9), and a Grant from the Blood Pressure and Hormone Science Association (2014) (to K. Tak.).
Conflict of Interest
The authors declare no conflict of interest.
References
-
Adams,
D.S.,
Robinson,
K.R.,
Fukumoto,
T.,
Yuan,
S.,
Albertson,
R.C.,
Yelick,
P.,
Kuo,
L.,
McSweeney,
M. &
Levin,
M.
(2006) Early, H+-V-ATPase-dependent proton flux is necessary for consistent left-right patterning of non-mammalian vertebrates. Development, 133, 1657-1671.
-
Almendros,
I.,
Farré,
R.,
Planas,
A.M.,
Torres,
M.,
Bonsignore,
M.R.,
Navajas,
D. &
Montserrat,
J.M.
(2011) Tissue oxygenation in brain, muscle, and fat in a rat model of sleep apnea: differential effect of obstructive apneas and intermittent hypoxia. Sleep, 34, 1127-1133.
-
Cohen,
J.
(1988) Statistical power analysis for the behavioral sciences, 2nd ed., Lawrence Erlbaum, Hillsdale, NJ.
-
Cousin,
C.,
Bracquart,
D.,
Contrepas,
A.,
Corvol,
P.,
Muller,
L. &
Nguyen,
G.
(2009) Soluble form of the (pro)renin receptor generated by intracellular cleavage by furin is secreted in plasma. Hypertension, 53, 1077-1082.
-
Cruciat,
C.M.,
Ohkawara,
B.,
Acebron,
S.P.,
Karaulanov,
E.,
Reinhard,
C.,
Ingelfinger,
D.,
Boutros,
M. &
Niehrs,
C.
(2010) Requirement of prorenin receptor and vacuolar H+-ATPase-mediated acidification for Wnt signaling. Science, 327, 459-463.
-
Hamada,
K.,
Taniguchi,
Y.,
Shimamura,
Y.,
Inoue,
K.,
Ogata,
K.,
Ishihara,
M.,
Horino,
T.,
Fujimoto,
S.,
Ohguro,
T.,
Yoshimoto,
Y.,
Ikebe,
M.,
Yuasa,
K.,
Hoshino,
E.,
Iiyama,
T.,
Ichihara,
A. &
Terada,
Y.
(2013) Serum level of soluble (pro)renin receptor is modulated in chronic kidney disease. Clin. Exp. Nephrol., 17, 848-856.
-
Harsch,
I.A.,
Schahin,
S.P.,
Brückner,
K.,
Radespiel-Tröger,
M.,
Fuchs,
F.S.,
Hahn,
E.G.,
Konturek,
P.C.,
Lohmann,
T. &
Ficker,
J.H.
(2004) The effect of continuous positive airway pressure treatment on insulin sensitivity in patients with obstructive sleep apnoea syndrome and type 2 diabetes. Respiration, 71, 252-259.
-
Hirose,
T.,
Hashimoto,
M.,
Totsune,
K.,
Metoki,
H.,
Asayama,
K.,
Kikuya,
M.,
Sugimoto,
K.,
Katsuya,
T.,
Ohkubo,
T.,
Hashimoto,
J.,
Rakugi,
H.,
Takahashi,
K. &
Imai,
Y.
(2009a) Association of (pro)renin receptor gene polymorphism with blood pressure in Japanese men: the Ohasama study. Am. J. Hypertens., 22, 294-299.
-
Hirose,
T.,
Mori,
N.,
Totsune,
K.,
Morimoto,
R.,
Maejima,
T.,
Kawamura,
T.,
Metoki,
H.,
Asayama,
K.,
Kikuya,
M.,
Ohkubo,
T.,
Kohzuki,
M.,
Takahashi,
K. &
Imai,
Y.
(2009b) Gene expression of (pro)renin receptor is upregulated in hearts and kidneys of rats with congestive heart failure. Peptides, 30, 2316-2322.
-
Hirose,
T.,
Mori,
N.,
Totsune,
K.,
Morimoto,
R.,
Maejima,
T.,
Kawamura,
T.,
Metoki,
H.,
Asayama,
K.,
Kikuya,
M.,
Ohkubo,
T.,
Kohzuki,
M.,
Takahashi,
K. &
Imai,
Y.
(2010) Increased expression of (pro)renin receptor in the remnant kidneys of 5/6 nephrectomized rats. Regul. Pept., 159, 93-99.
-
Huang,
Y.,
Wongamorntham,
S.,
Kasting,
J.,
McQuillan,
D.,
Owens,
R.T.,
Yu,
L.,
Noble,
N.A. &
Border,
W.
(2006) Renin increases mesangial cell transforming growth factor-beta1 and matrix proteins through receptor-mediated, angiotensin II-independent mechanisms. Kidney Int., 69, 105-113.
-
Iber,
C.,
Ancoli-Israel,
S.,
Chesson,
A. &
Quan,
S.F.
(2007) The AASM manual for the scoring of sleep and associated events: rules, terminology and technical specifications, 1st ed., American Academy of Sleep Medicine, Westchester, IL.
-
Ichihara,
A.,
Suzuki,
F.,
Nakagawa,
T.,
Kaneshiro,
Y.,
Takemitsu,
T.,
Sakoda,
M.,
Nabi,
A.H.,
Nishiyama,
A.,
Sugaya,
T.,
Hayashi,
M. &
Inagami,
T.
(2006) Prorenin receptor blockade inhibits development of glomerulosclerosis in diabetic angiotensin II type 1a receptor-deficient mice. J. Am. Soc. Nephrol., 17, 1950-1961.
-
Johns,
M.W.
(1991) A new method for measuring daytime sleepiness: the Epworth sleepiness scale. Sleep, 14, 540-545.
-
Lam,
J.C.,
Lam,
B.,
Lam,
C.L.,
Fong,
D.,
Wang,
J.K.,
Tse,
H.F.,
Lam,
K.S. &
Ip,
M.S.
(2006) Obstructive sleep apnea and the metabolic syndrome in community-based Chinese adults in Hong Kong. Respir. Med., 100, 980-987.
-
Leuenberger,
U.A.,
Brubaker,
D.,
Quraishi,
S.A.,
Hogeman,
C.S.,
Imadojemu,
V.A. &
Gray,
K.S.
(2005) Effects of intermittent hypoxia on sympathetic activity and blood pressure in humans. Auton. Neurosci., 121, 87-93.
-
Ludwig,
J.,
Kerscher,
S.,
Brandt,
U.,
Pfeiffer,
K.,
Getlawi,
F.,
Apps,
D.K. &
Schägger,
H.
(1998) Identification and characterization of a novel 9.2-kDa membrane sector-associated protein of vacuolar proton-ATPase from chromaffin granules. J. Biol. Chem., 273, 10939-10947.
-
Millman,
R.P.,
Carlisle,
C.C.,
McGarvey,
S.T.,
Eveloff,
S.E. &
Levinson,
P.D.
(1995) Body fat distribution and sleep apnea severity in women. Chest, 107, 362-366.
-
Morimoto,
S.,
Ando,
T.,
Niiyama,
M.,
Seki,
Y.,
Yoshida,
N.,
Watanabe,
D.,
Kawakami-Mori,
F.,
Kobori,
H.,
Nishiyama,
A. &
Ichihara,
A.
(2014) Serum soluble (pro)renin receptor levels in patients with essential hypertension. Hypertens. Res., 37, 642-648.
-
Nabi,
A.H.,
Kageshima,
A.,
Uddin,
M.N.,
Nakagawa,
T.,
Park,
E.Y. &
Suzuki,
F.
(2006) Binding properties of rat prorenin and renin to the recombinant rat renin/prorenin receptor prepared by a baculovirus expression system. Int. J. Mol. Med., 18, 483-488.
-
Narkiewicz,
K.,
Kato,
M.,
Phillips,
B.G.,
Pesek,
C.A.,
Davison,
D.E. &
Somers,
V.K.
(1999) Nocturnal continuous positive airway pressure decreases daytime sympathetic traffic in obstructive sleep apnea. Circulation, 100, 2332-2335.
-
Netzer,
N.C.,
Eliasson,
A.H. &
Strohl,
K.P.
(2003) Women with sleep apnea have lower levels of sex hormones. Sleep Breath., 7, 25-29.
-
Nguyen,
G.
(2011) Renin, (pro)renin and receptor: an update. Clin. Sci. (Lond), 120, 169-178.
-
Nguyen,
G.,
Blanchard,
A.,
Curis,
E.,
Bergerot,
D.,
Chambon,
Y.,
Hirose,
T.,
Caumont-Prim,
A.,
Tabard,
S.B.,
Baron,
S.,
Frank,
M.,
Totsune,
K. &
Azizi,
M.
(2014) Plasma soluble (pro)renin receptor is independent of plasma renin, prorenin, and aldosterone concentrations but is affected by ethnicity. Hypertension, 63, 297-302.
-
Nguyen,
G.,
Delarue,
F.,
Burcklé,
C.,
Bouzhir,
L.,
Giller,
T. &
Sraer,
J.D.
(2002) Pivotal role of the renin/prorenin receptor in angiotensin II production and cellular responses to renin. J. Clin. Invest., 109, 1417-1427.
-
Nishi,
T. &
Forgac,
M.
(2002) The vacuolar (H+)-ATPases: nature’s most versatile proton pumps. Nat. Rev. Mol. Cell Biol., 3, 94-103.
-
Nishijima,
T.,
Sakurai,
S.,
Arihara,
Z. &
Takahashi,
K.
(2003) Plasma orexin-A-like immunoreactivity in patients with sleep apnea hypopnea syndrome. Peptides, 24, 407-411.
-
Nishijima,
T.,
Tajima,
K.,
Takahashi,
K. &
Sakurai,
S.
(2014) Elevated plasma levels of soluble (pro)renin receptor in patients with obstructive sleep apnea syndrome: association with polysomnographic parameters. Peptides, 56, 14-21.
-
O’Connor,
C.,
Thornley,
K.S. &
Hanly,
P.J.
(2000) Gender differences in the polysomnographic features of obstructive sleep apnea. Am. J. Respir. Crit. Care Med., 161, 1465-1472.
-
Pialoux,
V.,
Hanly,
P.J.,
Foster,
G.E.,
Brugniaux,
J.V.,
Beaudin,
A.E.,
Hartmann,
S.E.,
Pun,
M.,
Duggan.,
C.T. &
Poulin,
M.J.
(2009) Effects of exposure to intermittent hypoxia on oxidative stress and acute hypoxic ventilatory response in humans. Am. J. Respir. Crit. Care Med., 180, 1002-1009.
-
Pillar,
G.,
Malhotra,
A.,
Fogel,
R.,
Beauregard,
J.,
Schnall,
R. &
White,
D.P.
(2000) Airway mechanics and ventilation in response to resistive loading during sleep: influence of gender. Am. J. Respir. Crit. Care Med., 162, 1627-1632.
-
Ryan,
S.,
Taylor,
C.T. &
McNicholas,
W.T.
(2005) Selective activation of inflammatory pathways by intermittent hypoxia in obstructive sleep apnea syndrome. Circulation, 112, 2660-2667.
-
Saris,
J.J.,
’t Hoen,
P.A.,
Garrelds,
I.M.,
Dekkers,
D.H.,
den Dunnen,
J.T.,
Lamers,
J.M. &
Jan Danser,
A.H.
(2006) Prorenin induces intracellular signaling in cardiomyocytes independently of angiotensin II. Hypertension, 48, 564-571.
-
Takahashi,
K.,
Hiraishi,
K.,
Hirose,
T.,
Kato,
I.,
Yamamoto,
H.,
Shoji,
I.,
Shibasaki,
A.,
Kaneko,
K.,
Satoh,
F. &
Totsune,
K.
(2010a) Expression of (pro)renin receptor in the human brain and pituitary, and co-localisation with arginine vasopressin and oxytocin in the hypothalamus. J. Neuroendocrinol., 22, 453-459.
-
Takahashi,
K.,
Ohba,
K. &
Kaneko,
K.
(2015) Ubiquitous expression and multiple functions of biologically active peptides. Peptides, 72, 184-191.
-
Takahashi,
K.,
Yamamoto,
H.,
Hirose,
T.,
Hiraishi,
K.,
Shoji,
I.,
Shibasaki,
A.,
Kato,
I.,
Kaneko,
K.,
Sasano,
H.,
Satoh,
F. &
Totsune,
K.
(2010b) Expression of (pro)renin receptor in human kidneys with end-stage kidney disease due to diabetic nephropathy. Peptides, 31, 1405-1408.
-
Tani,
Y.,
Yamada,
S.,
Inoshita,
N.,
Hirata,
Y. &
Shichiri,
M.
(2015) Regulation of growth hormone secretion by (pro)renin receptor. Sci. Rep., 5, 10878.
-
Young,
T.,
Finn,
L.,
Peppard,
P.E.,
Szklo-Coxe,
M.,
Austin,
D.,
Nieto,
F.J.,
Stubbs,
R. &
Hla,
K.M.
(2008) Sleep disordered breathing and mortality: eighteen-year follow-up of the Wisconsin sleep cohort. Sleep, 31, 1071-1078.
-
Young,
T.,
Palta,
M.,
Dempsey,
J.,
Skatrud,
J.,
Weber,
S. &
Badr,
S.
(1993) The occurrence of sleep-disordered breathing among middle-aged adults. N. Engl. J. Med., 328, 1230-1235.
-
Watanabe,
N.,
Bokuda,
K.,
Fujiwara,
T.,
Suzuki,
T.,
Mito,
A.,
Morimoto,
S.,
Jwa,
S.C.,
Egawa,
M.,
Arai,
Y.,
Suzuki,
F.,
Sago,
H. &
Ichihara,
A.
(2012) Soluble (pro)renin receptor and blood pressure during pregnancy: a prospective cohort study. Hypertension, 60, 1250-1256.
-
Watanabe,
N.,
Morimoto,
S.,
Fujiwara,
T.,
Suzuki,
T.,
Taniguchi,
K.,
Mori,
F.,
Ando,
T.,
Watanabe,
D.,
Kimura,
T.,
Sago,
H. &
Ichihara,
A.
(2013) Prediction of gestational diabetes mellitus by soluble (pro)renin receptor during the first trimester. J. Clin. Endocrinol. Metab., 98, 2528-2535.