Abstract
Adequate nutrition is crucial for children with cerebral palsy (CCP). However, conventional nutritional assessments may be inadequate for defining undernourished CCP. Leptin, an adipocyte hormone controlling energy expenditure, could be a useful marker. Objectives of this cross-sectional analytic study were to explore correlations between serum leptin level and nutritional status, anthropometric measurements, and biochemical parameters in 86 CCP (aged 9 ± 2 years). Subscapular (SST) and triceps (TST) skinfold thicknesses, weight, and calculated height were obtained. Body mass index and weight-for-height (WH) Z-scores were calculated. Complete blood count and serum levels of leptin and albumin were collected. CCP were classified as undernourished if their WHZ was < −2 according to the World Health Organization criteria. Correlations between anthropometric measurements, biochemical data, and serum leptin levels were evaluated. From 86 CCP, 11 (12%) children were undernourished, and SST, hemoglobin, and hematocrit were significantly lower. Serum leptin levels of nourished and undernourished CCP were 5.4 ± 6.2 and 2.9 ± 1.6 ng/mL (p < 0.001), while the reported value from normal children was 4.9 ng/mL. Serum leptin levels demonstrated a significant correlation with SST and TST (r = 0.83 and 0.72; p < 0.001). Serum leptin was the only marker significantly correlated with WHZ (r = 0.45, p < 0.001) while adjusting for covariates. A serum leptin level of 2.2 ng/mL was the optimal cutoff point for defining adequate nutritional status (WHZ ≥ −2). The measurement of serum leptin should be included in a care scheme of CCP especially during surgical evaluation.
Introduction
Cerebral palsy caused by non-progressive lesions of the immature brain resulted in persistent disorders of the movement and postures that limit daily activities (Rosenbaum et al. 2007). Adequate nutrition storage ensures sufficient energy supply and is crucial for orthopedics management in children with cerebral palsy (CCP) (Jevsevar and Karlin 1993; Lipton et al. 1999; Braun et al. 2006). An undernutrition stage in CCP undeniably associates with an increasing risk of postoperative complications (Jevsevar and Karlin 1993; Smith et al. 2009). Factors that contribute to undernutrition in CCP include caregiver-related and/or healthcare-related factors, many of which are modifiable (Henderson et al. 2007). The World Health Organization (WHO) uses weight-for-height as a parameter to indicate a chronic wasting condition (World Health Organization 2014).
Preoperative nutritional status assessment comprises several parameters. Anthropometric assessment, such as subcutaneous adipose tissue thickness and/or body mass index (BMI), has been endorsed (Soliman et al. 2000). Nevertheless, alteration in nutritional status required some time before actual changes in physical parameters could be recognized (Soylu et al. 2008). Biochemical markers, including serum albumin and total lymphocyte count, have also been recommended (Jevsevar and Karlin 1993; Braun et al. 2006; Johnston 2010). However, studies have confirmed that these parameters might not be at times an optimum choice to differentiate nutritional status in CCP from a control group (Kuperminc et al. 2010; Tomoum et al. 2010; Omeroglu et al. 2011).
Adipose tissue, a major energy storage organ, is metabolically active in supplying body energy. Leptin, a hormone regulated by the ob gene and secreted by adipocytes, controls satiety and energy expenditure through a negative feedback mechanism at the hypothalamus (Sorensen et al. 1996). Serum leptin level increases with an increased amount of total body fat store and decreases in the inadequate protein-energy stage (Havel 2000; Buyukgebiz et al. 2003; Dencker et al. 2006). Clinically, leptin has been utilized as a parameter in children with protein-energy malnutrition (Buyukgebiz et al. 2003). It is also work in concert with other mediators in controlling body inflammatory responses or bone remodeling process (Honsawek et al. 2008; Lubbeke et al. 2013). Serum leptin level may be a potential biochemical marker for evaluating nutritional status in CCP (Dencker et al. 2006; Yakut et al. 2006; Honsawek et al. 2008).
Therefore, the objective of this study was to investigate and identify correlations between serum leptin level and nutritional status, anthropometric measurements, and commonly utilized biochemical parameters in CCP.
Methods
CCP were enrolled in the cross-sectional analytic study during the June to December 2013 study period from two care settings. Demographic and clinical data, including age, gender, care setting (home vs. rehabilitation center). Ambulatory statuses were rated according to Gross Motor Function Classification System (GMFCS) level by certified physical therapists (CanChild 2015). Home-living children were those who lived at home, but visited the rehabilitation facility during normal office hours. Rehabilitation center-living children were those who lived at the rehabilitation center full time for at least 9 months prior to enrollment. We excluded CCP with a G-tube feeding, a history of previous osteotomy around the knee to ensure the reproducibility of knee height measurements and children with conditions other than cerebral palsy that affect growth, like genetic, metabolic, and cardiovascular disorders. Children from whom blood samples could not be successfully obtained were also excluded. Serum leptin levels from healthy age-matched and gender-matched children of the same ethnicity were previously published (Popruk et al. 2008; Yamborisut et al. 2009).
Anthropometric measurements
Body weight (kg) was recorded. An average of 3 times measurement of knee height (cm) was obtained in sitting position and calculated height (cm) was derived using a formula recommended by Stevenson (1995). BMI (kg/m2) was calculated using the calculated height. Subscapular skinfold thickness (SST) (mm), triceps skinfold thickness (TST) (mm) and mid-arm circumference (MAC) (cm) were each measured 3 times and averaged. Handheld caliper (Marathon (Thailand) Co., Ltd, Bangkok, Thailand) was used for measurement of SST and TST and a measuring tape was used to measure MAC. Normal references for weight and height of same age, gender, and ethnicity as the enrolled CCP were used to determine weight-for-height Z-scores (WHZ) (Department of Health, M.O.P.H. 2000).
Determination of biochemical markers
Serum samples were collected by venipuncture after overnight fasting. Serum leptin level was analyzed using an enzyme-linked immunosorbent assay (Human Leptin Duoset; R&D Systems Inc., Minneapolis, MN, USA) and leptin concentration was determined by standard concentration-optical density curve. Serum albumin level was measured by bromcresol green assay (Architect c8000; Abbott Laboratories Ltd., Wiesbaden, Germany). An automated complete blood count was performed using an Advia 2120 hematology system (Siemens, Erlangen, Germany).
Statistical analysis
Sample size was calculated using sample size estimation for correlations [α = 0.05, Zα/2 = 1.96, ρ = 0.80 (0.77-0.90)]. Differences in demographic, anthropometric, and biochemical marker measurements between the two care settings were analyzed using Student’s t-test for continuous data and chi-square test for categorical data. CCP with WHZ < −2 were classified as undernourished (World Health Organization 2014). Anthropometric and biochemical marker measurements were compared between CCP with WHZ ≥ −2 and < −2, respectively. A partial correlation (ρ) controlling for GMFCS level was calculated between serum leptin level and anthropometric measurements. A partial correlation was run to determine relationships between serum leptin and WHZ while controlling for GMFCS level and other biochemical markers. A receiver operating characteristic (ROC) curve was calculated between serum leptin level and nutritional status, as defined by WHZ. Statistical analysis was performed using Stata version 12.0 software (StataCorp LP, College Station, TX, USA). P-values < 0.05 were considered statistically significant.
This study was approved by the Institutional Review Board of the Faculty of Medicine, Chulalongkorn University (COA No. 305/2013). This study complied with all of the ethical principles set forth in the Declaration of Helsinki (1964) and all of its subsequent amendments. Written informed consent was obtained from parents or legal guardians and assent to participate was acquired from children, when possible.
Results
Eighty-six CCP (as required by sample size calculation, including 10% drop-out) of the same ethnicity met the inclusion criteria for analysis. Patient demographic and clinical data are presented in Table 1. There were no differences in demographic data between children who lived at home and children who lived at the rehabilitation center. Analysis of anthropometric measurements and biochemical markers between the two care settings showed a statistically significant difference in white blood cell counts only (Table 2). Serum leptin levels were similar in males vs. females (4.3 ± 5.7 vs. 6.1 ± 6.0 ng/mL; p = 0.16). Analysis of variance also confirmed that serum leptin levels were not different among groups of CCP according to the GMFCS levels (p = 0.95).
Of 86 CCP, 8 children (9%) were classified as moderately undernourished (WHZ < −2) and 3 children (3%) were classified as severely undernourished (WHZ < −3), as defined by WHO WHZ criteria (World Health Organization 2014). A comparison of demographic data, anthropometric measurements and biochemical markers between CCP and WHZ ≥ −2 and WHZ < −2 is shown in Table 3. Statistically significant differences were observed for SST, MAC, serum leptin level, hemoglobin, and hematocrit.
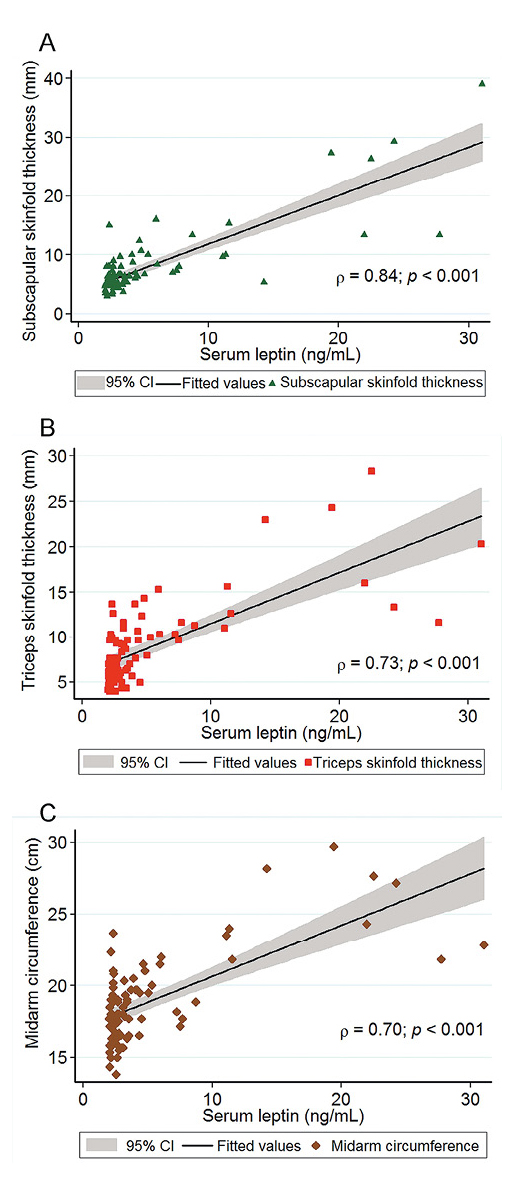
Strong positive significant correlations were identified between serum leptin level and SST, TST, and MAC (Fig. 1A-C). There was a moderate partial correlation between serum leptin level and WHZ which was statistically significant (ρ = 0.45, p < 0.001) whilst adjusting for the GMFCS level and the levels of albumin, hemoglobin, hematocrit and white blood cell, lymphocyte and platelet counts (Fig. 2). ROC curve analysis identified a serum leptin level of 2.2 ng/mL as the appropriate cut-off point for differentiating nutritional status in CCP (Fig. 3).
Discussion
Sufficient nutrition storage is a fundamental aspect for surgical planning and managements. An undernutrition stage in CCP leads to several undesirable consequences after surgical intervention and chances of postoperative complications are increased (Jevsevar and Karlin 1993; Soylu et al. 2008; Smith et al. 2009). Contributing factors to the untoward status may include impairment of swallowing muscle function, regurgitation, endocrine disorders, and quality of care facility (Jevsevar and Karlin 1993; Lipton et al. 1999; Henderson et al. 2007).
Our results demonstrated that several physical and laboratory assessments commonly employed for measuring and quantifying nutritional status of CCP could not be capable to classify CCP into normally nourished or undernourished stages (Jevsevar and Karlin 1993; Lipton et al. 1999; Smith et al. 2009; Tomoum et al. 2010; Uddenfeldt Wort et al. 2013). Although serum leptin levels have been utilized to study growth and nutritional status previously (Soliman et al. 2000; Yakut et al. 2006), our data suggested that the serum leptin levels could also be a valuable biomarker during surgical evaluation period. In this study, the nutritional status of CCP was categorized by the WHO criteria, by contrast to a previous report (Yakut et al. 2006). We verified that serum leptin was the only biochemical marker significantly correlated with WHZ after adjusting for other covariates. Thus, serum leptin is an accurate indicator for nutritional assessment in CCP. As nutritional status can influence the outcomes of surgical correction in CCP, serum leptin should be included in preoperative evaluation.
Institutionalized children are at higher risk for undernutrition (Jevsevar and Karlin 1993) and the prevalence of undernutrition was more common in non-ambulatory CCP (Yakut et al. 2006). However, Henderson et al. (2007) reported that CCP that lived in a rehabilitation facility setting had greater weight, height, and subcutaneous adipose thicknesses as a result of the regular care given by facility personnel. Our cohort showed comparable anthropometric measurements and biochemical marker data between CCP who lived at home and CCP who lived at the rehabilitation center and serum leptin level were comparable among GMFCS levels. These indicated comparable care between groups.
Although anthropometric parameters are easily measurable (Yakut et al. 2006) and have been utilized comprehensively as a preoperative screening tool, a previous study revealed that these parameters did not reflect the nutritional status of a group of CCP (Omeroglu et al. 2011). Previous study reported that CCP had lower assessment values of body weight, BMI, and TST, as compared to those of healthy children (Samson-Fang et al. 2002; Yakut et al. 2006). By contrast, another study demonstrated that anthropometric and biochemical markers could not successfully and reliably differentiate the nutritional status of CCP from their normal peers (Tomoum et al. 2010), the finding of which was confirmed in our study.
For the biochemical markers, only hemoglobin and hematocrit were significantly lower in CCP with WHZ < −2 in our study. Although total lymphocyte count of less than 1,500 cell/mm3 and serum albumin level of less than 3.5 mg/dL were associated with post-operative wound infection after spinal fusion in previous reports (Jevsevar and Karlin 1993; Adogwa et al. 2014). We confirmed that these two markers could not differentiate CCP with and without undernutrition. Tomoum et al. (2010) found that serum albumin levels of CCP were not different from those of normal children. Lipton et al. (1999) also showed that total lymphocyte count was not a predictive factor for complication after spinal fusion in CCP. As such, identification of a reliable biomarker is needed to identify CCP at risk of undernutrition.
Adipose tissue function could be viewed as a protective connective tissue or a major endocrine organ. Adipose tissue is a major source of circulating leptin in serum, which primarily regulates appetite via the hypothalamus (Sorensen et al. 1996; Havel 2000; Rondinone 2006). Subcutaneous tissue is a major adipose tissue storage area and provides protection for adjacent structures. Decreased subcutaneous tissue thickness over bone prominent areas could create a problem in patients with prominent hardware and/or postoperative wound complications (Johnston 2010). Kuperminc et al. (2010) found that anthropometry underestimated percentage of body fat in CCP with GMFCS 3 and 4. Low BMI was linked to increased risk of postoperative ileus and superior mesenteric artery syndrome after scoliosis correction in idiopathic scoliosis children (Smith et al. 2009). Low BMI could be attributed to a decrease in total body fat storage, which could reflect an inadequate amount of adipose tissue around the superior mesenteric artery. As an endocrine organ, adipose tissue plays a major role in controlling energy balance via endocrine and paracrine functions (Rondinone 2006). A previous ob/ob mice model showed that administration of leptin increased physical activity, with diminished energy availability found in mice with low serum leptin levels (Havel 2000). Serum leptin levels are also associated with a higher level of C-terminal telopeptide, a bone resorption marker that affects bone mineral density in children with biliary atresia (Honsawek et al. 2008). Diminished bone quality could lead to problems, such as implant failure after surgery. Uddenfeldt Wort et al. (2013) reported that CCP who had long-standing undernutrition had a higher chance of having fracture without trauma. Adipokines, including leptin, work in concert as the bone-adipose axis. Serum leptin has been shown to encourage bone growth and increase bone density (Gomez-Ambrosi et al. 2008), although, the link between serum leptin and bone remodeling process needs further investigations. Leptin also demonstrated a potential inflammatory pathway other than controlling the body energy balance (Lubbeke et al. 2013).
In this study, serum leptin level was correlated with thickness of subcutaneous adipose tissue, consistent with previous reports (Soliman et al. 2000; Yakut et al. 2006), and WHZ. This finding implied that thinner children (less subcutaneous adipose tissue and lower WHZ) had poorer nutritional status and might have had lower energy storage. The anthropometries are easily accessible, nevertheless, improvement in nutritional status required some time before an actual change in subcutaneous thickness and weight could be recognized (Soylu et al. 2008). Although Yakut et al. (2006) recommended TST as a preferred measurement, our findings could not distinguish difference of TST between normal and undernourished CCP defined by the WHO criteria. However, different criteria were used to define nutritional status (Yakut et al. 2006). Moreover, Dencker et al. (2006) reported that adding subcutaneous thickness data did not complement their serum leptin-body fat correlation model.
Accordingly, we propose that serum leptin could be used as an adjunct test to previously utilized parameters. Serum leptin level could be integrated into the treatment scheme, especially during orthopaedics interventions. The average serum leptin levels from age-matched and gender-matched healthy Thai children ranged from 4.9-6.2 ng/mL, comparable to serum leptin levels in CCP who were normal-nourished (WHZ ≥ −2) (Popruk et al. 2008; Yamborisut et al. 2009). Our data suggest a cut-off value of serum leptin level with good sensitivity, but only fair specificity. Although our cut-off value was lower than the value formerly reported (Dencker et al. 2006; Popruk et al. 2008; Yamborisut et al. 2009), our cut-off value should be considered as a screening tool for assessing nutritional adequacy or for proper timing for preoperative nutritional intervention in CCP.
This study does have some mentionable limitations. First, a direct comparison of WHZ and serum leptin level between CCP and their normal counterparts could provide a more insightful appraisal (Yakut et al. 2006). Second, the roles of preoperative serum leptin level and complication rates after orthopaedics procedures require further investigation.
In conclusion, increased awareness of nutritional status in CCP is essential. Serum leptin was correlated with nutritional status while controlling other covariates. Serum leptin level is an excellent biomarker for malnutrition. Our findings have justified the inclusion of serum leptin levels into a care scheme particularly a nutritional evaluation for orthopaedic intervention to determine the adequacy of nutritional status in CCP.
Acknowledgments
We thank the staff of the Foundation for the Welfare of the Crippled under the Royal Patronage of Her Royal Highness the Princess Mother, Thailand for their invaluable support during the development of this project, Ms. Dollapas Punpanich for assistance with statistical analysis, Ms. Wanvisa Udomsinprasert for technical assistance, and Mr. Kevin P. Jones for language editing. Chavarin Amarase and Soarawit Weerasopone contributed equally to the development of the manuscript and should be recognized as co-first authors. This study was supported by a grant from the Ratchadaphiseksomphot Endowment Fund, Faculty of Medicine, Chulalongkorn University (RA 57/017).
Conflict of Interest
The authors declare no conflict of interest.
References
-
Adogwa,
O.,
Martin,
J.R.,
Huang,
K.,
Verla,
T.,
Fatemi,
P.,
Thompson,
P.,
Cheng,
J.,
Kuchibhatla,
M.,
Lad,
S.P.,
Bagley,
C.A. &
Gottfried,
O.N.
(2014) Preoperative serum albumin level as a predictor of postoperative complication after spine fusion. Spine (Phila Pa 1976), 39, 1513-1519.
-
Braun,
S.V.,
Hedden,
D.M. &
Howard,
A.W.
(2006) Superior mesenteric artery syndrome following spinal deformity correction. J. Bone Joint Surg. Am., 88, 2252-2257.
-
Buyukgebiz,
B.,
Ozturk,
Y.,
Yilmaz,
S. &
Arslan,
N.
(2003) Serum leptin concentrations in children with mild-to-moderate protein-energy malnutrition. Pediatr. Int., 45, 550-554.
-
CanChild
(2015) Gross Motor Function Classification System-Expanded and Revised (GMFCS–E&R). https://canchild.ca/en/resources/42-gross-motor-function-classification-system-expanded-revised-gmfcs-e-r [Accessed: August 16, 2015].
-
Dencker,
M.,
Thorsson,
O.,
Karlsson,
M.K.,
Linden,
C.,
Wollmer,
P. &
Ahren,
B.
(2006) Leptin is closely related to body fat in prepubertal children aged 8-11 years. Acta Paediatr., 95, 975-979.
-
Department of Health, M.O.P.H.
(2000) Working group on using weight and height references in evaluating the growth status of Thai children. In Manual on Using Weight and Height References in Evaluating the Growth Status of Thai Children, Department of Health, Ministry of Public Health, Bangkok, Thailand.
-
Gomez-Ambrosi,
J.,
Rodriguez,
A.,
Catalan,
V. &
Fruhbeck,
G.
(2008) The bone-adipose axis in obesity and weight loss. Obes. Surg., 18, 1134-1143.
-
Havel,
P.J.
(2000) Role of adipose tissue in body-weight regulation: mechanisms regulating leptin production and energy balance. Proc. Nutr. Soc., 59, 359-371.
-
Henderson,
R.C.,
Grossberg,
R.I.,
Matuszewski,
J.,
Menon,
N.,
Johnson,
J.,
Kecskemethy,
H.H.,
Vogel,
L.,
Ravas,
R.,
Wyatt,
M.,
Bachrach,
S.J. &
Stevenson,
R.D.
(2007) Growth and nutritional status in residential center versus home-living children and adolescents with quadriplegic cerebral palsy. J. Pediatr., 151, 161-166.
-
Honsawek,
S.,
Chaiwatanarat,
T.,
Chongsrisawat,
V.,
Thawornsuk,
N.,
Vejchapipat,
P. &
Poovorawan,
Y.
(2008) Circulating leptin levels and bone mineral density in children with biliary atresia. Acta Paediatr., 97, 206-211.
-
Jevsevar,
D.S. &
Karlin,
L.I.
(1993) The relationship between preoperative nutritional status and complications after an operation for scoliosis in patients who have cerebral palsy. J. Bone Joint Surg. Am., 75, 880-884.
-
Johnston,
C.E.
(2010) Preoperative medical and surgical planning for early onset scoliosis. Spine (Phila Pa 1976), 35, 2239-2244.
-
Kuperminc,
M.N.,
Gurka,
M.J.,
Bennis,
J.A.,
Busby,
M.G.,
Grossberg,
R.I.,
Henderson,
R.C. &
Stevenson,
R.D.
(2010) Anthropometric measures: poor predictors of body fat in children with moderate to severe cerebral palsy. Dev. Med. Child Neurol., 52, 824-830.
-
Lipton,
G.E.,
Miller,
F.,
Dabney,
K.W.,
Altiok,
H. &
Bachrach,
S.J.
(1999) Factors predicting postoperative complications following spinal fusions in children with cerebral palsy. J. Spinal Disord., 12, 197-205.
-
Lubbeke,
A.,
Finckh,
A.,
Puskas,
G.J.,
Suva,
D.,
Ladermann,
A.,
Bas,
S.,
Fritschy,
D.,
Gabay,
C. &
Hoffmeyer,
P.
(2013) Do synovial leptin levels correlate with pain in end stage arthritis? Int. Orthop., 37, 2071-2079.
-
Omeroglu,
H.,
Inan,
U.,
Turgut,
K. &
Harmansa,
S.
(2011) Preoperative hematological assessment of pediatric patients with cerebral palsy. Acta Orthop. Traumatol. Turc., 45, 1-5.
-
Popruk,
S.,
Tungtrongchitr,
R.,
Petmitr,
S.,
Pongpaew,
P.,
Harnroongroj,
T.,
Pooudong,
S.,
Phonrat,
B.,
Yamborisut,
U.,
Chongviriyaphan,
N. &
Tungtrongchitr,
A.
(2008) Leptin, soluble leptin receptor, lipid profiles, and LEPR gene polymorphisms in Thai children and adolescents. Int. J. Vitam. Nutr. Res., 78, 9-15.
-
Rondinone,
C.M.
(2006) Adipocyte-derived hormones, cytokines, and mediators. Endocrine, 29, 81-90.
-
Rosenbaum,
P.,
Paneth,
N.,
Leviton,
A.,
Goldstein,
M.,
Bax,
M.,
Damiano,
D.,
Dan,
B. &
Jacobsson,
B.
(2007) A report: the definition and classification of cerebral palsy April 2006. Dev. Med. Child Neurol. Suppl., 109, 8-14.
-
Samson-Fang,
L.,
Fung,
E.,
Stallings,
V.A.,
Conaway,
M.,
Worley,
G.,
Rosenbaum,
P.,
Calvert,
R.,
O’Donnell,
M.,
Henderson,
R.C.,
Chumlea,
W.C.,
Liptak,
G.S. &
Stevenson,
R.D.
(2002) Relationship of nutritional status to health and societal participation in children with cerebral palsy. J. Pediatr., 141, 637-643.
-
Smith,
B.G.,
Hakim-Zargar,
M. &
Thomson,
J.D.
(2009) Low body mass index: a risk factor for superior mesenteric artery syndrome in adolescents undergoing spinal fusion for scoliosis. J. Spinal Disord. Tech., 22, 144-148.
-
Soliman,
A.T.,
ElZalabany,
M.M.,
Salama,
M. &
Ansari,
B.M.
(2000) Serum leptin concentrations during severe protein-energy malnutrition: correlation with growth parameters and endocrine function. Metabolism, 49, 819-825.
-
Sorensen,
T.I.,
Echwald,
S. &
Holm,
J.C.
(1996) Leptin in obesity. BMJ, 313, 953-954.
-
Soylu,
O.B.,
Unalp,
A.,
Uran,
N.,
Dizdarer,
G.,
Ozgonul,
F.O.,
Conku,
A.,
Ataman,
H. &
Ozturk,
A.A.
(2008) Effect of nutritional support in children with spastic quadriplegia. Pediatr. Neurol., 39, 330-334.
-
Stevenson,
R.D.
(1995) Use of segmental measures to estimate stature in children with cerebral palsy. Arch. Pediatr. Adolesc. Med., 149, 658-662.
-
Tomoum,
H.Y.,
Badawy,
N.B.,
Hassan,
N.E. &
Alian,
K.M.
(2010) Anthropometry and body composition analysis in children with cerebral palsy. Clin. Nutr., 29, 477-481.
-
Uddenfeldt Wort,
U.,
Nordmark,
E.,
Wagner,
P.,
Duppe,
H. &
Westbom,
L.
(2013) Fractures in children with cerebral palsy: a total population study. Dev. Med. Child Neurol., 55, 821-826.
-
World Health Organization
(2014) Global database on child growth and malnutrition. http://www.who.int/nutgrowthdb/about/introduction/en/index5.html [Accessed: August 18, 2015].
-
Yakut,
A.,
Dinleyici,
E.C.,
Idem,
S.,
Yarar,
C.,
Dogruel,
N. &
Colak,
O.
(2006) Serum leptin levels in children with cerebral palsy: relationship with growth and nutritional status. Neuro Endocrinol. Lett., 27, 507-512.
-
Yamborisut,
U.,
Riabroy,
N.,
Phonrat,
B. &
Tungtrongchitr,
R.
(2009) Serum leptin levels and body composition in obese Thai children. Southeast Asian J. Trop. Med. Public Health, 40, 544-552.