Abstract
Allogeneic peripheral blood stem cell transplantation (allo-PBSCT) is a curative therapy for some types of hematological disorders. However, allo-PBSCT is commonly complicated with acute graft-versus-host disease (aGVHD), characterized by host tissues being attacked by the grafted donor lymphocytes due to disparities of human leukocyte antigen (HLA) between the donor and host. By contrast, cord blood transplantation (CBT) is typically associated with low-grade severity of aGVHD, but the underlying mechanisms remain unclear. Donor-derived CD4+ alloreactive T cells (ATs) are of a specific lymphocyte subset, which can be activated by the recipient’s HLA, and play a crucial role in the onset of aGVHD. In the present study, we aimed to explore the difference in the property of CD4+ ATs between cord blood (CB) and adult peripheral blood (APB). We thus found that CB and APB CD4+ ATs contained not only effector T cells (Teffs) that execute aGVHD, but also a distinct subset of FoxP3+ regulatory T cells (Tregs) that may alleviate aGVHD. Importantly, CB CD4+ ATs contained higher percentage of FoxP3+ Tregs, compared to APB CD4+ ATs (P < 0.001), while lower percentage of Teffs (Th1, Th2 and Th17 cells) was detected in CB CD4+ ATs (P < 0.05, P < 0.001 and P < 0.05, respectively). Our findings suggest that FoxP3+ Tregs in CB CD4+ ATs may contribute to attenuating the severity of aGVHD observed after CBT.
Introduction
Allogeneic peripheral blood stem cell transplantation (allo-PBSCT) is a curative therapy for some hematological disorders, and it can be commonly complicated with acute graft-versus-host disease (aGVHD), which is a condition that donor lymphocytes recognize the host as “foreign” due to disparities of human leukocyte antigen (HLA), and then the grafted lymphocytes attack the host tissues, leading to organ damages. Cord blood transplantation (CBT) is an alternative choice when allo-PBSCT is unavailable. In addition to a rich source of cord blood (CB), it has been well documented that CBT is associated with a lower degree of severity of aGVHD, compared to allo-PBSCT or bone marrow transplantation (Rocha et al. 2000, 2004). In other words, CBT allows a greater extent of major HLA disparities between the donor and recipient, but the underlying mechanisms for this observation remain unclear so far.
Most studies addressing this issue compared the global immune cells in CB and adult peripheral blood (APB), discovering that the immaturity of CB immune cells may account for their anergy to induce aGVHD. For example, CB-derived dendritic cells (DCs) were functionally defective in triggering allogeneic reaction (Ueda et al. 2003; Chunduri et al. 2008); CD4+ effector T cells (Teffs), also named helper T (Th) cells, are the main functional executors of allogeneic reaction, and studies disclosed that CB had a smaller population of cytokine-producing CD4+ Teffs, compared to APB (Chen et al. 2006; Nitsche et al. 2007). Moreover, the subset profile of CD4+ Teffs, mainly including Th1 and Th2, was also different between CB and APB (Chalmers et al. 1998). Additionally, FoxP3, a characteristic transcription factor of regulatory T cells (Tregs), was more highly expressed in CB than in APB (Miyagawa et al. 2009).
However, aGVHD is mainly attributed to alloreactive T cells (ATs), a small proportion of transplanted T cells from the donor, which can recognize the host’s allogeneic antigens (alloantigens) and be activated, and then mediate injury to the host tissues. Although immunologic features of the global CD4+ T cells in CB and APB were different, little is known about the differences between CB and APB-derived CD4+ ATs. One study revealed that CB naïve CD4+ T cells exhibited impaired activation by allogeneic antigen presenting cells (APC) and failed to Th1 differentiation compared to APB naïve CD4+ T cells (Chen et al. 2006). In addition, some newly identified distinct CD4+ T-cell subsets, such as Tregs and Th17 cells, have also been assumed to exert important roles in aGVHD (Taylor et al. 2002; Ermann et al. 2005; Carlson et al. 2009), which raised our interests to evaluate not the global CD4+ T cells but the specific subset of cells responsible for aGVHD in CB and APB allografts.
In the present study, we used the purified CD4+ CD25− T cells derived from CB or APB as responder cells to be activated by alloantigens, and the CD4+ ATs, which were identified by the acquired expression of an activation marker CD25, were further evaluated and compared in terms of their precursor frequency, accessibility of being activated by alloantigens (alloactivation), proliferative capability and subsets constitution.
Materials and Methods
Cell isolation and purification
APB and CB samples were used to prepare CD4+ CD25− responder T cells, respectively collected from healthy donors and placentas of normal full-term deliveries at our hospital. This study was performed in accordance with the principles of the 1964 Declaration of Helsinki, and approved by the ethics committee of our hospital.
CB or APB mononuclear cells (MNCs) were isolated by Ficoll (HAO YANG, Tianjin, China) density gradient centrifugation and washed twice with RPMI 1640 (Gibco, Carlsbad, CA). MNCs were frozen in liquid nitrogen, and thawed before further manipulations. CD4+ CD25− responder T cells were purified by magnetic activated cell sorting (MACS) (Miltenyi Biotec, Auburn, CA) according to the manufacturer’s introductions, and the purity was more than 98%. Briefly, about 1 × 10⁷ cells were magnetically labeled with a cocktail of biotin-conjugated monoclonal antibodies (mAbs) against a series of non-CD4+ cell surface markers, and then incubated with anti-biotin mAb coated-microbeads. As a result, the labeled non-CD4+ cells were depleted and unlabeled CD4+ T cells were remained in the suspension after flowing through the magnetic column. Next, the enriched CD4+ T cells were labeled with anti-CD25 mAb conjugated MicroBeads and finally CD4+ CD25− T cells were obtained for further use. Similarly, anti-CD25 mAb conjugated MicroBeads were also used for the isolation of CD4+ ATs where indicated.
MNCs from the peripheral blood of three healthy volunteers were mixed and then utilized as allogeneic stimulator cells. Before being co-cultured with responder cells, stimulator cells were treated with mitomycin (25 μg/ml) (Sigma, St. Louis, MO) to perish their capacity of division.
Carboxyfluorescein diacetate succinimidyl ester (CFSE) labeling and cell division analysis
Since CD4 molecules on responder T cells tend to be partially lost after activation, it is not appropriate to use CD4 as a marker for gating ATs for flow cytometric (FCM) analysis. Therefore, CD4+ CD25− responder T cells were labeled with CFSE (Molecular Probes, Eugene, OR) so that they can be distinguished from stimulator cells during FCM analysis. CFSE labeling was performed following the manufacturer’s instructions. Briefly, responder T cells were resuspended in phosphate buffered saline (PBS) with 5% fetal bovine serum (FBS) (Gibco, Carlsbad, CA) at a concentration of less than 1 × 10⁷/ml, and then CFSE solution was added to the cell suspension to achieve a working concentration of 5 μM. After thorough mixing, we kept cells to be labeled with CFSE by incubating for 5-10 min at room temperature. Finally, labeling was stopped by adding 10 volumes of PBS with 5% FBS, and cells were washed twice and counted before seeded as responder cells.
In addition to identifying separate parties in the co-culture system, CFSE dilution analysis was also used in this study to track the division of responder cells driven by alloantigens, since each cell division leads to a sequential halving of fluorescence intensity which can be supervised by using FCM. Precursor frequency and cell division were analyzed with FlowJo software (V7.6.1, Stanford, CA).
One-way mixed lymphocytes reaction (MLR)
CFSE-labeled responder cells (R) derived from CB or APB were plated in triplicate in 96-well round bottom microtiter plates at a density of 1 × 10⁵ cells per well, and irradiated HLA-mismatched stimulator cells (S) were added to the co-culture system at a ratio of 1:1 (S/R). Phytohemagglutinin (PHA, 5 μg/ml) (Sigma, St. Louis, MO)-stimulated responder cells were used as the positive control, and responder cells stimulated by mitomycin-treated autologous MNCs were used as the negative control. Co-stimulation was provided by the addition of anti-CD28 and anti-CD49d mAbs (BD Fast Immune, San Jose, CA) both at 1 μg/ml to the MLR or control cultures. Mixed lymphocytes were cultured in a final volume of 200 μL RPMI 1640 supplemented with 100 IU/ml penicillin, 100 μg/ml streptomycin, 2 mM L-glutamine, and 10% heat-inactivated FBS, and placed at 37°C under 5% CO2 humidified atmosphere.
For alloactivation analysis, intracellular antigen staining and CD25+ ATs isolation, co-cultures were harvested on day 5, at which time point the expression of CD25 reached a peak level, according to our sequential observations and others’ experiences (Amrolia et al. 2003). On day 8, the remaining cultures were harvested for cell division analysis with CFSE dilution method, when the maximum proliferation was observed in our MLR system.
Intracellular antigen staining and FCM analysis
For intracellular cytokine staining, a Protein Transport Inhibitor Cocktail (eBioscience, San Diego, CA) containing both monesin and brefeldin was added 6 to 10 hours before the end of co-culture to inhibit cytokine exclusion. Cells were harvested and washed twice with PBS, and then non-viable cells were stained with LIVE/DEAD Fixable Violet Dead Cell Stain Kit for 405 nm excitation (Invitrogen, Eugene, OR). After washed twice, cells were stained with phycoerythrin (PE)-anti-CD25 mAb (eBioscience, San Diego, CA). Next, different staining protocols were adopted according to the detected antigens: for INF-γ, IL-4 and IL-17A, cells were firstly fixed with reagent A (FIX & PERM, Caltag Laboratories, Burlingame, CA), and then permeabilized with reagent B while incubating with mAbs against INF-γ, IL-4, and IL-17A. In case of FoxP3, the staining buffer specific for FoxP3 (eBioscience, San Diego, CA) was applied, where cell fixation and permeabilization were performed simultaneously, after which mAbs against FoxP3 were used to stain the intranuclear antigens separately. Corresponding isotype mAbs were used to determine the negative confidence interval of each antigen. Phycoerythrin-cyanin7 (PE-Cy7)-anti-IFN-γ, allophycocyanin (APC)-anti-IL-4, phycoerythrin-cyanin5 (PE-Cy5)-anti-FoxP3 and corresponding isotype mAbs were all purchased from eBioscience (San Diego, CA), allophycocyanin-cyanin7 (APC-Cy7)-IL-17A and its isotype mAbs were purchased from BioLegend (San Diego, CA). Phenotypic and intracellular antigen detection of all samples was performed by multi-color FACS (FACSAria, BD Biosciences). FlowJo (V7.6.1, Stanford, CA) was used for data analysis and graph making.
Reverse transcription-polymerase chain reaction (RT-PCR)
RT-PCR was performed in some experiments to evaluate relative mRNA levels of lineage-specific transcription factors for CD4+ ATs. Briefly, CB and APB co-cultures were respectively harvested after four days’ MLR, and then CD25+ ATs were magnetically isolated with anti-CD25 mAb conjugated MicroBeads (Miltenyi Biotec, USA) for further manipulations, and the purity of CD25+ cells was more than 95%. Total RNA was extracted from the enriched CD25+ cells by using TRIzol reagent (Invitrogen, Carlsbad, CA), and then converted to cDNA, which was further used as the template for PCR with PrimeScript™ RT-PCR Kit (Takara Biotech, Shiga, Japan), according to the manufacturer’s instructions. Sequences of primers used in this study were listed in Table 1. A relative level of target mRNA was determined with Quantity One software (Version 4.6.2, Bio-Rad, USA) by using glyceraldehyde 3-phosphate dehydrogenase (GAPDH) mRNA as the reference.
Western blot analysis
Due to the limited number of enriched CD25+ cells available for analysis, total protein was extracted from the phenol-ethanol supernatant layer left over after aqueous phase was removed for RNA isolation with TRIzol reagent. Equal amount of heated protein (20 µg/lane) was subjected to SDS-PAGE, and then transferred onto PVDF membranes (Millipore, Milford, MA). Nonspecific binding sites on membranes were treated with 5% nonfat dry milk in Tris-buffered saline to block the nonspecific binding sites for one hour, followed by incubations with individual primary antibodies overnight at 4°C, including anti-T-bet, anti-GATA3, anti-RORγt, anti-FoxP3 and anti-β-actin mAbs (all from CST, Danvers, MA). Next, the membranes were treated with horseradish peroxidase-conjugated secondary antibodies for one hour, followed by a detection with an enhanced chemiluminescence reagent (seven sea biotech, Shanghai, China). The expression of protein relative to β-actin was also analyzed with Quantity One software.
Enzyme linked immunosorbent assay (ELISA)
In order to detect Tregs-associated cytokines, purified CD25+ cells from both CB and APB MLR were resuspended with serum-free culture medium at 1 × 10⁶ cells/ml in separate experiments, and seeded into 96-well plates in triplicates, and kept resting or incubated with allogeneic stimulator cells at a ratio of 1:1 in the presence of anti-CD28 and anti-CD49d mAbs, and the total volume of culture was 200 μl per well. After four days’ culture, IL-10 and TGF-β1 levels in the supernatants were measured by using ELISA kits (R&D, Minneapolis, MN), according to the protocols described by the manufacturer. All samples were detected in duplicates.
Statistical analysis
All data were represented as means ± standard deviation (SD). Normal distribution was evaluated with Kolmogorov-Smirnov test, and homogeneity of variance was assessed with Levene’s test. 2-tailed student’s t-test was used for compared data following normal distribution and with equality of variance, or else Kruskal-Wallis test was adopted. All statistical analysis was executed on SPSS 19.0 software (IBM, Chicago, IL). P values less than 0.05 were considered statistically significant.
Results
Alloactivation of CD4+ATs
CB or APB CD4+ CD25− responder T cells were stimulated by allogeneic stimulator cells combined with the co-stimulation of anti-CD28/CD49d mAbs. After stimulation, CD4+ ATs became morphologically larger than the resting cells. Thus, lymphocytes and lymphoblasts were used when performing gating on Forward Scattering/Side Scattering (FSC/SSC) interface of FCM analysis. After dead cells were excluded, CFSE+ (CFSEbright and CFSEdim) responder cells can be obviously distinct from CFSE− stimulator cells and can be easily gated for ATs analysis. To the best of our knowledge, there had been no widely recognized marker specific for ATs. We thus used the acquired expression of a T cell-activation marker CD25 (α subunit of IL-2 receptor) as the identification of ATs.
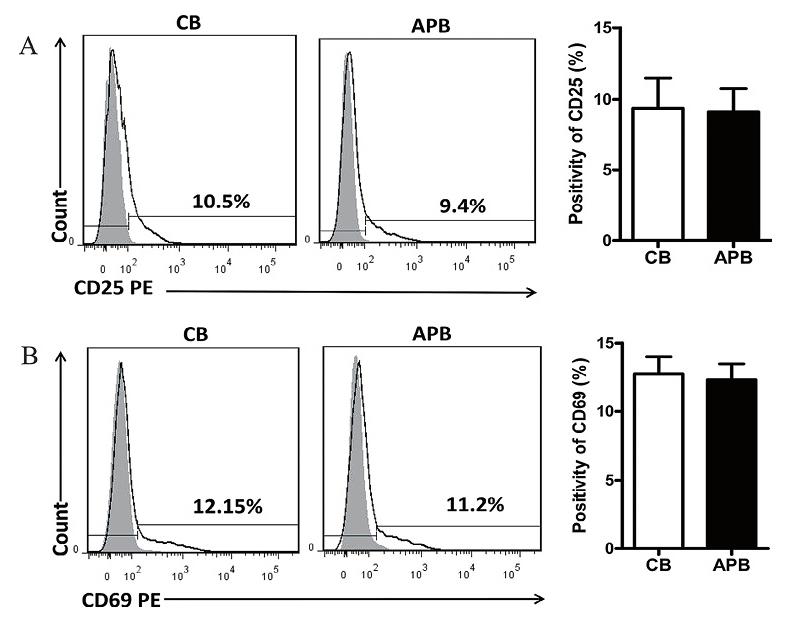
After four days’ co-culture, the alloactivation of responder cells reached a peak both in CB and APB, validated by their respective levels of CD25 expression. However, the percentage of CD25+ cells was not statistically different between CB and APB responder cells (9.36% ± 0.64% vs. 9.06% ± 0.53%, P > 0.05) (Fig. 1A). Moreover, CD69, another commonly used marker for early activation of T cells (Simms and Ellis 1996), was also detected, and the frequency of CD69+ cells in CB and APB responder cells was similar (12.76% ± 1.24% vs. 12.36% ± 1.12%, P > 0.05) (Fig. 1B).
Frequency of CD4+ATs precursors and their proliferative capability
CFSE is a cytoplasmic fluorescent dye which can be effectively used to monitor lymphocyte proliferation due to the progressive halving of fluorescence intensity within daughter cells after each cell division. CD4+ ATs make up only a small proportion of the whole CD4+ T cell population, and the duration of co-culture in this study was no more than seven days. Thus, cells were unlikely to proliferate to the extent that CFSE fluorescence decayed to be undistinguished from the autofluorescence background of stimulator cells, which was validated in our preparing experiments. We used mixed APB MNCs as stimulators, and the frequency of CD4+ alloreactive precursors under this stimulating condition was not different between CB and APB (3.67% ± 0.75% vs. 4.23% ± 0.96%, P > 0.05) through a curve fitting analysis with FlowJo software (Fig. 2A, B). Moreover, the proliferative capability of CD4+ ATs in CB and APB was also similar, as illustrated by the percentage of CFSEdim cells in responder cells (13.80% ± 1.57% vs. 13.43% ± 1.49%, P > 0.05) (Fig. 2A, C).

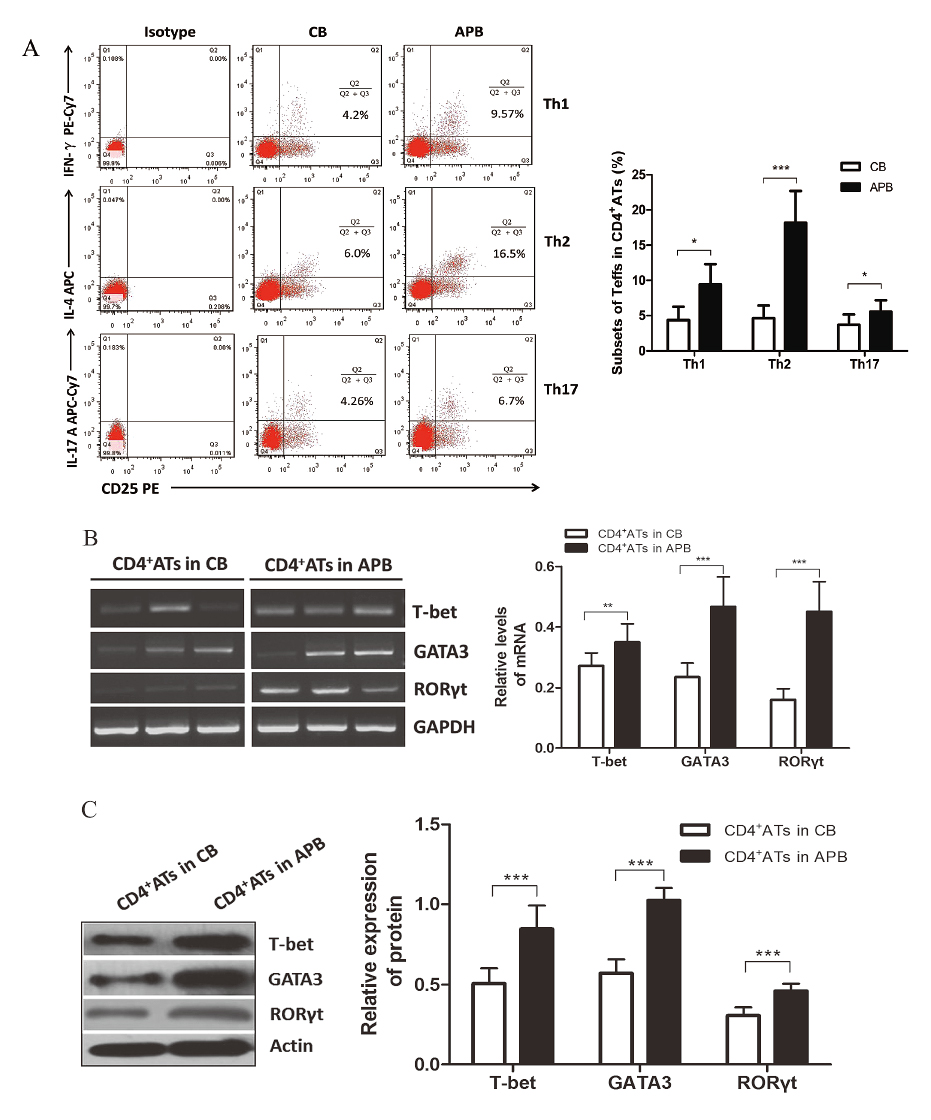
Pathophysiological changes of aGVHD have been considered to be mediated by the cytokines produced by the donor’s alloreactive Teffs, and different subsets of Teffs may play different roles in the tissue damages of aGVHD (Coghill et al. 2011). Therefore, we evaluated the subsets of CD4+ CD25+ alloreactive Teffs after four days’ alloantigen stimulation (allostimulation). A specific subset of Teffs was determined by the representative cytokine; namely, CD4+ CD25+ IFN-γ+ cells, CD4+ CD25+ IL-4+ cells and CD4+ CD25+ IL-17A+ cells were considered as alloreactive Th1, Th2 and Th17 cells, respectively.
In contrast to APB, CB CD4+ ATs contained lower percentage of Th1 (4.37% ± 1.90% vs. 9.42% ± 2.89%, P < 0.05), Th2 (4.63% ± 1.80% vs. 18.20% ± 4.50%, P < 0.001) and Th17 cells (3.70% ± 1.45% vs. 5.56% ± 1.62%, P < 0.05) (Fig. 3A). Furthermore, we were able to isolate CD4+ ATs from the co-cultures with MACS according to the acquired marker CD25, and relative mRNA and protein expression levels of linage-specific transcription factors, including T-bet for Th1, GATA3 for Th2, and RORγt for Th17 cells, were evaluated with RT-PCR and western blotting analyses, respectively. In correspondence with the detection of Teffs subsets using FCM, CB CD4+ ATs exhibited significantly lower levels of both T-bet mRNA (0.27 ± 0.04 vs. 0.34 ± 0.06, P < 0.01) and protein (0.50 ± 0.09 vs. 0.84 ± 0.14, P < 0.001), GATA3 mRNA (0.23 ± 0.04 vs. 0.46 ± 0.09, P < 0.001) and protein (0.57 ± 0.08 vs. 1.02 ± 0.07, P < 0.001), RORγt mRNA (0.16 ± 0.03 vs. 0.45 ± 0.09, P < 0.001) and protein (0.30 ± 0.05 vs. 0.46 ± 0.04, P < 0.001), compared to their APB counterparts (Fig. 3B, C).
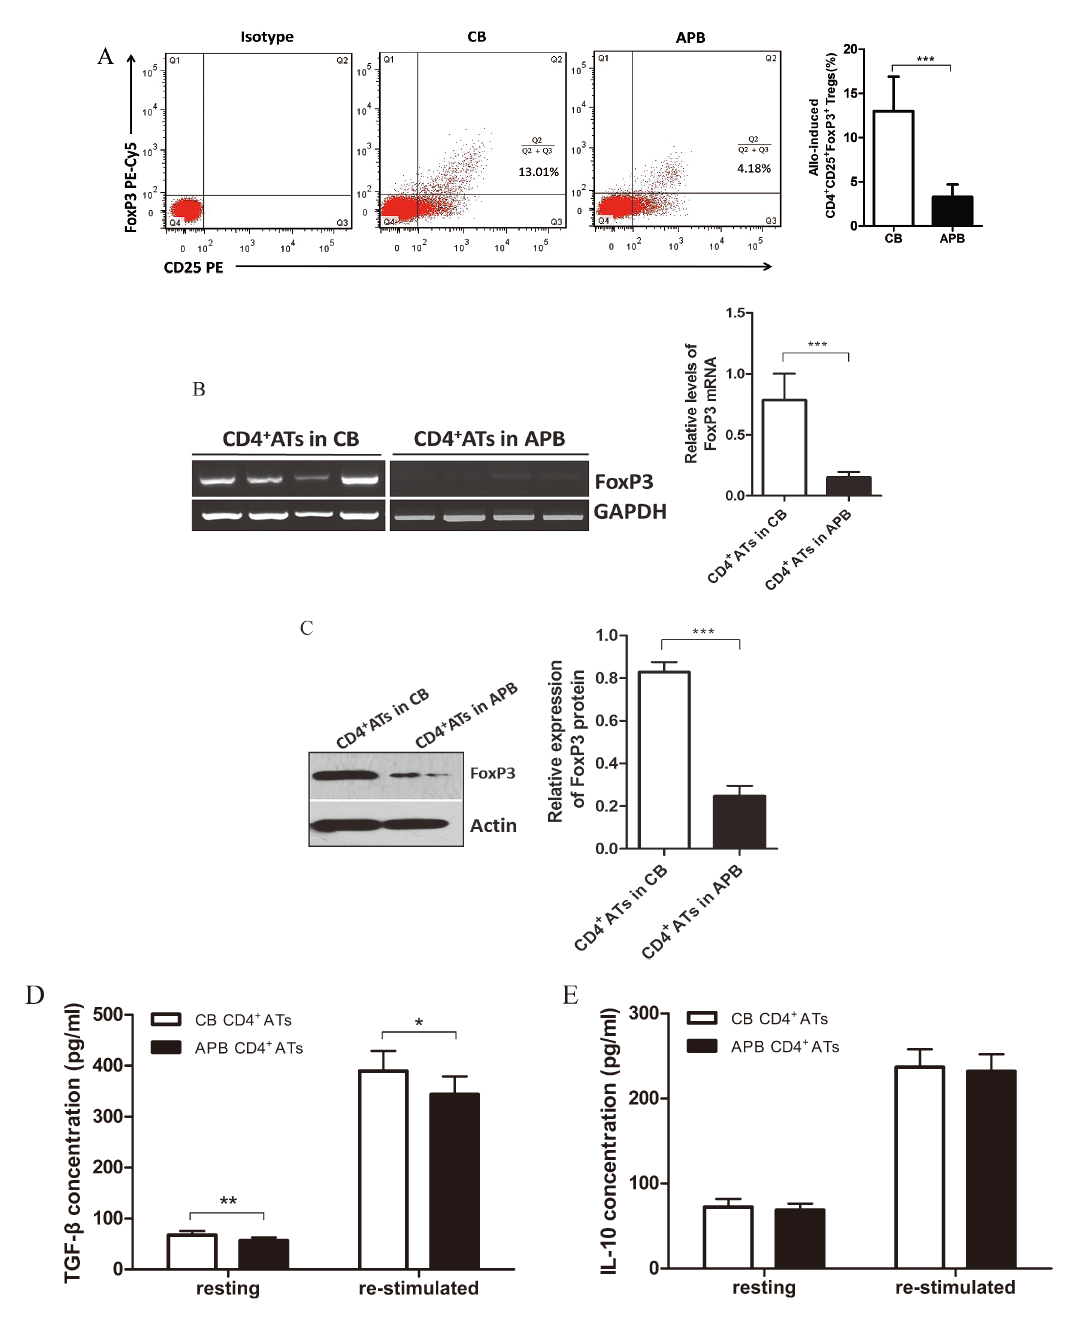
Tregs have been found to exert vital functions in restricting aGVHD by suppressing the proliferation or induce the apoptosis of Teffs (Beres and Drobyski 2013). It remains controversial whether CB contains a larger number of natural Tregs (nTregs) than APB. We thus aimed to investigate whether allo-induced regulatory T cells (allo-iTregs) are involved in CB and APB CD4+ ATs, since both effector ATs and Tregs may express membrane CD25.
As illustrated in Fig. 4A, higher percentage of FoxP3+ cells was observed in CB CD4+ CD25+ ATs after four days’ allostimulation without supplementation of exogenous inducing cytokines, whereas in APB there was much lower percentage of FoxP3+ cells (12.55% ± 2.66% vs. 3.29% ± 0.74%, P < 0.001). Expectedly, the majority of FoxP3+ cells in CB CD4+ ATs were found in the CD25high cells, which is consistent with our finding that CB CD4+ ATs had a higher intensity of CD25 expression than their APB counterparts (data not shown). Accordingly, the relative level of FoxP3 mRNA was found to be much higher in purified CB CD25+ ATs (0.78 ± 0.21 vs. 0.15 ± 0.04, P < 0.001) (Fig. 4B), which was further confirmed by a relative analysis of protein level (0.82 ± 0.04 vs. 0.24 ± 0.05, P < 0.001) (Fig. 4C).
Moreover, in other experiments, CD25+ ATs were enriched and maintained resting or re-stimulated with allogeneic stimulators for four days, and supernatant concentrations of TGF-β1 and IL-10, which are two main suppressive cytokines associated with Tregs (Vignali et al. 2008), were assayed with ELISA. CB CD4+ ATs culture supernatants had significantly higher levels of TGF-β1 than their APB counterparts both at resting (67.60 ± 8.22 vs. 56.90 ± 6.17 pg/ml, P < 0.01) and being re-stimulated (389.50 ± 39.25 vs. 343.9 ± 34.94 pg/ml, P < 0.05) (Fig. 4D), while the IL-10 concentrations were not significantly different between the two (resting: 72.40 ± 9.66 vs. 68.90 ± 7.83 pg/ml, P > 0.05; re-stimulated: 236.60 ± 21.19 vs. 231.7 ± 20.19 pg/ml, P > 0.05) (Fig. 4E).
Discussion
Previous studies have addressed the issue by comparing the cytokine production or gene expression profiles of CB and APB T cells, but unpurified CB or APB MNCs were used as responder cells or nonspecific stimulations (PHA, ConA, anti-CD3 mAb, et al.) were adopted in most of these studies (Chalmers et al. 1998; Nitsche et al. 2007; Miyagawa et al. 2009). Thus, these results merely reflected the immune characteristics of general CD4+ T cells, but not the specific CD4+ ATs. Moreover, the contaminated nonspecifically activated CD4+ CD25+ Teffs or Tregs that inherently exist in CB or APB T cells may potentially affect their response to either the polyclonal or alloantigen stimulation. Given this, purified CD4+ CD25− T cells were used as responders, and allogeneic APB MNCs other than nonspecific reagents were used as stimulators in the present study.
A previous study demonstrated that CB CD4+ T cells had a lower proliferative capability, and they may have a higher threshold for activation than adult cells (Bogunia-Kubik et al. 2000). By contrast, in our study the percentage of either CD25+ or CD69+ T cells in responder cells was comparable, indicating that CB and APB CD4+ T cells had similar capability of being activated by alloantigens. What should be noticed, not all of the CD25+ or CD69+ cells were the original CD4+ ATs, which typically take only a small proportion in total CD4+ T cells; namely, most of the detectable CD25+ or CD69+ cells were daughter generations of their precursors. Given this, we used CFSE dilution assay to track the division of CD4+ ATs initially residing in CB or APB, and with this method the frequency of ATs precursors can be estimated. Finally, we found that CB and APB had similar frequencies of CD4+ ATs precursors capable of being driven to division. Furthermore, some activated ATs did not experience proliferation, and thus the positivity of CD25 or CD69 was not able to entirely reflect their alloreactivity. We further analyzed the CFSEdim cells, which represented the proliferating ATs. However, the percentage of CFSEdim cells was not significantly different between the two compared subjects. Taken together, these findings suggest that the inconspicuous aGVHD after CBT should not be attributed to a lower number of CD4+ ATs precursors or their blunt response to alloantigens.
Most of the CD4+ T cells in CB are less mature than those in APB, which leads to distinct profiles of cytokine production; this may be caused by the differences in the activation and expression of linage-specific transcription factors (Kaminski et al. 2003; Nitsche et al. 2007; Miyagawa et al. 2009), implying that the immaturity of CB immune cells may be responsible for the reduced occurrence of aGVHD after CBT. Without finding significant difference in alloactivation and proliferation between CB and APB CD4+ ATs, we further investigated whether their cytokine-producing subsets were different in composition. Th1 and Th2 cells are typical members of Teffs, and Th1 was found to arouse GI tract injury (Burman et al. 2007), while Th2 predominantly mediated idiopathic pneumonia syndrome /GVHD in the lung (Yi et al. 2009). Varied findings were reported about the Th1 and Th2 differences in CB and APB depending on different ways of stimulation or detection methods used in individual studies (Chalmers et al. 1998; Garcia Vela et al. 2000; Krampera et al. 2000; Slavcev et al. 2002). However, we in our study compared Th1 and Th2 cells in CD4+ ATs of both origins, as well as their linage-specific transcription factors T-bet and GATA-3, showing the significantly lower percentage of both Th1 and Th2 cells in CB CD4+ ATs, with the more obvious difference in Th2. These findings in CD4+ ATs are consistent with the previous studies on total T cells, showing that Th1 were more abundant in APB than in CB (Chalmers et al. 1998; Garcia Vela et al. 2000; Krampera et al. 2000). Nevertheless, it has been more complicated with respect to Th2, which was reported to be less abundant in CB than APB in some studies (Chalmers et al. 1998; Garcia Vela et al. 2000), but similar in other reports (Krampera et al. 2000; Slavcev et al. 2002), indicating that different experimental conditions or methods may lead to disparities among studies. Conflicting results also exist regarding the role of Th17 in aGVHD, although it has been extensively addressed in autoimmune diseases and acute allograft rejection, and a supportive evidence was provided with the finding that CD4+ ATs were biased to Th17 differentiation, implying that Th17 may be the critical player of aGVHD (Litjens et al. 2009). In our study, alloreactive Th17 was detected both in CB and APB (lower frequency and expression of RORγt in CB than in APB), but the lowest among the three subsets of Teffs evaluated. Our findings suggested that the decreased frequency of cytokine-producing Teffs after alloactivation in CB CD4+ ATs may be one of the main mechanisms contributing to the low-grade severity of aGVHD associated with CBT.
Tregs have been recognized as vital protectors against aGVHD (Ganguly et al. 2014). Donor-derived Tregs can inhibit aGVHD after allogeneic bone marrow transplantation both in the animal model (Taylor et al. 2002; Hippen et al. 2011) and clinical study (Di Ianni et al. 2011). CB is an abundant source of nTregs, which have been successfully expanded in vitro and grafted to recipients to attenuate aGVHD in clinical trials (Brunstein et al. 2011). A study showed that nTregs were more enriched in CB than APB (Miyagawa et al. 2009), but this was not proved by other studies (Chen et al. 2006; Chirumbolo et al. 2011). Interestingly, we found a distinct subset of FoxP3+ Tregs in CB but not in APB CD4+ CD25+ ATs, which was also confirmed by FoxP3 mRNA and protein analysis. Apparently, Tregs we detected were not the expanded population of the original nTregs in CB, which had been depleted when preparing CD4+ CD25− responder cells; indeed, they were newly induced with alloantigens, likely to be more specific and potent for the suppression of alloreaction (Sagoo et al. 2011). These allo-induced Tregs may contribute to the lower frequency of Teffs observed in CB CD4+ ATs in this study. Of importance, these Tregs were produced without addition of any exogenous inducing cytokines, prompting us to study the cytokine milieu where ATs were present. As expected, significantly higher TGF-β1 concentrations were found in the CB CD4+ ATs cultures, which was a favoring condition for Tregs polarization (Chen et al. 2003; Fu et al. 2004). Meanwhile, TGF-β1 was also a crucial cytokine mainly secreted by Tregs to perform immunosuppression (Esquerre et al. 2008; Sojka et al. 2008); thus, a positive signaling cascade for Tregs nurturance may exist in CB CD4+ ATs. Additionally, IL-10 is another suppressive cytokine associated with Tregs’ function (Asseman et al. 1999), but the CB CD4+ ATs cultures did not show a significantly higher level of IL-10 than APB CD4+ ATs, despite that a larger number of Tregs were detected. IL-10 is also produced by several Teffs subsets (Fujio et al. 2010; Jankovic et al. 2010) which were more enriched in APB CD4+ ATs in the present study. The overwhelming production of IL-10 by Teffs in APB CD4+ ATs may account for the similar IL-10 concentration between CB and APB CD4+ ATs cultures.
In summary, we have shown similar frequency of CD4+ ATs precursors residing in CB and APB, and their accessibility of being activated by alloantigens or their proliferative capability driven by alloantigens was not significantly different. However, subset profiles of CD4+ ATs were different; the main Teffs, including Th1, Th2 and Th17 cells, were invariably less enriched in CB than in APB CD4+ ATs, and FoxP3+ Tregs, newly induced by alloantigens, were more abundant in CB CD4+ ATs, which may partially explain a lower degree of severity of aGVHD after CBT. However, it remains to be investigated whether these allo-induced FoxP3+ Tregs can maintain their regulatory phenotype and functions.
Acknowledgments
This study was partially supported by scientific research fund of Sichuan Provincial Department of Education (16ZB0224).
Conflict of Interest
The authors declare no conflict of interest.
References
-
Amrolia,
P.J.,
Muccioli-Casadei,
G.,
Yvon,
E.,
Huls,
H.,
Sili,
U.,
Wieder,
E.D.,
Bollard,
C.,
Michalek,
J.,
Ghetie,
V.,
Heslop,
H.E.,
Molldrem,
J.J.,
Rooney,
C.M.,
Schlinder,
J.,
Vitetta,
E. &
Brenner,
M.K.
(2003) Selective depletion of donor alloreactive T cells without loss of antiviral or antileukemic responses. Blood, 102, 2292-2299.
-
Asseman,
C.,
Mauze,
S.,
Leach,
M.W.,
Coffman,
R.L. &
Powrie,
F.
(1999) An essential role for interleukin 10 in the function of regulatory T cells that inhibit intestinal inflammation. J. Exp. Med., 190, 995-1004.
-
Beres,
A.J. &
Drobyski,
W.R.
(2013) The role of regulatory T cells in the biology of graft versus host disease. Front. Immunol., 4, 163.
-
Bogunia-Kubik,
K.,
Perez-Cruz,
I.,
Fallen,
P.R.,
Madrigal,
J.A. &
Cohen,
S.B.
(2000) Cord blood lymphocytes have a low frequency of cytokine producing T cells due to a high threshold for activation. Immunol. Lett., 72, 145-146.
-
Brunstein,
C.G.,
Miller,
J.S.,
Cao,
Q.,
McKenna,
D.H.,
Hippen,
K.L.,
Curtsinger,
J.,
Defor,
T.,
Levine,
B.L.,
June,
C.H.,
Rubinstein,
P.,
McGlave,
P.B.,
Blazar,
B.R. &
Wagner,
J.E.
(2011) Infusion of ex vivo expanded T regulatory cells in adults transplanted with umbilical cord blood: safety profile and detection kinetics. Blood, 117, 1061-1070.
-
Burman,
A.C.,
Banovic,
T.,
Kuns,
R.D.,
Clouston,
A.D.,
Stanley,
A.C.,
Morris,
E.S.,
Rowe,
V.,
Bofinger,
H.,
Skoczylas,
R.,
Raffelt,
N.,
Fahy,
O.,
McColl,
S.R.,
Engwerda,
C.R.,
McDonald,
K.P. &
Hill,
G.R.
(2007) IFNgamma differentially controls the development of idiopathic pneumonia syndrome and GVHD of the gastrointestinal tract. Blood, 110, 1064-1072.
-
Carlson,
M.J.,
West,
M.L.,
Coghill,
J.M.,
Panoskaltsis-Mortari,
A.,
Blazar,
B.R. &
Serody,
J.S.
(2009) In vitro-differentiated TH17 cells mediate lethal acute graft-versus-host disease with severe cutaneous and pulmonary pathologic manifestations. Blood, 113, 1365-1374.
-
Chalmers,
I.M.,
Janossy,
G.,
Contreras,
M. &
Navarrete,
C.
(1998) Intracellular cytokine profile of cord and adult blood lymphocytes. Blood, 92, 11-18.
-
Chen,
L.,
Cohen,
A.C. &
Lewis,
D.B.
(2006) Impaired allogeneic activation and T-helper 1 differentiation of human cord blood naive CD4 T cells. Biol. Blood Marrow Transplant., 12, 160-171.
-
Chen,
Z.M.,
O’Shaughnessy,
M.J.,
Gramaglia,
I.,
Panoskaltsis-Mortari,
A.,
Murphy,
W.J.,
Narula,
S.,
Roncarolo,
M.G. &
Blazar,
B.R.
(2003) IL-10 and TGF-beta induce alloreactive CD4+CD25- T cells to acquire regulatory cell function. Blood, 101, 5076-5083.
-
Chirumbolo,
S.,
Ortolani,
R.,
Veneri,
D.,
Raffaelli,
R.,
Peroni,
D.,
Pigozzi,
R.,
Colombatti,
M. &
Vella,
A.
(2011) Lymphocyte phenotypic subsets in umbilical cord blood compared to peripheral blood from related mothers. Cytometry B Clin. Cytom., 80, 248-253.
-
Chunduri,
S.,
Mahmud,
D.,
Abbasian,
J.,
Arpinati,
M. &
Rondelli,
D.
(2008) Cord blood nucleated cells induce delayed T cell alloreactivity. Biol. Blood Marrow Transplant., 14, 872-879.
-
Coghill,
J.M.,
Sarantopoulos,
S.,
Moran,
T.P.,
Murphy,
W.J.,
Blazar,
B.R. &
Serody,
J.S.
(2011) Effector CD4+ T cells, the cytokines they generate, and GVHD: something old and something new. Blood, 117, 3268-3276.
-
Di Ianni,
M.,
Falzetti,
F.,
Carotti,
A.,
Terenzi,
A.,
Castellino,
F.,
Bonifacio,
E.,
Del Papa,
B.,
Zei,
T.,
Ostini,
R.I.,
Cecchini,
D.,
Aloisi,
T.,
Perruccio,
K.,
Ruggeri,
L.,
Balucani,
C.,
Pierini,
A., et al.
(2011) Tregs prevent GVHD and promote immune reconstitution in HLA-haploidentical transplantation. Blood, 117, 3921-3928.
-
Ermann,
J.,
Hoffmann,
P.,
Edinger,
M.,
Dutt,
S.,
Blankenberg,
F.G.,
Higgins,
J.P.,
Negrin,
R.S.,
Fathman,
C.G. &
Strober,
S.
(2005) Only the CD62L+ subpopulation of CD4+CD25+ regulatory T cells protects from lethal acute GVHD. Blood, 105, 2220-2226.
-
Esquerre,
M.,
Tauzin,
B.,
Guiraud,
M.,
Muller,
S.,
Saoudi,
A. &
Valitutti,
S.
(2008) Human regulatory T cells inhibit polarization of T helper cells toward antigen-presenting cells via a TGF-beta-dependent mechanism. Proc. Natl. Acad. Sci. USA, 105, 2550-2555.
-
Fu,
S.,
Zhang,
N.,
Yopp,
A.C.,
Chen,
D.,
Mao,
M.,
Chen,
D.,
Zhang,
H.,
Ding,
Y. &
Bromberg,
J.S.
(2004) TGF-beta induces FoxP3+ T-regulatory cells from CD4+ CD25− precursors. Am. J. Transplant., 4, 1614-1627.
-
Fujio,
K.,
Okamura,
T. &
Yamamoto,
K.
(2010) The Family of IL-10-secreting CD4+ T cells. Adv. Immunol., 105, 99-130.
-
Ganguly,
S.,
Ross,
D.B.,
Panoskaltsis-Mortari,
A.,
Kanakry,
C.G.,
Blazar,
B.R.,
Levy,
R.B. &
Luznik,
L.
(2014) Donor CD4+ FoxP3+ regulatory T cells are necessary for posttransplantation cyclophosphamide-mediated protection against GVHD in mice. Blood, 124, 2131-2141.
-
Garcia Vela,
J.A.,
Delgado,
I.,
Bornstein,
R.,
Alvarez,
B.,
Auray,
M.C.,
Martin,
I.,
Ona,
F. &
Gilsanz,
F.
(2000) Comparative intracellular cytokine production by in vitro stimulated T lymphocytes from human umbilical cord blood (HUCB) and adult peripheral blood (APB). Anal. Cell. Pathol., 20, 93-98.
-
Hippen,
K.L.,
Merkel,
S.C.,
Schirm,
D.K.,
Sieben,
C.M.,
Sumstad,
D.,
Kadidlo,
D.M.,
McKenna,
D.H.,
Bromberg,
J.S.,
Levine,
B.L.,
Riley,
J.L.,
June,
C.H.,
Scheinberg,
P.,
Douek,
D.C.,
Miller,
J.S.,
Wagner,
J.E. &
Blazar,
B.R.
(2011) Massive ex vivo expansion of human natural regulatory T cells (T(regs)) with minimal loss of in vivo functional activity. Sci. Transl. Med., 3, 83ra41.
-
Jankovic,
D.,
Kugler,
D.G. &
Sher,
A.
(2010) IL-10 production by CD4+ effector T cells: a mechanism for self-regulation. Mucosal Immunol., 3, 239-246.
-
Kaminski,
B.A.,
Kadereit,
S.,
Miller,
R.E.,
Leahy,
P.,
Stein,
K.R.,
Topa,
D.A.,
Radivoyevitch,
T.,
Veigl,
M.L. &
Laughlin,
M.J.
(2003) Reduced expression of NFAT-associated genes in UCB versus adult CD4+ T lymphocytes during primary stimulation. Blood, 102, 4608-4617.
-
Krampera,
M.,
Tavecchia,
L.,
Benedetti,
F.,
Nadali,
G. &
Pizzolo,
G.
(2000) Intracellular cytokine profile of cord blood T-, and NK- cells and monocytes. Haematologica, 85, 675-679.
-
Litjens,
N.H.,
van de Wetering,
J.,
van Besouw,
N.M. &
Betjes,
M.G.
(2009) The human alloreactive CD4+ T-cell repertoire is biased to a Th17 response and the frequency is inversely related to the number of HLA class II mismatches. Blood, 114, 3947-3955.
-
Miyagawa,
Y.,
Kiyokawa,
N.,
Ochiai,
N.,
Imadome,
K.,
Horiuchi,
Y.,
Onda,
K.,
Yajima,
M.,
Nakamura,
H.,
Katagiri,
Y.U.,
Okita,
H.,
Morio,
T.,
Shimizu,
N.,
Fujimoto,
J. &
Fujiwara,
S.
(2009) Ex vivo expanded cord blood CD4 T lymphocytes exhibit a distinct expression profile of cytokine-related genes from those of peripheral blood origin. Immunology, 128, 405-419.
-
Nitsche,
A.,
Zhang,
M.,
Clauss,
T.,
Siegert,
W.,
Brune,
K. &
Pahl,
A.
(2007) Cytokine profiles of cord and adult blood leukocytes: differences in expression are due to differences in expression and activation of transcription factors. BMC Immunol., 8, 18.
-
Rocha,
V.,
Labopin,
M.,
Sanz,
G.,
Arcese,
W.,
Schwerdtfeger,
R.,
Bosi,
A.,
Jacobsen,
N.,
Ruutu,
T.,
de Lima,
M.,
Finke,
J.,
Frassoni,
F.,
Gluckman,
E.;
Acute Leukemia Working Party of European Blood; Marrow Transplant Group; Eurocord-Netcord Registry
(2004) Transplants of umbilical-cord blood or bone marrow from unrelated donors in adults with acute leukemia. N. Engl. J. Med., 351, 2276-2285.
-
Rocha,
V.,
Wagner,
J.E. Jr.,
Sobocinski,
K.A.,
Klein,
J.P.,
Zhang,
M.J.,
Horowitz,
M.M. &
Gluckman,
E.;
Eurocord and International Bone Marrow Transplant Registry Working Committee on Alternative Donor and Stem Cell Sources
(2000) Graft-versus-host disease in children who have received a cord-blood or bone marrow transplant from an HLA-identical sibling. N. Engl. J. Med., 342, 1846-1854.
-
Sagoo,
P.,
Ali,
N.,
Garg,
G.,
Nestle,
F.O.,
Lechler,
R.I. &
Lombardi,
G.
(2011) Human regulatory T cells with alloantigen specificity are more potent inhibitors of alloimmune skin graft damage than polyclonal regulatory T cells. Sci. Transl. Med., 3, 83ra42.
-
Simms,
P.E. &
Ellis,
T.M.
(1996) Utility of flow cytometric detection of CD69 expression as a rapid method for determining poly- and oligoclonal lymphocyte activation. Clin. Diagn. Lab. Immunol., 3, 301-304.
-
Slavcev,
A.,
Striz,
I.,
Ivaskova,
E. &
Breur-Vriesendorp,
B.S.
(2002) Alloresponses of cord blood cells in primary mixed lymphocyte cultures. Hum. Immunol., 63, 155-163.
-
Sojka,
D.K.,
Huang,
Y.H. &
Fowell,
D.J.
(2008) Mechanisms of regulatory T-cell suppression: a diverse arsenal for a moving target. Immunology, 124, 13-22.
-
Taylor,
P.A.,
Lees,
C.J. &
Blazar,
B.R.
(2002) The infusion of ex vivo activated and expanded CD4(+)CD25(+) immune regulatory cells inhibits graft-versus-host disease lethality. Blood, 99, 3493-3499.
-
Ueda,
Y.,
Hagihara,
M.,
Okamoto,
A.,
Higuchi,
A.,
Tanabe,
A.,
Hirabayashi,
K.,
Izumi,
S.,
Makino,
T.,
Kato,
S. &
Hotta,
T.
(2003) Frequencies of dendritic cells (myeloid DC and plasmacytoid DC) and their ratio reduced in pregnant women: comparison with umbilical cord blood and normal healthy adults. Hum. Immunol., 64, 1144-1151.
-
Vignali,
D.A.,
Collison,
L.W. &
Workman,
C.J.
(2008) How regulatory T cells work. Nat. Rev. Immunol., 8, 523-532.
-
Yi,
T.,
Chen,
Y.,
Wang,
L.,
Du,
G.,
Huang,
D.,
Zhao,
D.,
Johnston,
H.,
Young,
J.,
Todorov,
I.,
Umetsu,
D.T.,
Chen,
L.,
Iwakura,
Y.,
Kandeel,
F.,
Forman,
S. &
Zeng,
D.
(2009) Reciprocal differentiation and tissue-specific pathogenesis of Th1, Th2, and Th17 cells in graft-versus-host disease. Blood, 114, 3101-3112.