Abstract
T cells from patients with systemic lupus erythematosus (SLE) show a decreased activation threshold and increased apoptosis. These processes seem to be regulated by glycosylated molecules on the T cell surface. Here, we determined through flow cytometry the expression of mucin-type O-glycans on T helper cells in peripheral blood mononuclear cells (PBMC) from 23 SLE patients and its relation with disease activity. We used lectins specific for the disaccharide Gal-GalNAc, such as Amaranthus leucocarpus lectin (ALL), Artocarpus integrifolia lectin (jacalin) and Arachis hypogaea lectin (peanut agglutinin, PNA), as well as lectins for sialic acid such as Sambucus nigra agglutinin (SNA) and Maakia amurensis agglutinin (MAA). The results showed that ALL, but not jacalin or PNA, identified significant differences in O-glycan expression on T helper cells from active SLE patients (n = 10). Moreover, an inverse correlation was found between the frequency of T helper cells recognized by ALL and SLE Disease Activity Index (SLEDAI) score in SLE patients. In contrast, SNA and MAA lectins did not identify any differences between CD4+ T cells from SLE patients. There was no difference in the recognition by ALL on activated T helper cells and T regulatory (Treg) cells. Our findings point out that activation of SLE disease diminishes the expression of O-glycans in T helper cells; ALL could be considered as a marker to determine activity of the disease.
Introduction
Systemic lupus erythematosus (SLE) is an autoimmune rheumatic disease that presents a wide spectrum of clinical manifestations affecting multiple organs and systems (Gatto et al. 2013). The disease activity is assessed by a Systemic Lupus Erythematosus Disease Activity Index (SLEDAI) score (Bombardier et al. 1992). Although the etiology is unknown, development of SLE is associated with genetic, hormonal, environmental, and immunological factors, mainly those related to the regulation of immunological tolerance (Liu and Davidson 2012). The serum of SLE patients is characterized by the presence of antibodies, mainly IgG, directed against self-antigens, including ribonucleic acid (RNA), double-stranded deoxyribonucleic acid (dsDNA), single-stranded DNA, ribonucleoproteins like Ro, La, Sm and cytoskeletal antigens (Blanco et al. 1991, 1992; Cozzani et al. 2014). T cells from SLE patients have shown a reduced activation threshold since T cell receptor (TCR)-triggered downstream signaling rapidly increases tyrosine phosphorylation of proteins and intracellular calcium influx (Vassilopoulos et al. 1995; Liossis et al. 1998). These cells have also shown an increased susceptibility to apoptosis (Dhir et al. 2009; Shah et al. 2011), indicating that T cells from SLE patients are activated and regulated abnormally. The regulation of apoptosis seems to depend on the glycosylation pattern of cell surface glycoproteins since distinctive glycosylated structures encourage cell death induced by galectin 1, a glycan-binding protein, in Th1 cells but not in Th2 cells (Toscano et al. 2007).
O-glycosylation is a post-translational modification that begins with the addition of an N-acetyl-galactosamine (GalNAc) moiety to the hydroxyl group of specific serine or threonine residues in an acceptor protein. This biochemical reaction is catalyzed by the polypeptide N-acetyl-galactosyltransferase (ppGalNAcT) and the subsequent addition of other carbohydrates leads to the formation of different structures known as cores (Brockhausen et al. 2009). Interestingly, interaction of galectin-glycoprotein lattice with TCR modifies the T-cell activation threshold by reducing the recruitment motility of surface glycoproteins to the TCR signaling area (Grigorian et al. 2009; Antonopoulos et al. 2012).
Because SLE-patients T cells exhibit functional alterations and increased susceptibility to apoptosis, the objective of the present study was to assess if differences in the CD4+ T cell surface O-glycans could be associated with disease activity using lectins specific for Galß1,3GalNAc-1,O-Ser/Thr such as peanut agglutinin (PNA), jacalin, and Amaranthus leucocarpus lectin (ALL) (Lotan et al. 1975; Mahanta et al. 1990; Zenteno et al. 1992; Hernández et al. 2004). Results show that when compared to healthy controls, peripheral blood T cells from active SLE patients have a reduced percentage of CD4+T cells recognized by ALL (termed ALL+CD4+ T cells) in addition to a lower expression of O-glycans recognized only by ALL. Moreover, recognition of O-glycans in CD4+ T cells from SLE patients correlated inversely with disease activity determined by SLEDAI score. On the other hand, this O-glycosylation was not limited to a specific CD4+ T cell subset or correlated with apoptosis.
Materials and Methods
Patients and controls
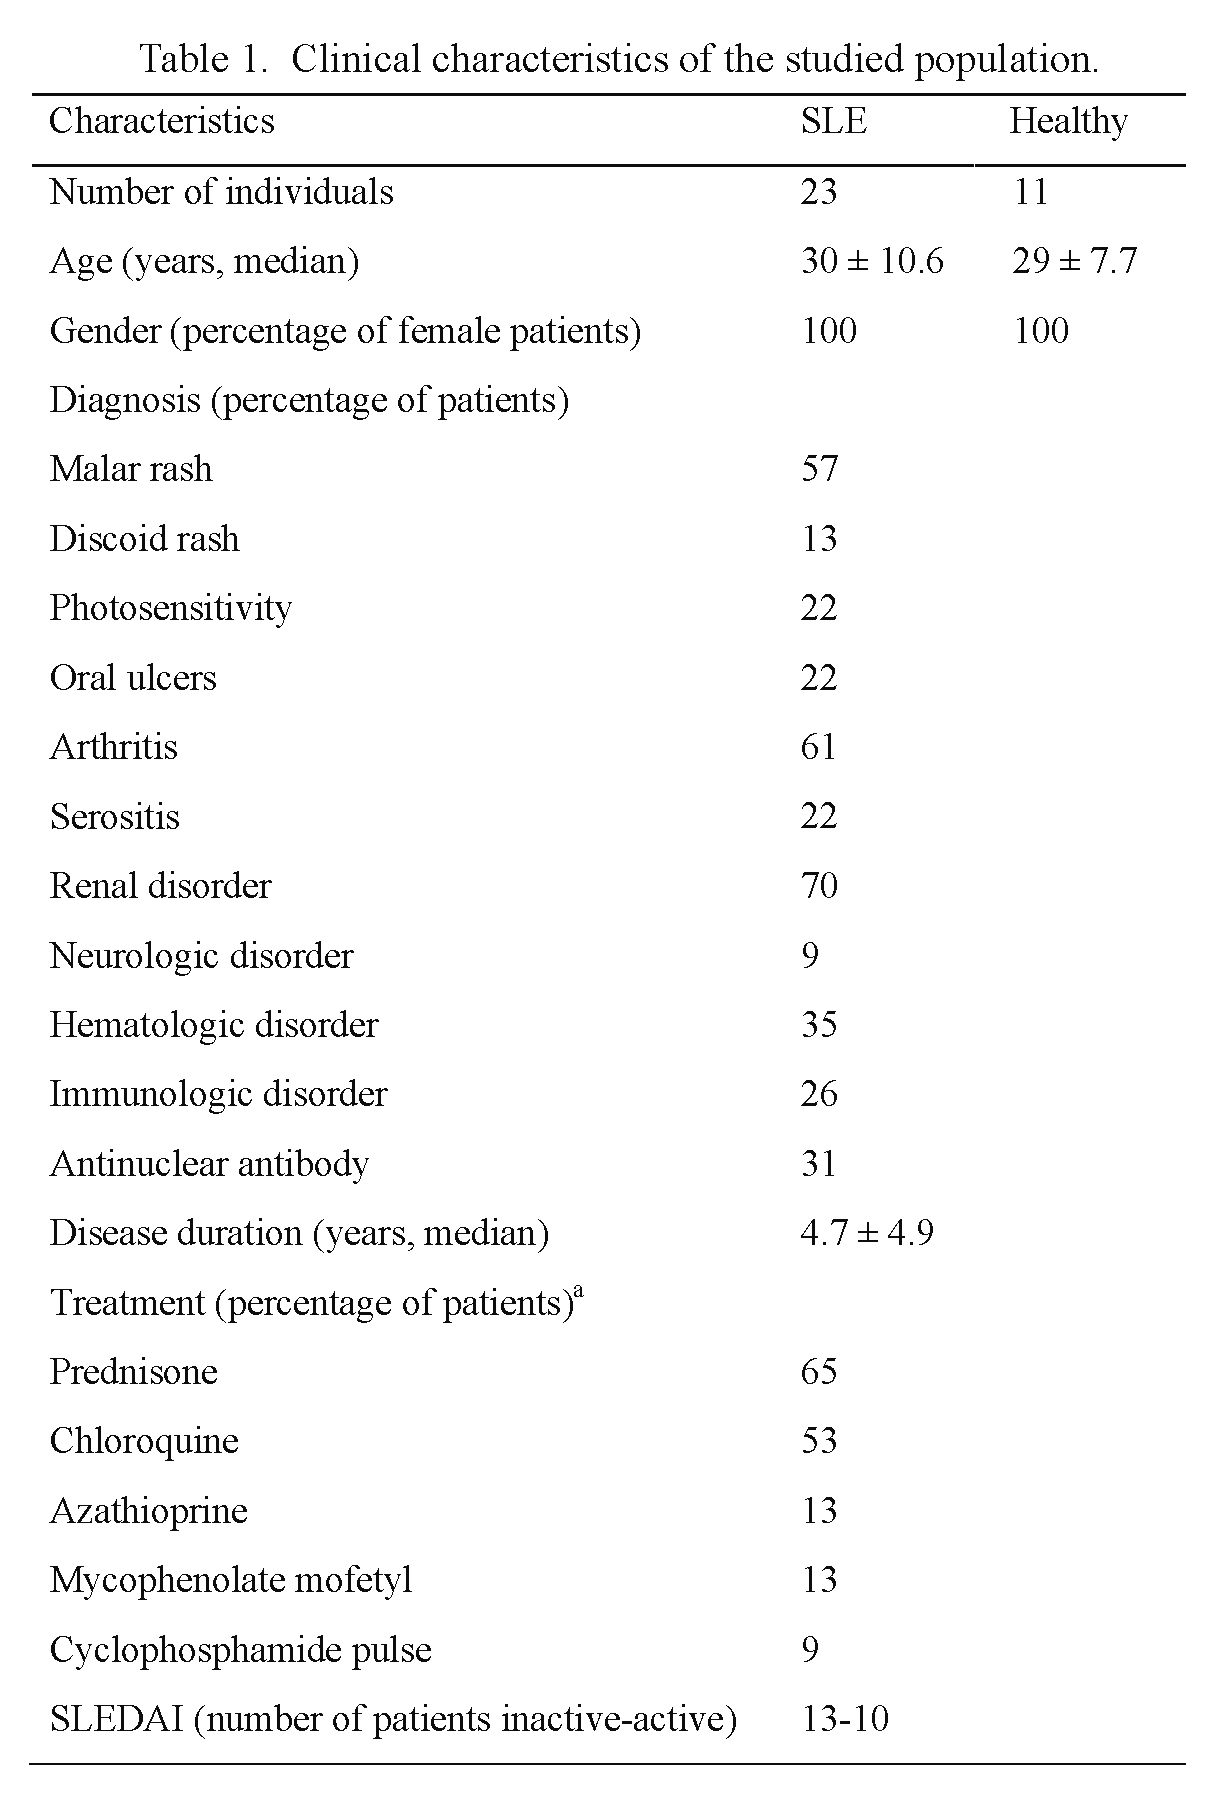
The study group included 23 female SLE patients from Centro Médico Nacional “La Raza”, a division of the Instituto Mexicano del Seguro Social in Mexico City, Mexico. SLE diagnosis was based on clinical history, physical examination, and positivity to least four of the criteria from the American College of Rheumatology (Tan et al. 1982). All 23 patients were evaluated and stratified according to disease activity by means of the SLEDAI score; ten patients were considered as active since they presented a score higher than one, the remaining 13 presented a score of zero and were thus considered as inactive. Active SLE patients were generally treated with a combination of prednisone, azathioprine or chloroquine at high doses, while inactive SLE patients were treated with low dose of prednisone or chloroquine. The healthy control group included 11 healthy blood donors from the Blood Bank, who fulfilled the established criteria for blood donation and accepted to participate in the study; they were matched by sex and age. General data from SLE patients and healthy controls are shown in Table 1. Blood samples (10 ml) were collected from each participant and routine hematological tests were carried out. The Institutional Medical Ethics Committee approved the study protocol (approval number 2009-785-028), and a written informed consent was obtained from all participants.
Fluorochrome-labeled mouse monoclonal antibodies (mAbs) to human CD4 (clone VIT4), CD8 (clone BW135/80), CD25 (clone 3G10), CD127 (clone TM), and phycoerythrin (PE)-labeled annexin V were acquired from Miltenyi Biotec (Bergisch Gladbach, Germany). Fluorochrome-labeled mAb to human CD3 (clone HIT3a) and 4´,6-diamidino-2-phenylindole, dihydrochloride (DAPI) solution were acquired from BD Biosciences Pharmingen (San Diego, CA, USA). Fluorochrome-labeled mAb to human HLA-DR (clone L243) was from BioLegend (San Diego, CA, USA). Allophycocyanin (APC)-labeled streptavidin was purchased from Vector Laboratories Inc. (Burlingame, CA, USA). Lymphoprep (Ficoll 1.077 density) was from Axis-Shield PoC As (Oslo, Norway). Bovine serum albumin fraction V (BSA), reference carbohydrates, salts and chemical reagents were acquired from Sigma-Aldrich Co. (St. Louis, MO, USA).
Lectins
Amarathus leucocarpus seeds were collected in Tulyehualco, Mexico City, and the lectin (ALL) was purified by affinity chromatography as described previously (Zenteno and Ochoa 1988). ALL purity was confirmed through observation of a single 35 kDa fraction by sodium dodecyl sulphate-polyacrylamide gel electrophoresis (SDS-PAGE) (Hernández et al. 2001) and it was then labeled with fluorescein isothiocyanate (FITC), at a label to protein ratio of 2:1 (The and Feltkamp 1970). Biotin-labeled lectins from Arachis hypogaea (peanut agglutinin, PNA), Artocarpus integrifolia (jacalin), Maackia amurensis (MAA) and Sambucus nigra (SNA) were obtained from Vector Laboratories Inc. (Burlingame, CA, USA).
Isolation of Mononuclear cells
Peripheral blood mononuclear cells (PBMCs) were isolated from 10 ml heparinized whole blood by Lymphoprep (Axis-Shield, Dundee, Scotland) density gradient, centrifuging for 30 min at 800 g and 18°C. Afterwards, the interface cells were collected and washed twice in phosphate buffered saline (PBS; 10 mM sodium phosphate, 150 mM sodium chloride, pH 7.2). Cells suspended in PBS were counted in a Neubauer chamber, cell viability was determined by Tripan blue staining and was routinely > 90%.
Immunofluorescence
PBMCs freshly obtained were stained by direct and indirect immunofluorescence, incubating with FITC-lectin or biotin-lectin followed by a second incubation with APC-streptavidin. Then, a final staining was performed with fluorescent mAbs against T helper cell phenotype molecules. Briefly, 1 × 10⁶ cells were suspended in PBS containing 1% BSA and 0.1% sodium azide (PBS-BSA buffer), and incubated with either 0.04 µg/ml FITC-labeled ALL or one of the biotinylated lectins (1.4 µg/ml PNA, 0.05 µg/ml jacalin, 0.6 µg/ml MAA, 1.2 µg/ml SNA) for 30 min at 4°C. After this, cells were washed with PBS-BSA buffer and incubated for second time with APC-streptavidin at dilution 1:400 during 30 min at 4°C. Cells were then washed and suspended with PBS-BSA buffer and incubated with fluorescent mAbs to human CD3, CD4 and CD8. After 20 min of incubation, the cells were washed and analyzed by flow cytometry. In other experiments, the phenotype of ALL+CD4+ T cells was also analyzed using fluorescent mAbs to CD25, CD127 and HLA-DR. Moreover, the carbohydrate-specificity of ALL was assessed through incubation of PBMCs with FITC-ALL in the absence or presence of 0.2 M galactose (Gal), glucose (Glc), lactose (Gal-Glc) or N-Acetyl-D-galactosamine (GalNAc) for 30 min at 4°C. For the other lectins, specificity in the cell-lectin interaction was evaluated by inhibition assays, using 0.2 M Gal for PNA and jacalin, and 0.04 mM fetuin for SNA and MAA. In each case, cells were analyzed by flow cytometry.
Apoptosis detection
PBMCs freshly obtained were washed twice in 10 mM HEPES, 140 mM NaCl and 2.5 mM CaCl2, pH 7.4 (AB, Annexin binding buffer) and incubated PE-labeled annexin V for 30 min at 4°C in the dark. Then, cells were washed twice in AB buffer and incubated with FITC-labeled ALL and mAbs to human CD3 and CD4 for 30 min at 4°C. After incubation, cells were washed and suspended in 100 µl AB buffer, and a last incubation was performed adding DAPI solution at a final concentration of 1 µg/ml 15 min before acquisition in the flow cytometer.
Flow cytometry analysis
Flow cytometry analysis was performed using a MACSQuant analyzer (Miltenyi Biotec). Singlets were selected on the basis of FSC-A and FSC-H characteristics. Then, lymphocytes were first identified by their Forward Scatter (FSC) and Side Scatter (SSC) characteristics, then the CD3+CD4+ population was subgated and 30,000 events of the later were acquired. All analyses for cell-lectin interaction were performed in the CD3+CD4+ cells gate. The ALL+ CD4+ T helper cells were also analyzed for positivity to HLA-DR, CD25, and CD127 expression. Data are showed as two-dimensional dot-plots, contour maps or histograms. Intensity of fluorescence staining is presented as mean fluorescence intensity (MFI). Fluorochrome-labeled isotype-matched control mAbs or fluorescent-second reagents were used to evaluate background staining. Data were analyzed using the FlowJo version 10 software (Tree Star, Inc, Ashland Oregon, USA). The percentage of ALL+ T helper cells was calculated using the “super-enhanced Dmax (SED) normalized subtraction” algorithm, which allows calculating the proportion of positive cells where the distribution histograms overlap (Bagwell 1996; Panoskaltsis et al. 2003).
Statistical analysis
Data were analyzed using Graphpad Prism v 5.0 software (La Jolla, CA, USA). Normality of the data was assessed with the Kolmogorov-Smirnov test followed by an analysis using the appropriate parametric or nonparametric test. For asymmetrically distributed variables, a Wilcoxon rank-sum (Mann-Whitney) test was carried out for comparisons. One-way ANOVA followed by Bonferroni multiple comparison tests were used to determine differences among groups. When appropriate, the non-parametric Kruskal-Wallis test was used. Correlations were performed using the Spearman´s rank correlation coefficient. Values are shown as mean ± standard deviation and differences among groups were considered statistically significant at P < 0.05.
Results
T helper cells from active SLE patients show decreased expression of O-glycans recognized specifically by A. leucocarpus lectin
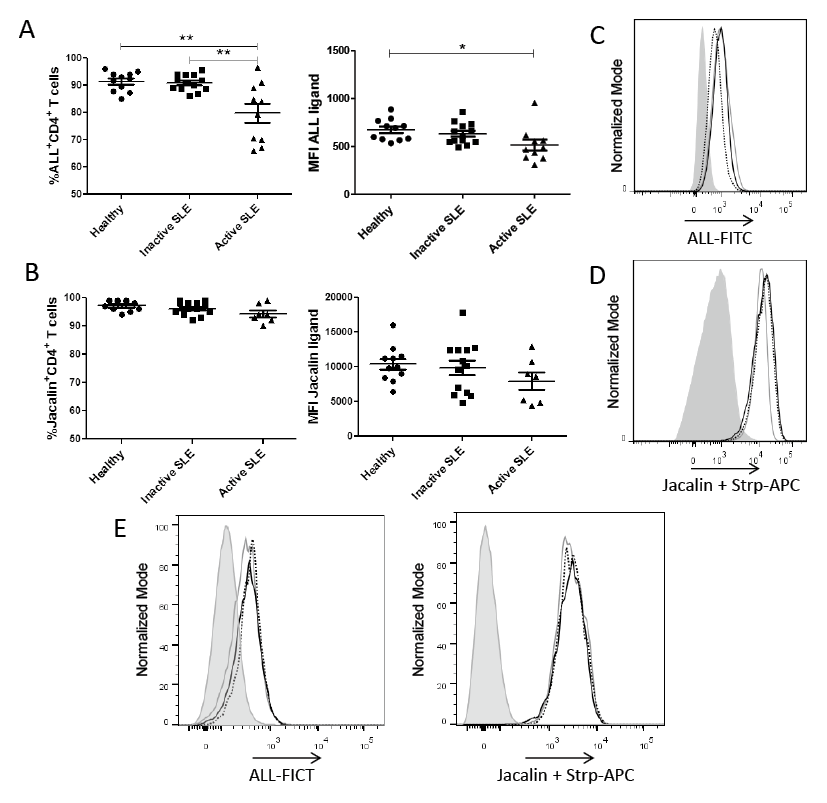
In order to confirm the specific binding of ALL on T helper cells, competitive inhibition assays were performed using the specific inhibitor carbohydrate GalNAc and the nonspecific carbohydrates Gal, Glc and lactose. GalNAc, but not Gal, Glc or lactose, inhibited ALL binding to PBMCs, indicating that this binding required a specific carbohydrate-dependent recognition (data not shown). To compare the recognition of ALL or jacalin on CD4+ T cells from inactive-, active-SLE patients, and healthy controls, cells were incubated either with ALL or jacalin, and mAbs against CD3 and CD4. As shown in Fig. 1A, the frequency of ALL+CD4+ T cells in PBMCs from active SLE patients was lower than the one from inactive SLE patients or healthy controls (80 ± 3.4% vs. 91 ± 0.81% or 91 ± 1.1%, respectively, P < 0.001). Likewise, a significant decrease in ALL-recognized O-glycans expression density was observed in T helper cells from active SLE patients only when compared to healthy controls (MFI 514 ± 57.5 vs. MFI 674 ± 33.9, respectively, P < 0.05). In contrast, there was no difference in the proportion of jacalin-positive CD4+ T cells among study groups, active SLE patients, inactive SLE patients and healthy controls (94 ± 3.2% vs. 96 ± 2.3% or 97 ± 1.7%, respectively). Similarly, there was no difference in jacalin-recognized O-glycans expression density on CD4+ T cells from any study group (Fig. 1B, D).
Some authors have reported in independent experiments that both jacalin lectin and ALL recognize core 1 in the mucin-type glycans (Mahanta et al. 1990; Hernández et al. 2004). Hence, competence assays were performed to confirm that ALL and jacalin recognize the same saccharide structure. For this, PBMCs from healthy individuals or SLE patients were first stained with ALL and then jacalin lectin or inversely and then compared to those cells stained only by one lectin. No difference was found in the O-glycans expression density recognized by ALL or jacalin lectin when cells were treated with the lectins together or separated. This suggests that these lectins do not compete to bind the same epitope (Fig. 1E).
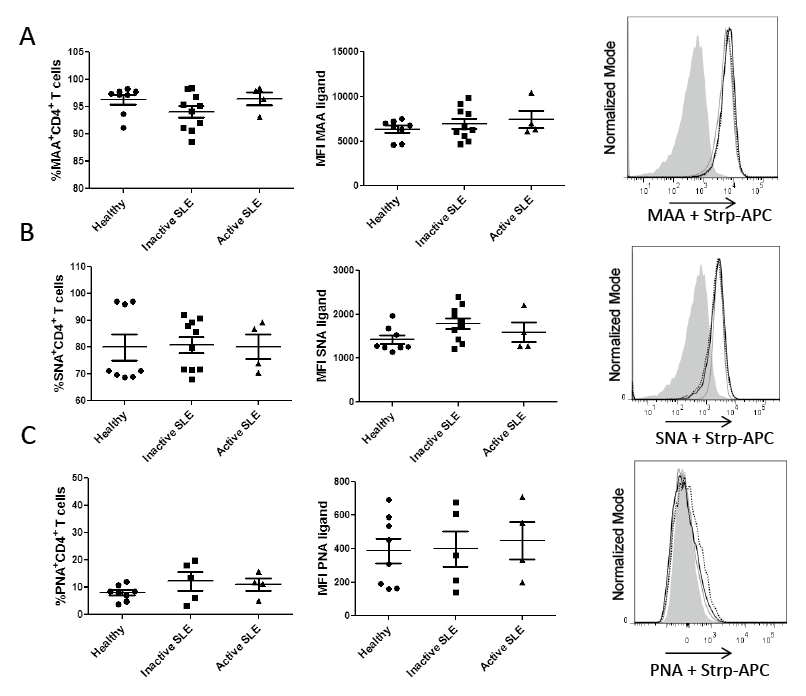
T helper cells from SLE patients do not show differences in sialic acid expression
To assess the expression of sialic acid at the α2-3 or α2-6 linkage on CD4+ T cell surface, MAA and SNA were used, respectively. No significant differences were observed among cells from study groups concerning the proportion of MAA- and SNA-positive cells or sialic acid expression density (Fig. 2A, B). The results also showed a low percentage of PNA-positive CD4+ T cells in both SLE patients and healthy controls, but no difference in frequency and expression density among groups was observed (Fig. 2C).
The frequency and expression density of ALL-recognized O-glycans on T helper cells from SLE patients correlate inversely with disease activity
Because low expression of ALL-recognized O-glycans on CD4+ T cells from active SLE patients was found, a correlation between recognition of CD4+ T cells from patients by ALL and the disease activity (SLEDAI) score was evaluated. A significant inversely proportional correlation between the percentage of ALL+ CD4+ T cells from SLE patients and the SLEDAI (r = −0.495, P = 0.0165) was observed (Fig. 3A). Similarly, ALL-recognized O-glycans expression density on CD4+ T cell surface correlated with the SLEDAI score (r = −0.450, P = 0.031), as exhibited in Fig. 3B. In contrast, no correlation was found between percentage of ALL+CD4+ T cells from SLE patients and renal failure or the disease chronic progression (data not shown).
The O-glycosylation detected by ALL is present in both activated and regulatory T helper cells from SLE patients
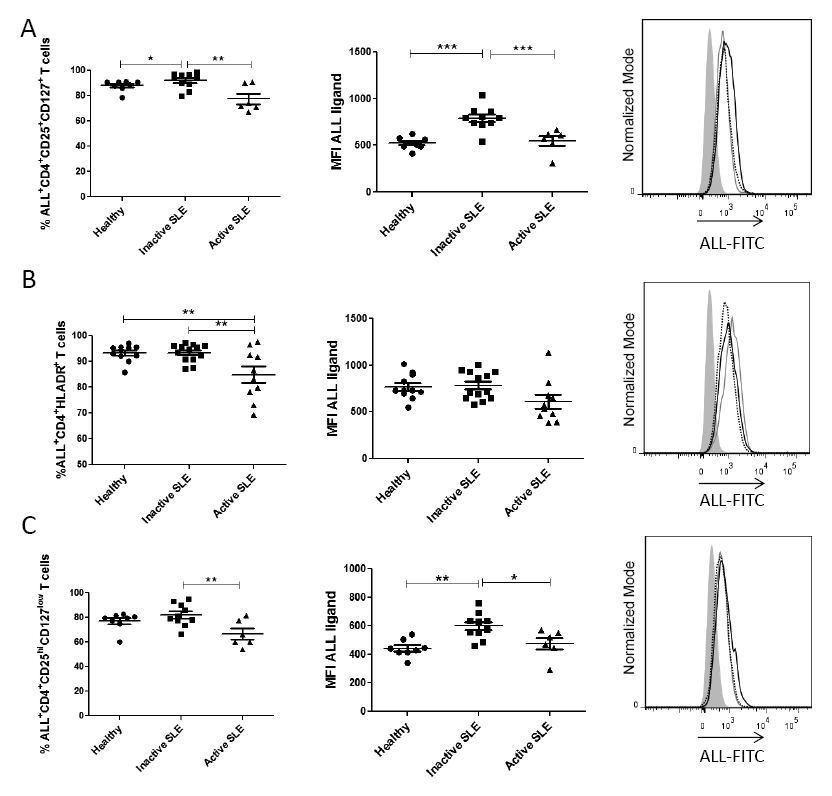
Glycosylation has been shown as an essential process involved in T cell activation (Daniels et al. 2002), and given that a decrease of ALL ligands on cells from active SLE patients was observed, an analysis of the activated-status on T helper cell subpopulations was carried out. For this, T helper cells were analyzed according to the expression of activation markers such as CD25 and CD127. The results showed that the percentage of ALL-recognized CD4+CD25+CD127+ T cells from inactive SLE patients was significantly higher (92 ± 6.3%) than those cells from active SLE patients (77 ± 10.2%) or healthy controls (88 ± 4.1%). Similar results were observed in ALL-recognized O-glycan expression, which was higher in cells from inactive SLE patients (MFI 792 ± 126.0) than in cells from active SLE patients (MFI 549 ± 126.7) or healthy controls (MFI 525 ± 65.3). In both cases there was a statistical difference of P < 0.001 (Fig. 4A).
To further confirm the diminution in ALL-ligands expression on activated CD4+ T cells from patients with active SLE, an anti-HLA-DR mAb was used to define activated T helper cells. Similarly, the proportion of ALL-recognized CD4+HLA-DR+ T cells from active SLE patients was lower than those cells from inactive SLE patients (85 ± 9.8% vs. 93 ± 3.4%, respectively, P < 0.01) or healthy controls (85 ± 9.8% vs. 93 ± 3.2%, respectively, P < 0.01). In contrast, there were no differences in ALL-recognized O-glycan expression density on HLA-DR+CD4+ T cells from healthy controls or patients, independently of their SLE status (Fig. 4B). Regarding CD4+CD25highCD127low regulatory T cells (Treg), a reduction in the frequency of ALL+ Treg cells from active SLE patients was again found in comparison with cells from inactive SLE patients (67 ± 10.8% vs. 82 ± 9.0%, respectively, P < 0.01). In the same way, CD4+CD25highCD127low T cells from active SLE patients and healthy controls showed a lower expression of ALL-ligands than cells from inactive SLE patients (MFI 476 ± 101.2 and MFI 443 ± 61.2 vs. MFI 599 ± 92.0, respectively); these differences were statistically significant (Fig. 4C).
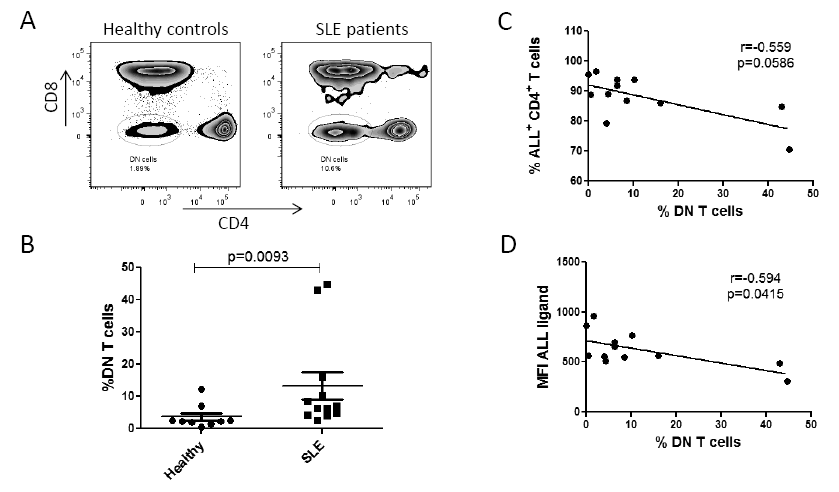
An increase in peripheral blood double-negative CD3+CD4-CD8- cell subpopulation (DN T cells) has been reported to be related to the pathogenesis of the disease (Shivakumar et al. 1989). Thus, the percentage of peripheral blood CD4-CD8- T cells between healthy controls and SLE patients was compared. As shown in Fig. 5A, SLE patients had a frequency of 13.7 ± 5.1% DN T cells, whereas in healthy controls the percentage was 3.4 ± 0.9% (P = 0.009). Likewise, an inversely proportional correlation was found between ALL-recognized O-glycan expression density and DN T cells in SLE patients (r = −0.594, P = 0.04). On the other hand, there was no correlation between the percentage of ALL+CD4+ T cells and DN T cells in patients with SLE (Fig. 5C).
Percentage of ALL-recognized T helper cells does not correlate with the percentage of apoptotic T helper cells in SLE patients
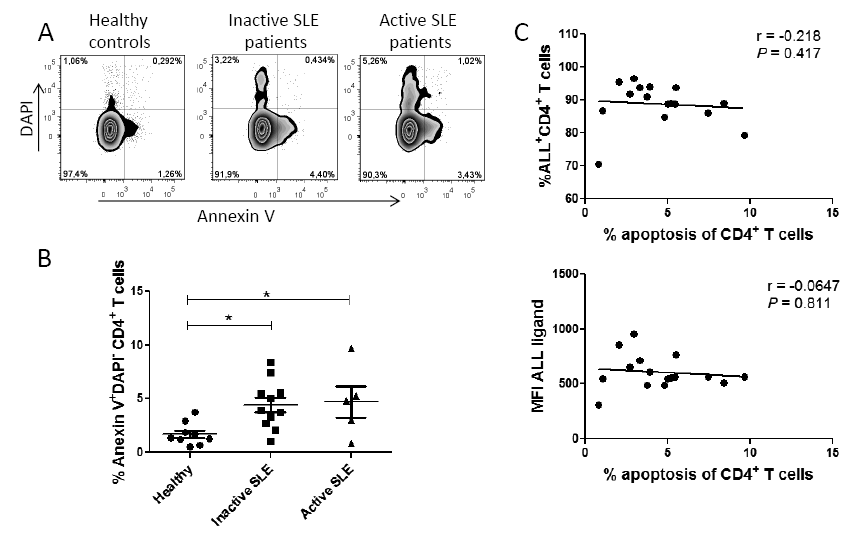
Glycosylation has been reported as an event involved in T cell apoptosis regulation (Toscano et al. 2007); therefore, viability was assessed in cells from SLE patients. The results showed a higher proportion of necrotic cells (DAPI+) from active SLE patients than from inactive SLE patients. However, no difference was found when comparing phosphatidylserine expression − an early apoptosis marker recognized by annexin V − on PBMCs from active and inactive SLE patients (Fig. 6A). In contrast, when peripheral blood CD4+ T cells were analyzed, a significantly higher frequency of apoptotic CD4+ T (Annexin V+) cells was observed in SLE patients regardless of their disease activity (Fig. 6B). On the other hand, there was no correlation between the percentage of ALL+CD4+ T cells and apoptotic CD4+ T cells in SLE patients. There was also no correlation between ALL-recognized O-glycan expression density on CD4+ T cells and the percentage of apoptotic CD4+ T cells (Fig. 6C). Likewise, no correlation was found between the percentage of apoptotic CD4+ T cells and the SLEDAI score (data not shown).
Discussion
Alterations in T cell activation and apoptosis have been described in SLE patients (Vassilopoulos et al. 1995; Liossis et al. 1998; Dhir et al. 2009; Shah et al. 2011), both of which seem to be partially regulated by O-glycosylation (Toscano et al. 2007; Grigorian et al. 2009; Antonopoulos et al. 2012). Synthesis of O-glycans starts with the covalent addition of GalNAc to serine or threonine residues, which is catalyzed by a ppGalNAcT, forming the structure known as Tn antigen (Brockhausen et al. 2009). Afterwards, the core 1 β1-3 galactosyltransferase (C1GalT1) adds Gal to Tn antigen and forms the Gal β1-3GalNAc structure known as core 1. C1GalT1 requires a specific molecular chaperone called Cosmc to perform its transferase activity. Core 1 can be a substrate of sialyltransferases, which binds sialic acid or can also be a substrate for core 2 β1-6 N-acetyl-glucosaminyl-transferase that transfers N-acetyl-glucosamine through the link β1-6 to GalNAc, giving rise to core 2 (Brockhausen et al. 2009).
We assessed the expression of core 1 structures on CD4+ T cells from SLE patients using ALL, PNA and jacalin lectins. We found alterations in the expression of O-glycans recognized by ALL but not by jacalin or PNA, in CD4+ T cells from SLE patients. Through competence assays, we showed that ALL and jacalin do not compete for the same recognition site, suggesting that both lectins identify different O-glycans. PNA lectin also binds core 1, but unlike ALL and jacalin, a low percentage of CD4+ T cells from SLE patients was recognized by PNA. The difference in recognition can be explained because these lectins, although having affinity for similar oligosaccharide, recognize different glycans.
Jacalin lectin recognizes in the core 1 the OH groups of C-2, C-3, C-4, and C-6 in the D-Gal and the acetamido group at C-2 of GalNAc (Sastry et al. 1986) while ALL specificity is directed towards the acetamido group in C-2 of GalNAc in the inner core 1-O-glycosidically linked glycans. Substitution in C-3 or C-6 of Gal/GalNAc by sialic acid did not decrease the affinity of these lectins toward Core-1 (Zenteno et al. 1992). Moreover, ALL recognizes GalNAc residues when they are spaced out in glycan structures (Hernández et al. 2004), whereas PNA shows specificity for the OH−from C-4 of Gal in Core 1. However, substitution by sialic acid inhibits the PNA binding site (Lotan et al. 1975; Pereira et al. 1976; Swamy et al. 1991).
We did not find differences in sialylation of cell surface proteins when cells were labeled by use of MAA and SNA lectins specific for α2-3 and α2-6 linkage, respectively. We did not observe changes in PNA recognition, because naïve T helper cells express core 1 with sialic acid and lose their expression only when they are activated (Clark and Baum 2012).
Similar to our findings, O-glycosylation changes have been reported in T cells from MLR-lpr mice, which develop a SLE-like disease; these lymphocytes show a low recognition by the GalNAc-specific lectin from Maclura pomífera as compared to MLR+/+ mice (Sarkar et al. 1981; Dumont and Habbersett 1982). MLR-lpr mice develop a more aggressive disease and exhibit a diminution in core 1 expression, similar to those lymphocytes from active SLE patients.
An increased expression of the Tn (GalNAcα1,O-Ser/Thr) antigen has been reported in T cells from SLE patients using the Vicia villosa lectin (Fortune and Lehner 1988; Fortune et al. 1994). An increase of Tn antigen on the T cell surface could be related to a reduced expression of the enzyme C1GalT1 or its molecular chaperone Cosmc, which has been reported to be altered by the presence of cytokines such as IL-6 and IL-4 (Suzuki et al. 2014; Yamada et al. 2010). Consistent with these reports, patients with active SLE show high levels of IL-6 (Linker-Israeli et al. 1991; Ripley et al. 2005; Umare et al. 2014) and IL-4 (Mi and Zeng 2008). Moreover, some authors have shown that IL-4 decreases the expression of C1GalT1 mRNA transcripts (Yamada et al. 2010), which could explain the alterations of core 1 expression on CD4+ T cells from active SLE patients that we described herein.
The increased percentage of DN cells in SLE patients (Anand et al. 2002; Crispín et al. 2008) has been related to the pathogenesis of disease since these cells produce inflammatory cytokines, which help B cells to produce antibodies against DNA molecules (Shivakumar et al. 1989; Rajagopalan et al. 1990; Crispín and Tsokos 2009). In agreement with these reports, we found that patients with active SLE had a higher percentage of DN T cells than healthy individuals.
Active SLE patients have shown an increased percentage of CD4+ T cells undergoing apoptosis (Dhir et al. 2009; Shah et al. 2011). Consistent with this report, we also observed an increase in the frequency of apoptotic T helper cells from SLE patients. The equilibrium in core 1 and 2 expression plays an important role in apoptosis regulation, since expression of core 2 in molecules like CD45 and CD43 favors T cell apoptosis via galectin 1 (Nguyen et al. 2001; Hernandez et al. 2006). Moreover, the increased expression of Core-1 glycans recognized by ALL seems to promote CD4+ T cell survival (Urrea et al. 2011). However, no correlation was found between ALL recognition and the presence of apoptotic CD4+ T cells from SLE patients. It remains to be determined whether ALL actually binds to viable cells, therefore a possible participation of the O-glycosidically receptors recognized by ALL to protect cells against apoptosis should not be ruled out. Our results suggest that the O-glycans recognized by ALL in CD4+ T cells could be considered as markers of disease activity in light of the correlation found between the percentage of ALL+ CD4+ T cells and MFI with SLEDAI score. Besides, these glycosylation changes do not occur in a specific CD4+ T cell subset, since they were observed in both Treg cells and activated T cells. It would be interesting to evaluate in further studies the recognition of ALL in a greater number of patients with high activity index (greater than 5), since in this study the number of patients collected with such characteristics was limited. Our results suggest that changes in O-glycosylation are related to activity of the immune system in SLE patients. However, it remains to be determined a possible correlation between ALL-ligands and other markers of the disease and whether ALL recognizes the same glycosylated proteins in SLE patients and healthy individuals.
Acknowledgments
The authors thank Armando Escárcega-Vázquez of Hospital de Especialidades, Centro Médico Nacional “La Raza”, IMSS, Mexico City, for his support in collecting samples. This article is part of the requirements for the doctoral degree of Edgar Gustavo Ramos-Martínez in the program of Doctorado en Ciencias Biomédicas, Universidad Nacional Autónoma de México, México.
Funding
This work was supported by Consejo Nacional de Ciencia y Tecnologia (CONACyT) 113815, PAPIIT-UNAM IN204315 and student scholarship 263070 from CONACyT.
Conflict of Interest
The authors declare no conflict of interest.
References
-
Anand,
A.,
Dean,
G.S.,
Quereshi,
K.,
Isenberg,
D.A. &
Lydyard,
P.M.
(2002) Characterization of CD3+ CD4- CD8- (double negative) T cells in patients with systemic lupus erythematosus: activation markers. Lupus, 11, 493-500.
-
Antonopoulos,
A.,
Demotte,
N.,
Stroobant,
V.,
Haslam,
S.M.,
van der Bruggen,
P. &
Dell,
A.
(2012) Loss of effector function of human cytolytic T lymphocytes is accompanied by major alterations in N- and O-glycosylation. J. Biol. Chem., 287, 11240-11251.
-
Bagwell,
C.B.
(1996) A journey through flow cytometric immunofluoresence analyses: Finding accurate and robust algorithms that estimate positive fraction distributions. Clin. Immunol. Newsletter, 16, 33-37.
-
Blanco,
F.,
Kalsi,
J. &
Isenberg,
D.A.
(1991) Analysis of antibodies to RNA in patients with systemic lupus erythematosus and other autoimmune rheumatic diseases. Clin. Exp. Immunol., 86, 66-70.
-
Blanco,
F.,
Kalsi,
J.,
Ravirajan,
C.T.,
Speight,
P.,
Bradwell,
A.R. &
Isenberg,
D.A.
(1992) IgG subclasses in systemic lupus erythematosus and other autoimmune rheumatic diseases. Lupus, 1, 391-399.
-
Bombardier,
C.,
Gladman,
D.D.,
Urowitz,
M.B.,
Caron,
D. &
Chang,
D.H.
(1992) Committee on Prognosis Studies in SLE Derivation of the SLEDAI: a disease activity index for lupus patients. Arthritis Rheum., 35, 630-640.
-
Brockhausen,
I.,
Schachter,
H. &
Stanley,
P.
(2009) O-GalNAc Glycans. In Essentials of Glycobiology, 2nd ed., edited by
Varki,
A.,
Cummings,
R.D.,
Esko,
J.D.,
Freeze,
H.H.,
Stanley,
P.,
Bertozzi,
C.R.,
Hart,
G.W. &
Etzler,
M.E.
Cold Spring Harbor Laboratory Press, New York, pp. 115-126.
-
Clark,
M.C. &
Baum,
L.G.
(2012) T cells modulate glycans on CD43 and CD45 during development and activation, signal regulation, and survival. Ann. NY Acad. Sci., 1253, 58-67.
-
Cozzani,
E.,
Drosera,
M.,
Gasparini,
G. &
Parodi,
A.
(2014) Serology of lupus erythematosus: correlation between immunopathological features and clinical aspects. Autoimmun. Dis., 2014, 321359.
-
Crispín,
J.C.,
Oukka,
M.,
Bayliss,
G.,
Cohen,
R.A.,
Van Beek,
C.A.,
Stillman,
I.E.,
Kyttaris,
V.C.,
Juang,
Y.T. &
Tsokos,
G.C.
(2008) Expanded double negative T cells in patients with systemic lupus erythematosus produce IL-17 and infiltrate the kidneys. J. Immunol., 181, 8761-8766.
-
Crispín,
J.C. &
Tsokos,
G.C.
(2009) Human TCR-alpha beta+ CD4- CD8- T cells can derive from CD8+ T cells and display an inflammatory effector phenotype. J. Immunol., 183, 4675-4681.
-
Daniels,
M.A.,
Hogquist,
K.A. &
Jameson,
S.C.
(2002) Sweat ʻs’ sour: the impact of differential glycosylation on T cell responses. Nat. Immunol., 3, 903-910.
-
Dhir,
V.,
Singh,
A.P.,
Aggarwal,
A.,
Naik,
S. &
Misra,
R.
(2009) Increased T-lymphocyte apoptosis in lupus correlates with disease activity and may be responsible for reduced T-cell frequency: a cross-sectional and longitudinal study. Lupus, 18, 785-791.
-
Dumont,
F. &
Habbersett,
R.G.
(1982) Unusual cell surface properties of the T lymphocyte population expanding in MRL/Mp-lpr/lpr mice. Immunol., 47, 271-281.
-
Fortune,
F. &
Lehner,
T.
(1988) Phenotypic expression of Vicia villosa binding T cell subsets, as markers of contrasuppressor cells in systemic lupus erythematosus. Clin. Exp. Immunol., 74, 100-104.
-
Fortune,
F.,
Walker,
J.,
Lefrancois,
M. &
Lehner,
T.
(1994) The expression of carbohydrate antigens in activated T cells and in autoimmune diseases. Scand. J. Immunol., 40, 636-642.
-
Gatto,
M.,
Zen,
M.,
Ghirardello,
A.,
Bettio,
S.,
Bassi,
N.,
Iaccarino,
L.,
Punzi,
L. &
Doria,
A.
(2013) Emerging and critical issues in the pathogenesis of lupus. Autoimmun. Rev., 12, 523-536.
-
Grigorian,
A.,
Torossian,
S. &
Demetriou,
M.
(2009) T-cell growth, cell surface organization, and the galectin-glycoprotein lattice. Immunol. Rev., 230, 232-246.
-
Hernandez,
J.D.,
Nguyen,
J.T.,
He,
J.,
Wang,
W.,
Ardman,
B.,
Green,
J.M.,
Fukuda,
M. &
Baum,
L.G.
(2006) Galectin-1 binds different CD43 glycoforms to cluster CD43 and regulate T cell death. J. Immunol., 177, 5328-5336.
-
Hernández,
P.,
Debray,
H.,
Jaekel,
H.,
Garfias,
Y.,
Jiménez,
Md. Mdel. C.,
Martínez-Cairo,
S. &
Zenteno,
E.
(2001) Chemical characterization of the lectin from Amaranthus leucocarpus syn. hypocondriacus by 2-D proteome analysis. Glycoconj. J., 18, 321-329.
-
Hernández,
P.,
Tetaert,
D.,
Vergoten,
G.,
Debray,
H.,
del Carmen Jimenez,
M.,
Fernández,
G.,
Agundis,
C.,
Degand,
P. &
Zenteno,
E.
(2004) Specificity of Amaranthus leucocarpus syn. hypocondriacus lectin for O-glycopeptides. Biochim. Biophys. Acta, 1674, 282-290.
-
Linker-Israeli,
M.,
Deans,
R.J.,
Wallace,
D.J.,
Prehn,
J.,
Ozeri-Chen,
T. &
Klinenberg,
J.R.
(1991) Elevated levels of endogenous IL-6 in systemic lupus erythematosus. A putative role in pathogenesis. J. Immunol., 147, 117-123.
-
Liossis,
S.N.,
Ding,
X.Z.,
Dennis,
G.J. &
Tsokos,
G.C.
(1998) Altered pattern of TCR/CD3-mediated protein-tyrosyl phosphorylation in T cells from patients with systemic lupus erythematosus. Deficient expression of the T cell receptor zeta chain. J. Clin. Invest., 101, 1448-1457.
-
Liu,
Z. &
Davidson,
A.
(2012) Taming lupus-a new understanding of pathogenesis is leading to clinical advances. Nat. Med., 18, 871-882.
-
Lotan,
R.,
Skutelsky,
E.,
Danon,
D. &
Sharon,
N.
(1975) The purification, composition, and specificity of the anti-T lectin from peanut (Arachis hypogaea). J. Biol. Chem., 250, 8518-8523.
-
Mahanta,
S.K.,
Sastry,
M.V. &
Surolia,
A.
(1990) Topography of the combining region of a Thomsen-Friedenreich-antigen-specific lectin jacalin (Artocarpus integrifolia agglutinin). A thermodynamic and circular-dichroism spectroscopic study. Biochem. J., 265, 831-840.
-
Mi,
X.B. &
Zeng,
F.Q.
(2008) Hypomethylation of interleukin-4 and -6 promoters in T cells from systemic lupus erythematosus patients. Acta Pharmacol. Sin., 29, 105-112.
-
Nguyen,
J.T.,
Evans,
D.P.,
Galvan,
M.,
Pace,
K.E.,
Leitenberg,
D.,
Bui,
T.N. &
Baum,
L.G.
(2001) CD45 modulates galectin-1-induced T cell death: regulation by expression of core 2 O-glycans. J. Immunol., 167, 5697-5707.
-
Panoskaltsis,
N.,
Reid,
C.D. &
Knight,
S.C.
(2003) Quantification and cytokine production of circulating lymphoid and myeloid cells in acute myelogenous leukaemia. Leukemia, 17, 716-730.
-
Pereira,
M.E.,
Kabat,
E.A.,
Lotan,
R. &
Sharon,
N.
(1976) Immunochemical studies on the specificity of the peanut (Arachis hypogaea) agglutinin. Carbohydr. Res., 51, 107-118.
-
Rajagopalan,
S.,
Zordan,
T.,
Tsokos,
G.C. &
Datta,
S.K.
(1990) Pathogenic anti-DNA autoantibody-inducing T helper cell lines from patients with active lupus nephritis: isolation of CD4-8- T helper cell lines that express the gamma delta T-cell antigen receptor. Proc. Natl. Acad. Sci. USA, 87, 7020-7024.
-
Ripley,
B.J.,
Goncalves,
B.,
Isenberg,
D.A.,
Latchman,
D.S. &
Rahman,
A.
(2005) Raised levels of interleukin 6 in systemic lupus erythematosus correlate with anaemia. Ann. Rheum. Dis., 64, 849-853.
-
Sarkar,
M.,
Wu,
A.M. &
Kabat,
E.A.
(1981) Immunochemical studies on the carbohydrate specificity of Maclura pomifera lectin. Arch. Biochem. Biophys., 209, 204-218.
-
Sastry,
M.V.,
Banarjee,
P.,
Patanjali,
S.R.,
Swamy,
M.J.,
Swarnalatha,
G.V. &
Surolia,
A.
(1986) Analysis of saccharide binding to Artocarpus integrifolia lectin reveals specific recognition of T-antigen (beta-D-Gal(1----3)D-GalNAc). J. Biol. Chem., 261, 11726-11733.
-
Shah,
D.,
Aggarwal,
A.,
Bhatnagar,
A.,
Kiran,
R. &
Wanchu,
A.
(2011) Association between T lymphocyte sub-sets apoptosis and peripheral blood mononuclear cells oxidative stress in systemic lupus erythematosus. Free Radic. Res., 45, 559-567.
-
Shivakumar,
S.,
Tsokos,
G.C. &
Datta,
S.K.
(1989) T cell receptor alpha/beta expressing double-negative (CD4-/CD8-) and CD4+ T helper cells in humans augment the production of pathogenic anti-DNA autoantibodies associated with lupus nephritis. J. Immunol., 143, 103-112.
-
Suzuki,
H.,
Raska,
M.,
Yamada,
K.,
Moldoveanu,
Z.,
Julian,
B.A.,
Wyatt,
R.J.,
Tomino,
Y.,
Gharavi,
A.G. &
Novak,
J.
(2014) Cytokines alter IgA1 O-glycosylation by dysregulating C1GalT1 and ST6GalNAc-II enzymes. J. Biol. Chem., 289, 5330-5339.
-
Swamy,
M.J.,
Gupta,
D.,
Mahanta,
S.K. &
Surolia,
A.
(1991) Further characterization of the saccharide specificity of peanut (Arachis hypogaea) agglutinin. Carbohydr. Res., 213, 59-67.
-
Tan,
E.M.,
Cohen,
A.S, Fries, J.F.,
Masi,
A.T.,
McShane,
D.J.,
Rothfield,
N.F.,
Schaller,
J.G.,
Talal,
N. &
Winchester,
R.J.
(1982) The 1982 revised criteria for the classification of systemic lupus erythematosus. Arthritis Rheum., 25, 1271-1277.
-
The,
T.H. &
Feltkamp,
T.E.W.
(1970) Conjugation of fluorescein isothiocyanate to antibodies. I. Experiments on the conditions of conjugation. Immunology, 18, 865-873.
-
Toscano,
M.A.,
Bianco,
G.A.,
Ilarregui,
J.M.,
Croci,
D.O.,
Correale,
J.,
Hernandez,
J.D.,
Zwirnerf,
N.W.,
Poirier,
F.,
Riley,
E.M.,
Baum,
L.G. &
Rabinovich,
G.A.
(2007) Differential glycosylation of TH1, TH2 and TH-17 effector cells selectively regulates susceptibility to cell death. Nat. Immunol., 8, 825-834.
-
Umare,
V.,
Pradhan,
V.,
Nadkar,
M.,
Rajadhyaksha,
A.,
Patwardhan,
M.,
Ghosh,
K.K. &
Nadkarni,
A.H.
(2014) Effect of Proinflammatory Cytokines (IL-6, TNF-α, and IL-1 β) on Clinical Manifestations in Indian SLE Patients. Mediators Inflamm., 2014, 385297.
-
Urrea,
F.,
Zenteno,
E.,
Avila-Moreno,
F.,
Sanchez-Garcia,
F.J.,
Zuñiga,
J.,
Lascurain,
R. &
Ortiz-Quintero,
B.
(2011) Amaranthus leucocarpus lectin (ALL) enhances anti-CD3-dependent activation of murine T cells and promotes cell survival. Immunol. Invest., 40, 113-129.
-
Vassilopoulos,
D.,
Kovacs,
B. &
Tsokos,
G.C.
(1995) TCR/CD3 complex-mediated signal transduction pathway in T cells and T cell lines from patients with systemic lupus erythematosus. J. Immunol., 155, 2269-2281.
-
Yamada,
K.,
Kobayashi,
N.,
Ikeda,
T.,
Suzuki,
Y.,
Tsuge,
T.,
Horikoshi,
S.,
Emancipator,
S.N. &
Tomino,
Y.
(2010) Down-regulation of core 1 beta1,3-galactosyltransferase and Cosmc by Th2 cytokine alters O-glycosylation of IgA1. Nephrol. Dial. Transplant., 25, 3890-3897.
-
Zenteno,
E.,
Lascurain,
R.,
Montaño,
L.F.,
Vazquez,
L.,
Debray,
H. &
Montreuil,
J.
(1992) Specificity of Amaranthus leucocarpus lectin. Glycoconj. J., 9, 204-208.
-
Zenteno,
E. &
Ochoa,
J.L.
(1988) Purification of a lectin from Amaranthus leucocarpus by affinity chromatography. Phytochem., 27, 313-317.