Abstract
A high glycemic status increases the risk for autonomic dysfunction and cardiovascular failure. The aim of this study was to investigate time-dependent changes in the autonomic response and cardiovascular dynamics and the association between the level of hemoglobin A1c (HbA1c) and autonomic response during blood volume reduction. The study population consisted of 26 preoperative participants who were scheduled for autologous blood donation (200-400 mL of whole blood) for intraoperative or postoperative use. These participants without circulatory, respiratory, or brain disease and diabetes mellitus were grouped according to their HbA1c levels: < 6.5% (n = 18) and ≥ 6.5% (n = 8). We measured blood pressure (BP) and analyzed heart rate variability (HRV) to quantify cardiac autonomic regulation throughout blood donation. During blood volume reduction, which was about 10% of the circulating blood volume, the BP and heart rate varied within normal ranges in both groups. The high-frequency (HF) component, an index of parasympathetic nerve activity, and the ratio of low-frequency (LF) to HF components (LF/HF), an index of sympathetic nerve activity, significantly decreased and increased with the progression of blood volume reduction, respectively, in the HbA1c < 6.5% group. In contrast, in the HbA1c ≥ 6.5% group, the HF component did not significantly change, and the increase in the LF/HF ratio was delayed. Time-dependent changes in HRV were related to blood volume reduction only in the HbA1c < 6.5% group. Thus, elevated HbA1c levels are associated with the decrease in the autonomic response induced by blood volume reduction.
Introduction
The autonomic nervous system plays an important role in most initial compensatory mechanisms in cardiovascular regulation (Schadt and Ludbrook 1991). A high glycemic status leads to nerve injury through an increased flux of the polyol pathway, accumulation of advanced glycation end products, excessive release of cytokines, activation of protein kinase C, and increased oxidative stress (Yagihashi et al. 2011), and it is the cause of impaired autonomic regulation. Compared to patients without diabetes mellitus, those with diabetes mellitus as an underlying disease develop cardiovascular failure more often, including severe hypotension and tachycardia, when challenged by changes in circulating blood volume during emergency and critical situations. Hemodynamic change occur more in patients with diabetes mellitus with autonomic dysfunction during anesthesia and surgery (Knüttgen et al. 1990), and intraoperative vasopressor support is needed more often in these patients (Burgos et al. 1989). The prevalence of orthostatic hypotension, which is caused by autonomic dysfunction in response to decreasing venous return by postural change, increases with the progression of diabetes mellitus (Wu et al. 2009). Hemodynamic change is a main factor affecting cardiovascular dynamics, management of this factor is a challenge associated with patients’ prognosis. It is clinically important to assess cardiac autonomic regulation as an initial compensatory mechanism for detecting changes in patients’ conditions at an early stage before circulatory failure. However, time-dependent changes that occur in the autonomic nervous system and the association with the glycemic status and autonomic response during hemodynamic change are unclear. Identifying changes in the autonomic response in patients during hemodynamic change may provide additional insights into cardiovascular failure and be instrumental for risk avoidance and therapeutic management at an early stage.
To assess the autonomic response to circulating blood volume reduction at an early stage, we chose the setting of autologous blood donation, which is a controlled non-traumatic mild hemorrhage. The amount of blood loss is small; however, it is sufficient for decreasing the circulating blood volume. This is supported by a decrease in the inferior vena cava diameter (Lyon et al. 2005) and stroke index (Kosowsky et al. 2002), and a compensatory increase in muscle sympathetic nerve activity (Rea et al. 1991) and plasma norepinephrine levels (Haberthür et al. 2003). Furthermore, we evaluated the autonomic response by analyzing periodic fluctuations in heart rate, i.e., heart rate variability (HRV), which is a noninvasive and commonly used tool to assess the function of the cardiac autonomic nervous system modulated by sympathetic and parasympathetic activities (Task Force of the European Society of Cardiology the North American Society of Pacing Electrophysiology 1996). Some studies on patients with diabetes mellitus have shown that assessing HRV is useful, as it is a sensitive indicator of cardiac autonomic neuropathy detectable during the subclinical stage (Laederch-Hofmann et al. 1999; Pop-Busui 2010). Moreover, for early intervention, we focused on the glycemic status assessed by hemoglobin A1c (HbA1c), which represents endogenous glucose levels over the previous 2-3 months of glycemic control (Goldstein et al. 2004), rather than previously diagnosed diabetes mellitus.
The aims of this study were to 1) investigate time-dependent changes in the autonomic response measured by HRV and cardiovascular dynamics; and 2) evaluate the association between the glycemic status, as assessed by HbA1c, and the autonomic response during autologous blood donation as a model of circulating blood volume reduction.
Materials and Methods
Study subjects
The study population consisted of twenty-six preoperative participants who were scheduled for autologous blood donation (200-400 mL of whole blood) for intraoperative or postoperative use. None of the participants had a medical history of circulatory, respiratory, or brain disease, or was treated with β-blockers which affect autonomic nervous system (Task Force of the European Society of Cardiology the North American Society of Pacing Electrophysiology 1996). According to the results of the preoperative test, no participants met the diagnostic criteria for diabetes mellitus or had clinical signs of diabetes, including peripheral neuropathy. According to the Japanese Society of Autologous Blood Transfusion, the criteria for autologous blood donation enforcement excludes those with a hemoglobin level < 11.0 g/dL, frequent arrhythmia, bacterial infection, unstable angina, moderate or severe aortic stenosis (a pressure gradient between the left ventricle and aorta ≥ 50 mmHg or the requirement of surgical treatment), New York Heart Association grade IV, and fever (an increase in body temperature ≥ 1°C from normal or ≥ 37.2°C) (Japanese Society of Autologous Blood Transfusion 2014). All participants were divided into two groups according to their HbA1c level, as defined by the National Glycohemoglobin Standardization Program (Little 2003; Little et al. 2011): HbA1c < 6.5% and HbA1c ≥ 6.5%. The level of HbA1c ≥ 6.5% supports a threshold level of glycemic status that results in an increased risk for microvascular complications such as retinopathy, and it is a clinically important cutoff point for glycemic control (The International Expert Committee 2009; Seino et al. 2010).
This study was approved by the ethics committee of the Tohoku University Graduate School of Medicine, and written informed consent was obtained from all participants before study participation.
Study protocol
This study was conducted in the blood collection room of the Tohoku University Hospital. After a 5-minute rest for stabilization, cannulation of the antecubital vein was performed using a 17- to 18-gauge intravenous catheter (Terumo Co., Tokyo, Japan), and blood was collected using a blood collection system (HEMO-QUICK AC-185, Terumo Co., Tokyo, Japan). After blood withdrawal, we removed the intravenous catheter promptly, and then the participants rested for 5 minutes. Data from lead II of the electrocardiograms (ECGs) were acquired from participants, who rested comfortably in the supine position on a bed throughout the autologous blood donation process, including resting in the anteroposterior position for 5 minutes. Systolic blood pressure (SBP) and diastolic blood pressure (DBP) were measured in the upper arm without cannulation using a digital sphygmomanometer (H55, Terumo Co., Tokyo, Japan). The autologous blood donation process was divided into five stages: pre-blood donation, 5 minutes of rest before blood withdrawal; forward blood donation, the mid-point of blood donation; later blood donation; and post-blood donation, 5 minutes of rest after blood withdrawal. The study flowchart is depicted in Fig. 1.

The signals from the ECG monitor passed through an analog-to-digital converter at a sampling frequency of 1,000 Hz and were stored continuously on a personal computer for analysis. Frequency domain methods of HRV can be used with even shorter intervals (2-5 minutes) without missing relevant information on HRV (Task Force of the European Society of Cardiology the North American Society of Pacing Electrophysiology 1996; Xhyheri et al. 2012). Spectral analysis was conducted offline by continuous wavelet transformation by using Fluclet™ (DaiNippon Sumitomo Pharmaceutical Co., Ltd., Osaka, Japan). The total power of spectra was defined within the range of 0-0.40 Hz, and low-frequency (LF) and high-frequency (HF) components were obtained as the area under the power spectral curve for the LF bands (0.04-0.15 Hz) and HF bands (0.15-0.40 Hz), respectively. Generally, the HF component represents parasympathetic nerve activity at the sinus node, whereas the LF component reflects both the sympathetic and parasympathetic modulation of heart rate (HR) (Pomeranz et al. 1985; Task Force of the European Society of Cardiology the North American Society of Pacing Electrophysiology 1996). To estimate the cardiac autonomic regulation, we evaluated the HF component as an index of cardiac vagal neuronal activity and the ratio of the LF to HF components (LF/HF) as an index of sympathetic neuronal activity (Pagani et al. 1986).
Anthropometric measurements and laboratory data
The anthropometric measurements were obtained from participants’ medical records. The body mass index (BMI) was calculated by dividing body weight by height squared (kg/m2). The body surface area (BSA) was calculated using Du Bois’s equation as 71.84 H0.725 W0.425, where H and W indicate participants’ height (cm) and weight (kg), respectively (Du Bois and Du Bois 1916). Blood samples were collected after an overnight fasting. The levels of HbA1c, fasting blood glucose, hemoglobin, hematocrit, total cholesterol, triglyceride, low-density lipoprotein cholesterol, and high-density lipoprotein cholesterol were measured by routine methods.
Estimating the circulating blood volume
The baseline circulating blood volume of each participant before blood withdrawal was calculated by Ogawa’s equation as 0.168 H3 + 0.050 W + 0.444 for men and 0.2502 H3 + 0.0625 W − 0.662 for women, where H and W indicate participant height (m) and weight (kg), respectively (Ogawa et al. 1970).
Statistical analysis
The HR, SBP, DBP, HF component, and LF/HF ratio at each stage for all participants during autologous blood donation were obtained by averaging the values for that stage, which are presented as the mean ± standard error of the mean. The Mann-Whitney U test and Chi-square test were used to compare the anthropometric measurements, laboratory data, medical conditions, and physiological variables for the HbA1c ≥ 6.5% and HbA1c < 6.5% groups at each blood donation stage. Friedman’s analysis of variance test for repeated measures and the multi-comparison Bonferroni test were used to compare each physiological variable and its gradient during stages four and five. A partial correlation analysis was conducted to examine the association between the HbA1c level and time-dependent changes in HRV.
Data were statistically analyzed by using SPSS statistical package (version 21.0, SPSS Inc., Chicago, IL, USA). P-values < 0.05 were considered statistically significant.
Results
Participants’ clinical characteristics
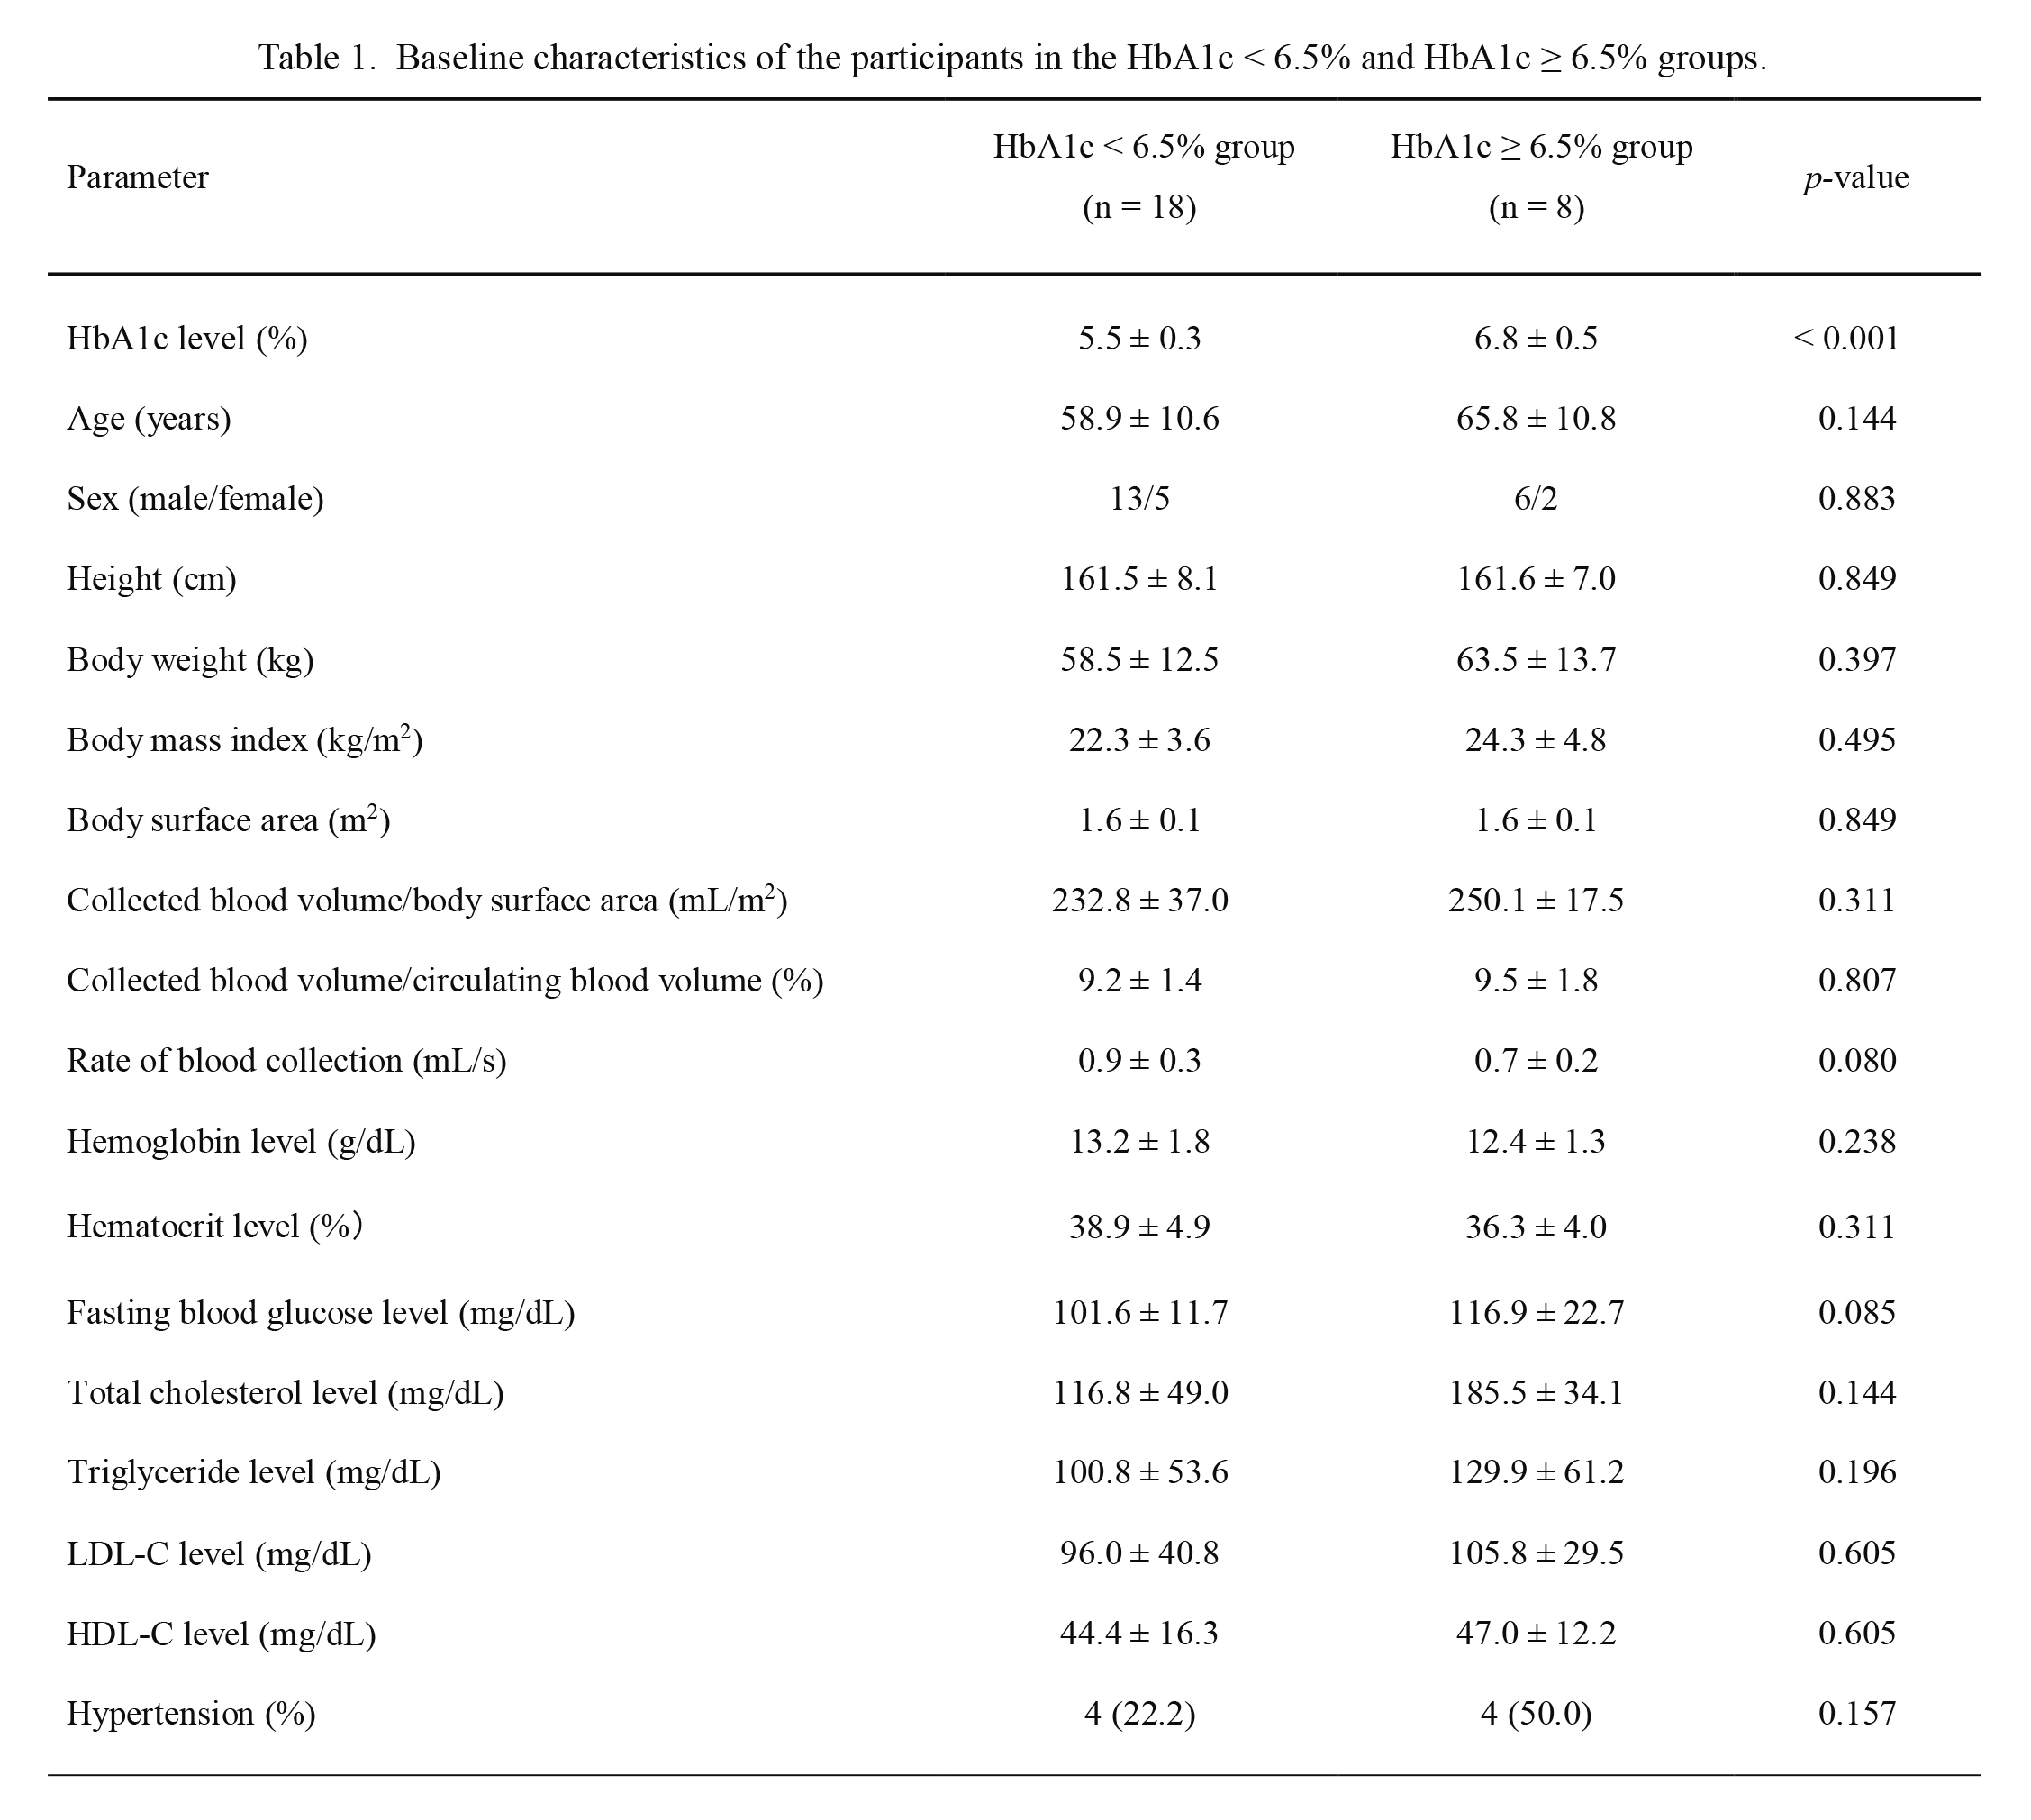
Participants’ mean age was 61.0 ± 11.0 years. Values for their average height, body weight, and BMI were 161.5 ± 7.6 cm, 60.1 ± 12.8 kg, and 22.9 ± 4.0 kg/m2, respectively. The collected blood volume was 9.3 ± 1.5% of the circulating blood volume. The main demographic and clinical characteristics of participants in the two groups are shown in Table 1 and Table 2, respectively. In the HbA1c < 6.5% (n = 18) and HbA1c ≥ 6.5% groups (n = 8), the mean values for HbA1c were 5.5 ± 0.3% (36.9 ± 3.2 mmol/mol) and 6.8 ± 0.5% (51.0 ± 5.0 mmol/mol), respectively. There was no significant between-group difference in the baseline characteristics, except for the HbA1c level (p < 0.001).
Changes in the cardiovascular dynamics during blood volume reduction
Changes in the hemodynamic variables during stages 4 and 5 are shown in Fig. 2. According to the time course of blood volume reduction in the HbA1c < 6.5% group, the HR significantly increased in the later blood donation stage compared to the pre-blood (p = 0.022) and forward blood donation stages (p = 0.003). In the HbA1c ≥ 6.5% group, the HR significantly increased in the later (p = 0.004) and post-blood donation stages (p = 0.006) compared to the forward blood donation stage. There were variations in the SBP and DBP during the five stages in both groups, but the changes were not statistically significant.
Changes in the autonomic nervous system during blood volume reduction
Changes in the HF component and LF/HF ratio during the four stages are shown in Fig. 3. In the pre-blood donation stage, the HF component and LF/HF ratio between both groups were not statistically significant.
With the course of blood volume reduction, the HF component continued to decrease from the pre-blood to post-blood donation stage in the HbA1c < 6.5% group. Specifically, a significant decrease in the later (p = 0.014) and post-blood donation stages (p < 0.001) was observed compared with the pre-blood donation stage, and a significant decrease in the post-blood donation stage was observed compared with the forward blood donation stage (p = 0.004). In contrast, in the HbA1c ≥ 6.5% group, there was variation in the HF component during the four stages, but the change was not statistically significant.
The LF/HF ratio continued to increase from the pre-blood to post-blood donation stage in the HbA1c < 6.5% group, with a significant increase in the later (p = 0.006) and post-blood donation stages (p < 0.001) compared to the pre-blood donation stage. In the HbA1c ≥ 6.5% group, the LF/HF ratio significantly increased from the later to post-blood donation stage (p = 0.040).
Association between the HbA1c level and autonomic nervous system
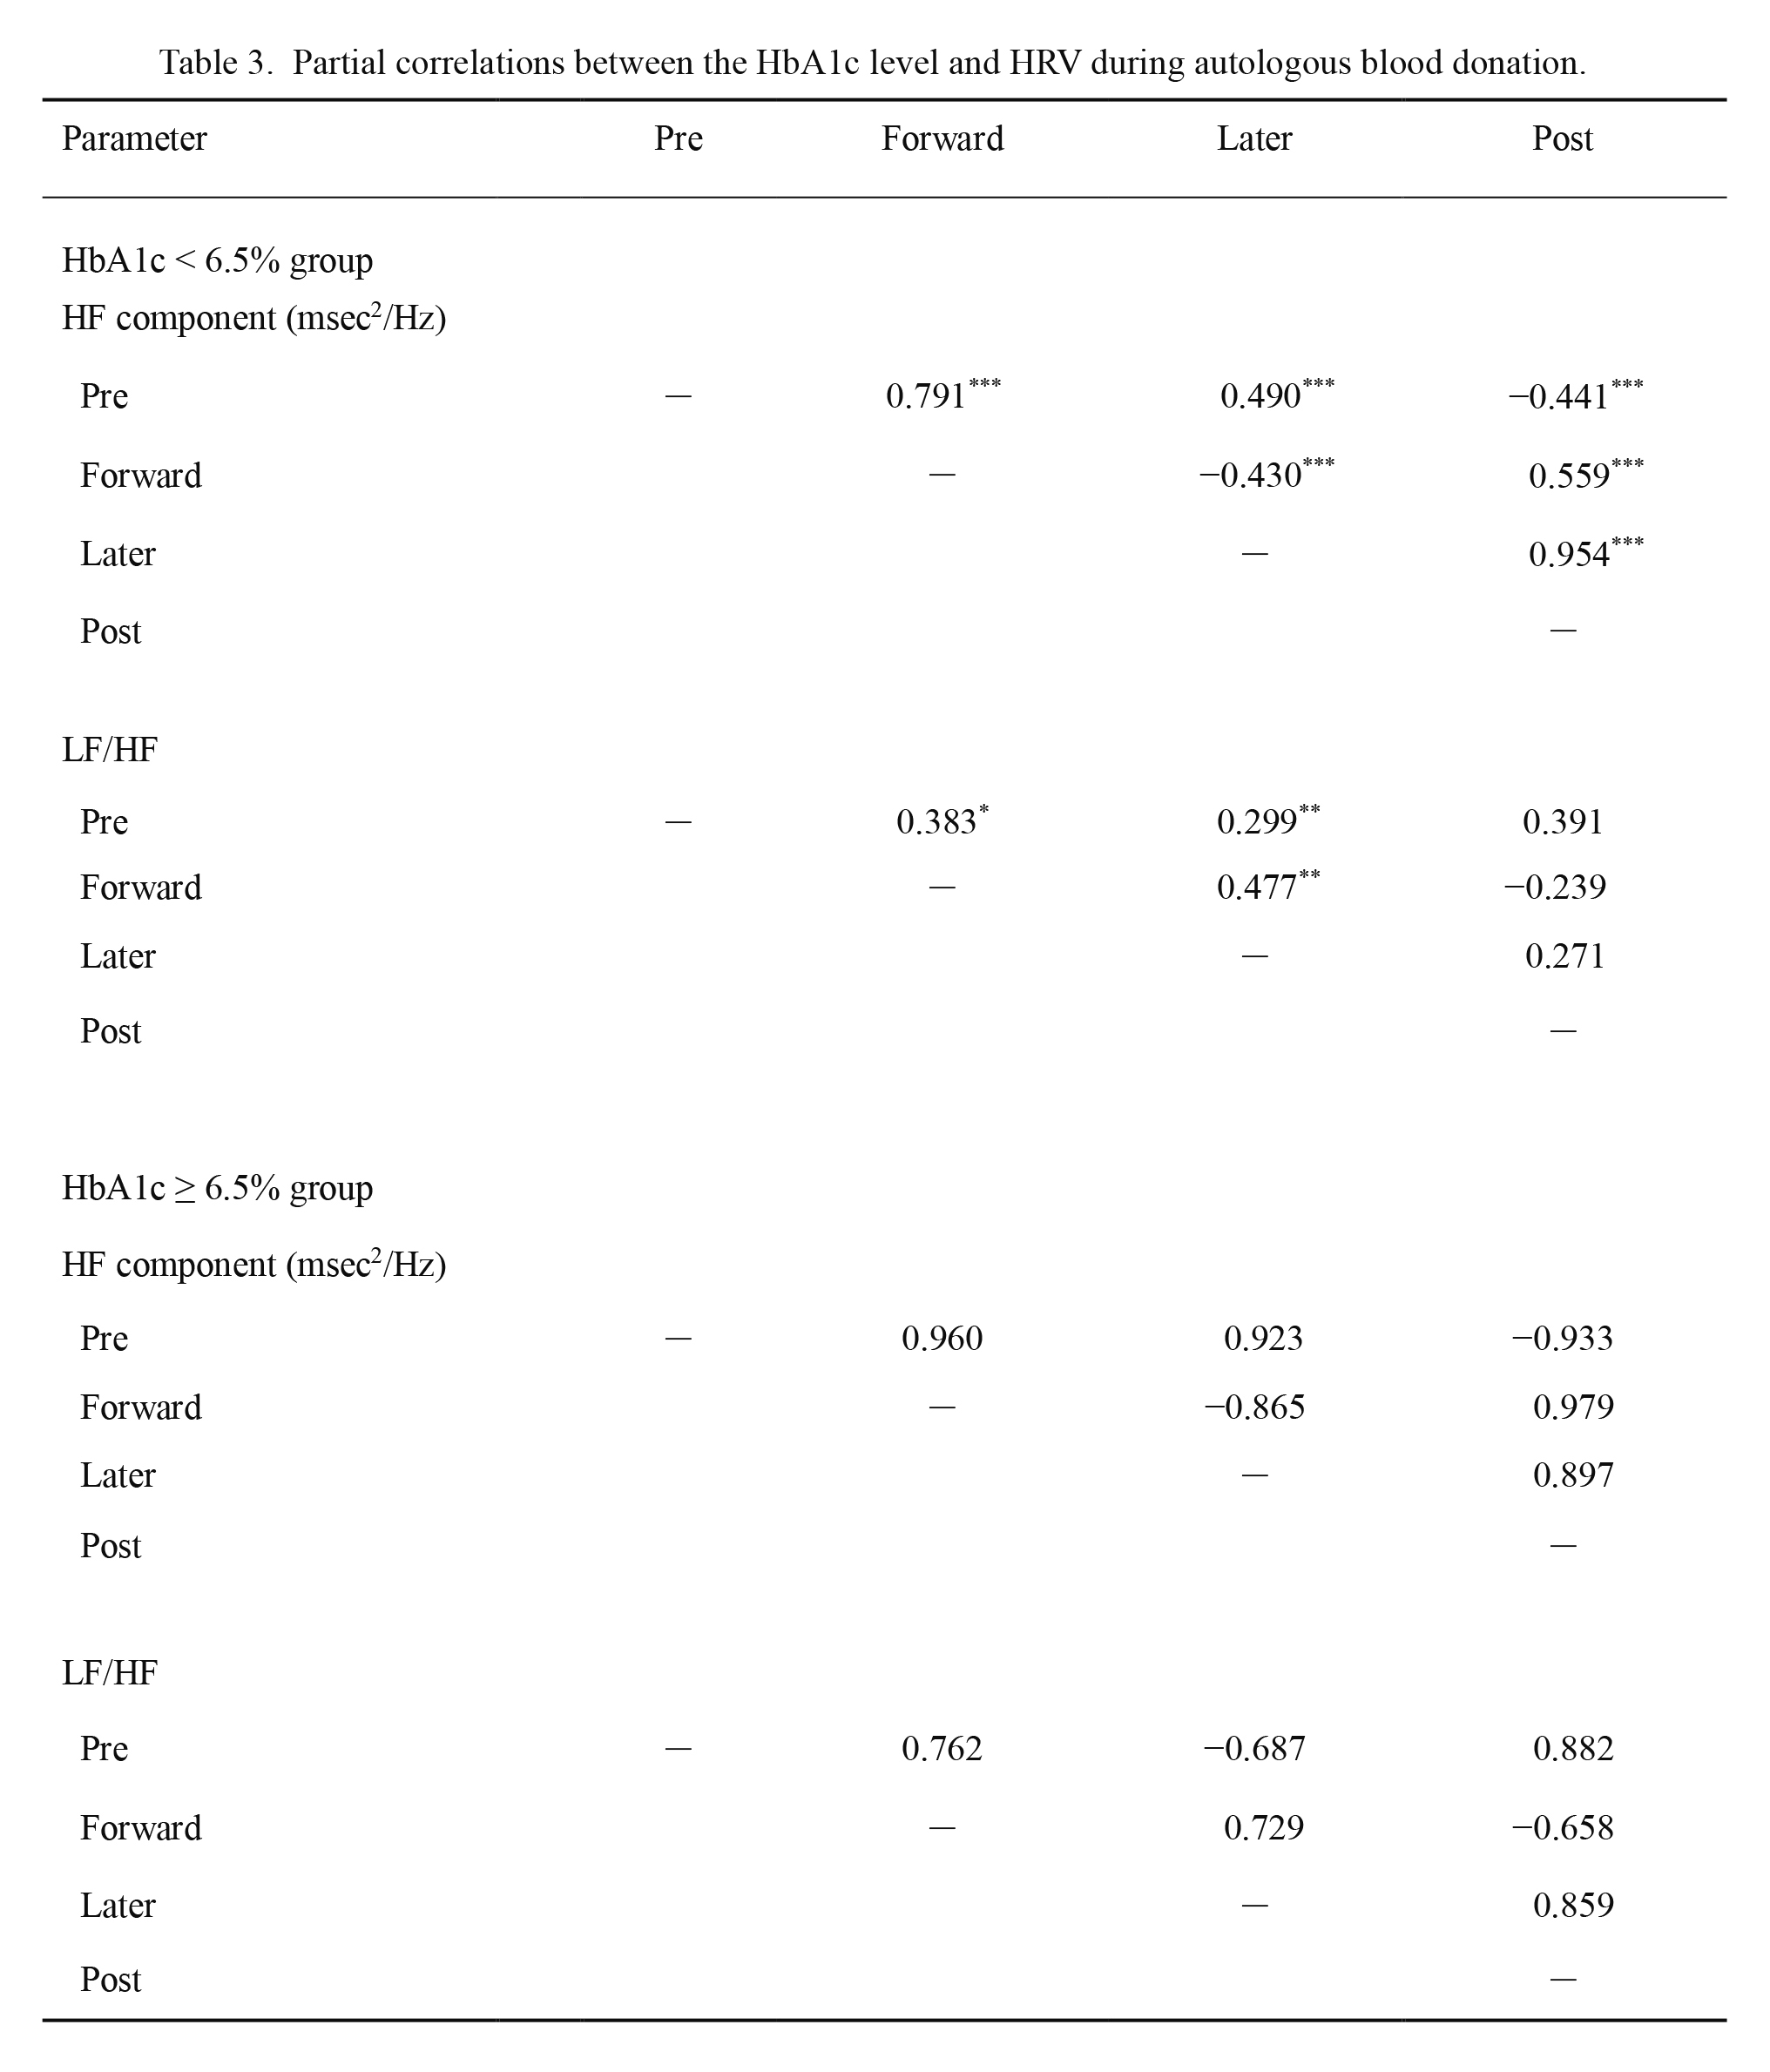
To determine whether the HbA1c level affected time-dependent changes in HRV during blood volume reduction, a partial correlation analysis was conducted. The results are shown in Table 3. Regarding the HF component of the HbA1c < 6.5% group, there were significant relationships among the pre-blood, forward (r = 0.791, p < 0.001), later (r = 0.490, p < 0.001), and post-blood donation stages (r = −0.441, p < 0.001); among the forward, later (r = −0.430, p < 0.001), and post-blood donation stages (r = 0.559, p < 0.001); and between the later and post-blood donation stages (r = 0.954, p < 0.001). Regarding the LF/HF ratio of the HbA1c < 6.5% group, there were significant relationships among the pre-blood, forward (r = 0.383, p = 0.016), and later blood donation stages (r = 0.299, p = 0.008); and between the forward and later blood donation stages (r = 0.477, p = 0.006). The relationships among these stages in the HbA1c ≥ 6.5% group were not significant.
Discussion
Cardiovascular dynamics and autonomic regulation during blood volume reduction
The HR, SBP, and DBP showed variation in accordance with blood volume reduction in both groups (Fig. 2). However, these variations remained within the clinically normal range during autologous blood donation. These results were consistent with the findings of previous studies that used blood donation as a model of mild to moderate blood loss (350-500 mL of whole blood) in healthy adults (Triedman et al. 1993; Kosowsky et al. 2002; Haberthür et al. 2003; Zöllei et al. 2004). According to the five classes of hemorrhagic shock, the quantity of blood volume loss in the present study constitutes less than a class I hemorrhage (15% of the circulating blood volume) (American College of Surgeons Committee on Trauma 2012). Abnormal changes in the vital signs are mostly confirmed in cases with more than a class III hemorrhage (30% of the circulating blood volume) (American College of Surgeons Committee on Trauma 2012). In emergency and critical situations, the initial intervention based on the appropriate assessment of the patient’s condition affects the prognosis; hence, measurements of HR and BP, although generally regarded as noninvasive and readily available principal markers in evaluating medical conditions, have been considered to be poor markers for assessing acute blood loss, severity of the shock, and response to treatment at an early stage (Wo et al. 1993).
Our results support the view that the vital signs did not remarkably change due to the initial, mild blood loss. The effect of hemorrhage in the present study could have been too mild to cause any hemodynamic change, and it may have been offset by an internal regulatory mechanism to maintain homeostasis. Regarding one of the reasons why these markers are unchanged at an early stage, the measurements of HR and BP are altered by neuromodulation and humoral regulation, which establishes a short-term and long-term regulatory system through a baroreceptor reflex in response to a decrease in the circulating blood volume (Schadt and Ludbrook 1991), and it occurs as a result of these internal regulatory mechanisms. The autonomic nervous system, which mediates the baroreceptors (arterial and carotid sinus) and cardiopulmonary receptor, establishes a short-term regulatory system for maintaining cardiovascular stability. This mostly initial compensatory mechanism leads to cardiac vagal withdrawal and sympathetic activation immediately induced by blood volume reduction (Schadt and Ludbrook 1991; Triedman et al. 1993; Furlan et al. 2001). In our study, with the course of blood volume reduction, the HF component, as an index of cardiac vagal nerve activity, and the LF/HF ratio, as an index of sympathetic nerve activity, significantly continued to decrease and increase from the pre-blood to post-blood donation stage in the HbA1c < 6.5% group. Thus, regarding the evaluation of the autonomic response by HRV in the present study, the decrease in the HF component and increase in LF/HF ratio had relevance to blood loss in the HbA1c < 6.5% group (Fig. 3). Only a few previous studies have evaluated HRV during blood donation in humans (Triedman et al. 1993; Zöllei et al. 2004; Middleton et al. 2008). These studies reported that due to blood loss (350-500 mL), the HF power and LF/HF ratio have a tendency to decrease (Triedman et al. 1993; Zöllei et al. 2004; Middleton et al. 2008) and increase (Middleton et al. 2008). The results of these previous studies in healthy adults were similar to those of our study’s findings for participants in the HbA1c < 6.5% group.
Considering these physiological findings, our results indicated that HRV can indicate cardiac autonomic regulation as a compensatory mechanism at an early stage, which is a blood volume reduction of approximately 10% of the circulating blood volume. Interestingly, a continuously decreasing cardiac vagal nerve activity and increasing sympathetic nerve activity were demonstrated throughout the process of blood volume reduction.
The present study included participants with medically treated hypertension. Some studies have reported decreased HRV among patients with hypertension (Liao et al. 1996; Singh et al. 1998; Fagard et al. 2001). However, whether hypertension leads to changes in HRV is not yet clear (Mussalo et al. 2001). A cohort study demonstrated that there was no measurable difference in the rate of changes in HRV among those with and without hypertension, and this finding suggested that differences in the autonomic profile of hypertensives and normotensives do not increase over time (Schroeder et al. 2003). In the present study, no significant difference was found among those with and without hypertension between the two groups (Table 1). Therefore, we considered that the effect of hypertension was small in our study.
The findings of our study suggest that evaluating HRV can help detect changes in autonomic function, which immediately regulated BP and HR within the clinically normal range, and HRV may provide valuable information at an early stage to characterize blood volume reduction, even in small amounts of approximately 10% of the circulating blood volume.
The effect of a high glycemic status on the autonomic response during blood volume reduction
In the present study, the HF component and LF/HF ratio in the pre-blood donation stage were not statistically significant between the two groups (Fig. 3). A high glycemic status induces the presence of heightened sympathetic and reduced parasympathetic activity, which is supported by previous studies in patients with diabetes mellitus compared to non-diabetes or healthy adults at rest (Liao et al. 1995; Santini et al. 2007). Generally, HRV parameters decrease in patients with diabetes mellitus (Task Force of the European Society of Cardiology the North American Society of Pacing Electrophysiology 1996; Xhyheri et al. 2012), although it is considered that these observations occur with the progression of diabetes mellitus and are probably due to the complication of autonomic neuropathy (Schroeder et al. 2005). Since our study was performed on participants who did not meet the diagnostic criteria for early intervention for diabetes mellitus, these signs may not have been easy to recognize. The strength of our study was that time-dependent changes in HRV during a high glycemic status, and the association between HbA1c and HRV were evaluated throughout the process of blood volume reduction for the first time. As aforementioned, with the course of blood volume reduction, the HF component and LF/HF ratio continued to decrease and increase from the pre-blood to post-blood donation stage in the HbA1c < 6.5% group. However, in the HbA1c ≥ 6.5% group, changes in the HF component were not statistically significant, and the LF/HF ratio significantly increased from the later to post-blood donation. The increase in the LF/HF ratio was delayed in the HbA1c ≥ 6.5% group compared to the HbA1c < 6.5% group (Fig. 3). This decreased autonomic response in the HbA1c ≥ 6.5% group may be the cause of the delayed increase in HR compared to the HbA1c < 6.5% group during blood volume reduction (Fig. 2). Generally, the compliance of vessel walls decreases, because vascular endothelial cells are damaged by the inflammatory reaction in a high glycemic status. The baroreceptor reflex, which is a stretch receptor, has an important role in the initial compensatory mechanism for maintaining cardiovascular stability during changes in the intravascular volume, and this reflex reduces in patients with diabetes mellitus (Frattola et al. 1997). Therefore, the findings of our study suggest that the baroreceptor reflex for changes in the intravascular volume was reduced, and it may induce an imbalance of the autonomic response in participants with HbA1c levels ≥ 6.5%. Additionally, because it was an abnormal autonomic response despite the fact that blood volume decreased, another compensatory mechanism, including transcapillary refill (Drucker et al. 1981) or hormonal regulation, may be involved. This compensatory response may be involved in the increase in HR at a later blood donation stage in the HbA1c ≥ 6.5% group.
In our study, the amount of blood volume reduction was 200-400 mL, although there was no significant difference in collected blood volume per BSA or the circulating blood volume and BMI between the two groups (Table 1). Hence, we considered that the difference of the amount of blood volume reduction among participants had little effect on the results of this study. Interestingly, the autonomic response was decreased in participants with HbA1c levels ≥ 6.5% during blood volume reduction of approximately 10% of the circulating blood volume, even if small amounts of blood loss were regarded as clinically insignificant. Our findings suggest that this imbalance of autonomic response reflected by HRV can indicate an incomplete initial compensatory mechanism, and cardiovascular failure may be easily caused in the presence of major injury (e.g., moderate or severe hemorrhage in those with an HbA1c level ≥ 6.5%).
Some studies have shown that there was a correlation between the HbA1c level and HRV at rest (Mirza and Laksmi 2012; Tarvainen et al. 2014). In our study, there was a significant relationship among the pre-blood, forward, later, and post-blood donation stages of HF, and among the pre-blood, forward, and later blood donation stages of the LF/HF ratio only in participants with an HbA1c level < 6.5% (Table 3). Although the accumulation of further data is necessary because there may be statistical bias due to the small sample size, these findings suggested that the glycemic status determined by the level of HbA1c may be closely related to the autonomic response depending on the time course during blood volume reduction, and this relationship disappeared in patients with an HbA1c level ≥ 6.5%.
Among people with diabetes mellitus, a dose relationship between the glycemic states measured by the HbA1c level and heart failure, myocardial infraction, and microvascular complications risk has been reported in an epidemiologic study; HbA1c is an independent risk factor for incident circulatory failure in diabetic patients with or without coronary heart disease (Pazin-Filho et al. 2008). We believe that an increased HbA1c level as a factor affecting the autonomic regulation should be considered in the assessment of cardiovascular dynamics, as it may provide additional beneficial clinical information at an early stage.
This study has some limitations. First, the sample size was small. The data were obtained for participants who were scheduled for autologous blood donation for use in surgery, and this sample was collected from an occupational medical practice, which restricted the number of samples available to examine. Furthermore, the number of samples was limited to populations with a high glycemic status who did not meet the diagnostic criteria for diabetes mellitus to focus on early intervention. Second, the measurement performed during the pre-blood donation stage may have been affected by psychological stress induced by cannulation. Finally, we did not investigate the change in HRV according to the graded level of the HbA1c. Additional large-scale clinical studies are needed to improve our understanding of this relationship.
Conclusions
During blood volume reduction of approximately 10% of the circulating blood volume, at which the BP and HR remained within the clinically normal range, the HF component and LF/HF ratio significantly decreased and increased in the HbA1c < 6.5% group, whereas in the HbA1c ≥ 6.5% group, this HRV response was not observed. Furthermore, for only the HbA1c level < 6.5% group, a time-dependent relationship with changes in the HRV was recognized during blood volume reduction. These results indicate that at an early stage, elevated HbA1c levels are associated with the decrease in the autonomic response induced by blood volume reduction.
Acknowledgments
This study was funded by the Classroom Operational Grant of Tohoku University.
Conflict of Interest
The authors declare no conflict of interest.
References
-
American College of Surgeons Committee on Trauma
(2012) Advanced Trauma Life Support Student Course Manual, 9nd ed., American College of Surgeons, Chicago, IL.
-
Burgos,
L.G.,
Ebert,
T.J.,
Asiddao,
C.,
Turner,
L.A.,
Pattison,
C.Z.,
Wang-Cheng,
R. &
Kampine,
J.P.
(1989) Increased intraoperative cardiovascular morbidity in diabetics with autonomic neuropathy. Anesthesiology, 70, 591-597.
-
Drucker,
W.R.,
Chadwick,
C.D. &
Gann,
D.S.
(1981) Transcapillary refill in hemorrhage and shock. Arch. Surg., 116, 1344-1353.
-
Du Bois,
D. &
Du Bois,
E.F.
(1916) Clinical calorimetry: tenth paper. A formula to estimate the approximate surface area if height and weight be known. Arch. Intern. Med., 17, 863-871.
-
Fagard,
R.H.,
Pardaens,
K. &
Staessen,
J.A.
(2001) Relationships of heart rate and heart rate variability with conventional and ambulatory blood pressure in the population. J. Hypertens., 19, 389-397.
-
Frattola,
A.,
Parati,
G.,
Gamba,
P.,
Paleari,
F.,
Mauri,
G.,
Di Rienzo,
M.,
Castiglioni,
P. &
Mancia,
G.
(1997) Time and frequency domain estimates of spontaneous baroreflex sensitivity provide early detection of autonomic dysfunction in diabetes mellitus. Diabetologia, 40, 1470-1475.
-
Furlan,
R.,
Jacob,
G.,
Palazzolo,
L.,
Rimoldi,
A.,
Diedrich,
A.,
Harris,
P.A.,
Porta,
A.,
Malliani,
A.,
Mosqueda-Garcia,
R. &
Robertson,
D.
(2001) Sequential modulation of cardiac autonomic control induced by cardiopulmonary and arterial baroreflex mechanisms. Circulation, 104, 2932-2937.
-
Goldstein,
D.E.,
Little,
R.R.,
Lorenz,
R.A.,
Malone,
J.I.,
Nathan,
D.M.,
Peterson,
C.M. &
Sacks,
D.B.;
American Diabetes Association
(2004) Tests of glycemia in diabetes. Diabetes Care, 27, S91-S93.
-
Haberthür,
C.,
Schächinger,
H.,
Seeberger,
M. &
Gysi,
C.S.
(2003) Effect of non-hypotensive haemorrhage on plasma catecholamine levels and cardiovascular variability in man. Clin. Physiol. Funct. Imaging., 23, 159-165.
-
Japanese Society of Autologous Blood Transfusion
(2014) Guidelines for autologous blood donation. http://www.jsat.jp/jsat_web/down_load/pdf/cyoketsushikijikoketsu_shishin2014.pdf [Accessed: May 18, 2016] (in Japanese).
-
Knüttgen,
D.,
Büttner Belz,
U.,
Gernot,
A.,
& Doehn,
M.
(1990) Unstable blood pressure during anesthesia in diabetic patients with autonomic neuropathy. Anasth. Intensivther. Notfallmed., 25, 256-262 (in German).
-
Kosowsky,
J.M.,
Han,
J.H.,
Collins,
S.P.,
McAfee,
A.T. &
Storrow,
A.B.
(2002) Assessment of stroke index using impedance cardiography: comparison with traditional vital signs for detection of moderate acute blood loss in healthy volunteers. Acad. Emerg. Med., 9, 775-780.
-
Laederch-Hofmann,
K.,
Mussgay,
L.,
Winter,
A.,
Klinkenberg,
N. &
Rüddel,
H.
(1999) Early autonomic dysfunction in patients with diabetes mellitus assessed by spectral analysis of heart rate and blood pressure variability. Clin. Physiol., 19, 97-106.
-
Liao,
D.,
Cai,
J.,
Barnes,
R.W.,
Tyroler,
H.A.,
Rautahariu,
P.,
Holme,
I. &
Heiss,
G.
(1996) Association of cardiac autonomic function and the development of hypertension: the ARIC Study. Am. J. Hypertens., 9, 1147-1156.
-
Liao,
D.,
Cai,
J.,
Brancati,
F.L.,
Folsom,
A.,
Barnes,
R.W.,
Tyroler,
H.A. &
Heiss,
G.
(1995) Association of vagal tone with serum insulin, glucose, and diabetes mellitus-The ARIC Study. Diabetes Res. Clin. Pract., 30, 211-221.
-
Little,
R.R.
(2003) Glycated hemoglobin standardization − National Glycohemoglobin Standardization Program (NGSP) perspective. Clin. Chem. Lab. Med., 41, 1191-1198.
-
Little,
R.R.,
Rohlfing,
C.L. &
Sacks,
D.B.;
National Glycohemoglobin Standardization Program (NGSP) Steering Committee
(2011) Status of hemoglobin A1c measurement and goals for improvement: from chaos to order for improving diabetes care. Clin. Chem., 57, 205-214.
-
Lyon,
M.,
Blaivas,
M. &
Brannam,
L.
(2005) Sonographic measurement of the inferior vena cava as a marker of blood loss. Am. J. Emerg. Med., 23, 45-50.
-
Middleton,
P.M.,
Chan,
G.S.,
O’Lone,
E.,
Steel,
E.,
Carroll,
R.,
Celler,
B.G. &
Lovell,
N.H.
(2008) Spectral analysis of finger photoplethysmographic waveform variability in a model of mild to moderate haemorrhage. J. Clin. Monit. Comput., 22, 343-353.
-
Mirza,
M. &
Laksmi,
A.N.R.
(2012) A comparative study of heart rate variability in diabetic subjects and normal subjects. Int. J. Biomed. Adv. Res., 3, 640-644.
-
Mussalo,
H.,
Vanninen,
E.,
Ikäheimo,
R.,
Laitinen,
T.,
Laakso,
M.,
Länsimies,
E. &
Hartikainen,
J.
(2001) Heart rate variability and its determinants in patients with severe or mild essential hypertension. Clin. Physiol., 21, 594-604.
-
Ogawa,
R.,
Fujita,
T. &
Fukuda,
Y.
(1970) Blood volume studies in healthy Japanese adults. Respir. Circ., 18, 833-838 (in Japanese).
-
Pagani,
M.,
Lombardi,
F.,
Guzzetti,
S.,
Rimoldi,
O.,
Furlan,
R.,
Pizzinelli,
P.,
Sandrone,
G.,
Malfatto,
G.,
Dell’Orto,
S.,
Piccaluga,
E.,
Turiel,
M.,
Basellia,
G.,
Cerutti,
S. &
Malliani,
A.
(1986) Power spectral analysis of heart rate and arterial pressure variabilities as a marker of sympatho-vagal interaction in man and conscious dog. Circ. Res., 59, 178-193.
-
Pazin-Filho,
A.,
Kottgen,
A.,
Bertoni,
A.G.,
Russell,
S.D.,
Selvin,
E.,
Rosamond,
W.D. &
Coresh,
J.
(2008) HbA1c as a risk factor for heart failure in persons with diabetes: the Atherosclerosis Risk in Communities (ARIC) study. Diabetologia, 51, 2197-2204.
-
Pomeranz,
B.,
Macaulay,
R.J.,
Caudill,
M.A.,
Kutz,
I.,
Adam,
D.,
Gordon,
D.,
Kilborn,
K.M.,
Barger,
A.C.,
Shannon,
D.C.,
Cohen,
R.J. &
Benson,
H.
(1985) Assessment of autonomic function in humans by heart rate spectral analysis. Am. J. Physiol., 248, H151-H153.
-
Pop-Busui,
R.
(2010) Cardiac autonomic neuropathy in diabetes. Diabetes Care, 33, 434-441.
-
Rea,
R.F.,
Hamdan,
M.,
Clary,
M.P.,
Randels,
M.J.,
Dayton,
P.J. &
Strauss,
R.G.
(1991) Comparison of muscle sympathetic responses to hemorrhage and lower body negative pressure in humans. J. Appl. Physiol. (1985), 70, 1401-1405.
-
Santini,
V.,
Ciampittiello,
G.,
Gigli,
F.,
Bracaglia,
B.,
Baroni,
A.,
Cicconetti,
E.,
Verri,
C.,
Gambardella,
S. &
Frontoni,
S.
(2007) QTc and autonomic neuropathy in diabetes: effects of acute hyperglycaemia and n-3 PUFA. Nutr. Metab. Cardiovasc. Dis., 17, 712-718.
-
Schadt,
J.C. &
Ludbrook,
J.
(1991) Hemodynamic and neurohumoral responses to acute hypovolemia in conscious mammals. Am. J. Physiol., 260, H305-H318.
-
Schroeder,
E.B.,
Chambless,
L.E.,
Liao,
D.,
Prineas,
R.J.,
Evans,
G.W.,
Rosamond,
W.D. &
Heiss,
G.
(2005) Diabetes, glucose, insulin, and heart rate variability: the Atherosclerosis Risk in Communities (ARIC) study. Diabetes Care, 28, 668-674.
-
Schroeder,
E.B.,
Liao,
D.,
Chambless,
L.E.,
Prineas,
R.J.,
Evans,
G.W. &
Heiss,
G.
(2003) Hypertension, blood pressure, and heart rate variability: the Atherosclerosis Risk in Communities (ARIC) Study. Hypertension, 42, 1106-1111.
-
Seino,
Y.,
Nanjo,
K.,
Tajima,
N.,
Kadowaki,
T.,
Kashiwagi,
A.,
Araki,
E.,
Ito,
C.,
Inagaki,
N.,
Iwamoto,
Y.,
Kasuga,
M.,
Hanafusa,
T.,
Haneda,
M. &
Ueki,
K.;
The Committee of the Japan Diabetes Society on the Diagnostic Criteria of Diabetes Mellitus
(2010) Report of the committee on the classification and diagnostic criteria of diabetes mellitus. Diabetol. Int., 1, 2-20.
-
Singh,
J.P.,
Larson,
M.G.,
Tsuji,
H.,
Evans,
J.C.,
O’Donnell,
C.J. &
Levy,
D.
(1998) Reduced heart rate variability and new-onset hypertension: insights into pathogenesis of hypertension: the Framingham Heart Study. Hypertension, 32, 293-297.
-
Tarvainen,
M.P.,
Laitinen,
T.P.,
Lipponen,
J.A.,
Cornforth,
D.J. &
Jelinek,
H.F.
(2014) Cardiac autonomic dysfunction in type 2 diabetes − effect of hyperglycemia and disease duration. Front. Endocrinol. (Lausanne), 5, 130.
-
Task Force of the European Society of Cardiology the North American Society of Pacing Electrophysiology
(1996) Heart rate variability: standards of measurement, physiological interpretation, and clinical use. Circulation, 93, 1043-1065.
-
The International Expert Committee
(2009) International Expert Committee report on the role of the A1C assay in the diagnosis of diabetes. Diabetes Care, 32, 1327-1334.
-
Triedman,
J.K.,
Cohen,
R.J. &
Saul,
J.P.
(1993) Mild hypovolemic stress alters autonomic modulation of heart rate. Hypertension, 21, 236-247.
-
Wo,
C.C.,
Shoemaker,
W.C.,
Appel,
P.L.,
Bishop,
M.H.,
Kram,
H.B. &
Hardin,
E.
(1993) Unreliability of blood pressure and heart rate to evaluate cardiac output in emergency resuscitation and critical illness. Crit. Care Med., 21, 218-223.
-
Wu,
J.S.,
Yang,
Y.C.,
Lu,
F.H.,
Wu,
C.H.,
Wang,
R.H. &
Chang,
C.J.
(2009) Population-based study on the prevalence and risk factors of orthostatic hypotension in subjects with pre-diabetes and diabetes. Diabetes Care, 32, 69-74.
-
Xhyheri,
B.,
Manfrini,
O.,
Mazzolini,
M.,
Pizzi,
C. &
Bugiardini,
R.
(2012) Heart rate variability today. Prog. Cardiovasc. Dis., 55, 321-331.
-
Yagihashi,
S.,
Mizukami,
H. &
Sugimoto,
K.
(2011) Mechanism of diabetic neuropathy: where are we now and where to go? J. Diabetes Investig., 2, 18-32.
-
Zöllei,
E.,
Paprika,
D.,
Makra,
P.,
Gingl,
Z.,
Vezendi,
K. &
Rudas,
L.
(2004) Human autonomic responses to blood donation. Auton. Neurosci., 110, 114-120.