Abstract
Adult T-cell leukemia/lymphoma (ATL/ATLL) is one of the most malignant lymphomas with poor prognosis. ATL/ATLL cells express CC chemokine receptor 4, and mogamulizumab (anti-CCR4 monoclonal antibody) exhibits strong cytotoxicity for ATL/ATLL cells. We analyzed plasma samples of 6 patients with ATL/ATLL treated with chemotherapy followed by mogamulizumab therapy (mogatherapy) for changes in the levels of biomarkers in relation to immune-related adverse effects. As treatment is often associated with skin eruptions, we investigated the profiles of inflammatory cytokines, including galectin-9 (Gal-9), which becomes increased in various infectious diseases and allergic patients. Gal-9, soluble interleukin (IL)-2 receptor, tumor necrosis factor-α, and IL-10 levels were increased before chemotherapy, and Gal-9 levels were associated with the sIL-2 receptor, which reflects tumor burden. Inflammatory levels decreased after chemotherapy. After mogatherapy, 5 of 6 patients attained complete remission (CR), whereas 1 patient showed no response (NR) and died. Among 5 patients with CR, the biomarkers remained low during mogatherapy, except for a 3-5-fold increment in Gal-9 (associated with skin eruptions). A skin biopsy showed infiltration by inflammatory cells and Gal-9 synthesis in areas with CD8 cell infiltration. In the patient with NR, increased levels of Gal-9 and the aforementioned biomarkers were noted 3 days after mogatherapy, followed by opportunistic infections resembling immune reconstitution inflammatory syndrome. Therefore, an increased Gal-9 plasma level in ATL/ATLL indicates tumor burden and reflects immune activation by mogatherapy. These findings may indicate that an increase in the Gal-9 level, a novel immune checkpoint molecule, can reflect immune-related adverse effects of various biotherapies.
Introduction
Adult T-cell leukemia/lymphoma (ATL/ATLL) was established as a distinct clinical entity in Japan in 1977 (Uchiyama et al. 1977), and it is associated with a poor prognosis (Tsukasaki et al. 2007). ATL/ATLL cells were initially shown to be positive for mature T-cell surface antigens CD3, CD4, and CD25, and negative for CD8 with rare occasions of double negativity or double positivity for CD4 and CD8 (Hattori et al. 1981; Hattori et al. 1991). Subsequent studies on the nature of ATL/ATLL cells have shown that they are also positive for regulatory T-cell (Treg) markers, such as FoxP3 (Karube et al. 2004; Roncador et al. 2005) and the CC chemokine receptor 4 (CCR4) (Yoshie et al. 2002). Moreover, several secreted (cytokine) and cell surface-associated (receptor) factors serve as important clues for monitoring the activity and prognosis of patients with ATL/ATLL (Yasuda et al. 1988; Yamada et al. 1996; Mori and Prager 1998). We have also shown that ATL/ATLL cells express the chemokine ligand 3 (Yamamura et al. 1989). Subsequently, ATL/ATLL cells were found to be CCR4+, which led to the development of anti-CCR4 monoclonal antibody (MoAb) therapy (KW-0761 or mogamulizumab) after discovering that about 90% of ATL/ATLL samples are positive for CCR4 (Ishida et al. 2003).
This antibody therapy was found to be effective for treating patients with ATL/ATLL (Ishida et al. 2012) who have limited treatment options owing to the intrinsic resistance of ATL/ATLL cells to conventional chemotherapy (Ikeda et al. 1999). However, treatment with mogamulizumab therapy (mogatherapy) has been often associated with skin eruptions as adverse effect, and a patient with ATL/ATLL with Stevens-Johnson syndrome after receiving the therapy was reported (Ishida et al. 2013). Accordingly, accumulating clinical evidence for the use of this newly introduced monoclonal antibody treatment is important to understanding its usefulness for treating ATL/ATLL.
We have been studying the roles of galectin-9 (Gal-9) in various disease conditions, such as acute virus infection, parasite infection, and allergy (Chagan-Yasutan et al. 2009, 2010, 2013; Saitoh et al. 2012; Dembele et al. 2016). Gal-9 is a β-galactoside binding lectin that has a demonstrated regulatory role in excessive immune responses (Oomizu et al. 2012). Gal-9 has been shown to induce Treg cells (Seki et al. 2008), which in turn have been reported to synthesize Gal-9 (Wang et al. 2009). Additionally, Gal-9 binds to T-cell immunoglobulin and mucin-domain containing-3 (TIM-3), inducing cell death in TIM-3 + T-helper (Th)-1 cells and ameliorating experimental autoimmune encephalitis (Monney et al. 2002; Zhu et al. 2005; Dardalhon et al. 2010). These findings led to the proposition of Gal-9 and its receptor TIM-3 as new immune checkpoint molecules (Anderson et al. 2016). Recently, ATL/ATLL cells were reported to have a Treg phenotype, and Gal-9 is expressed in normal Treg cells (Kohno et al. 2005; Ishida and Ueda 2011; Oomizu et al. 2012). However, it has not been clarified how Gal-9 is involved in the pathophysiology of ATL/ATLL and in immune alteration after mogatherapy directed against CCR4. Therefore, in this study, we retrospectively investigated plasma samples from patients with chemo-refractory ATL/ATLL treated with mogatherapy for changes in the plasma levels of Gal-9 and other biomarkers in relation to immune-related adverse effects.
Materials and Methods
Study design and patient samples
The study was a retrospective analysis of plasma samples from 11 patients with ATL/ATLL obtained at Kumamoto Shinto General Hospital; patients’ treatment was converted to mogatherapy after they were found to be resistant to chemotherapy (chemo-refractory). Samples were collected periodically from February 2014 to February 2015 to achieve several time points for analysis of biomarker profiles along the course of treatment. Eight patients had acute, 2 patients had smoldering, and 1 patient had lymphoma type ATL/ATLL. Among these 11 patients, 6 were included in this study, whereas the other 5 patients were excluded, as they did not have enough time points for evaluating biomarker trends. All patients were clinically diagnosed as having ATL/ATLL based on the accepted criteria for the diagnosis and clinical sub-classification of ATL/ATLL reported by the Japan Lymphoma Study Group (Shimoyama 1991). Blood was collected in tubes containing ethylenediaminetetraacetic acid to yield a final concentration of 0.1% and processed as described previously (Chagan-Yasutan et al. 2011). Plasma samples from 6 healthy individuals were used as healthy controls (HCs).
Clinical and laboratory data
The Eastern Cooperative Oncology Group performance status on a scale of 0-4, lactic dehydrogenase (LDH) level, relative proportion (%) of ATL/ATLL cells in peripheral blood, white blood cell count, platelet count, C-reactive protein (CRP) level, and other parameters were measured at Kumamoto Shinto General Hospital.
Courses of chemotherapy and mogatherapy
Patients had received various chemotherapies (Table 1) followed by mogatherapy due to chemotherapeutic failure. Subsequently, mogatherapy was continued until the disease resolved.
Luminex analysis
Plasma levels of 38 cytokines (interleukin (IL)-10, tumor necrosis factor (TNF)-α, CD40L, vascular endothelial growth factor, TNF-β, transforming growth factor-α, macrophage inflammatory protein-1β, chemokine ligand (CCL)-3, CCL22, monocyte chemotactic protein (MCP)-3, MCP-1, inducible protein-10, IL-17, IL-15, IL-13, IL-12, IL-12, IL-9, IL-8, IL-7, IL-6, IL-5, IL-4, IL-3, IL-2, IL-1 receptor antagonist, IL-1β, IL-1α, interferon (IFN)-γ, IFN-α2, GRO, granulocyte-macrophage colony-stimulating factor, granulocyte-colony stimulating factor, Fractalkine, Flt-3 ligand, fibroblast growth factor-2, eotaxin, and epidermal growth factor) were measured using a human cytokine/chemokine magnetic bead panel assay (EMD Millipore Corp., MA, USA), as previously described (Chagan-Yasutan et al. 2013).
Enzyme-linked immunosorbent assay
An enzyme-linked immunosorbent assay was used to measure the levels of Gal-9 (Gal Pharma Co., Ltd., Takamatsu, Japan) and soluble IL-2 receptor (sIL-2R) (Cell free N IL-2R, Kyowa Medex, Japan) (Chagan-Yasutan et al. 2013). Measurements were conducted in duplicate, and the mean value was used for analysis.
Immunohistochemistry
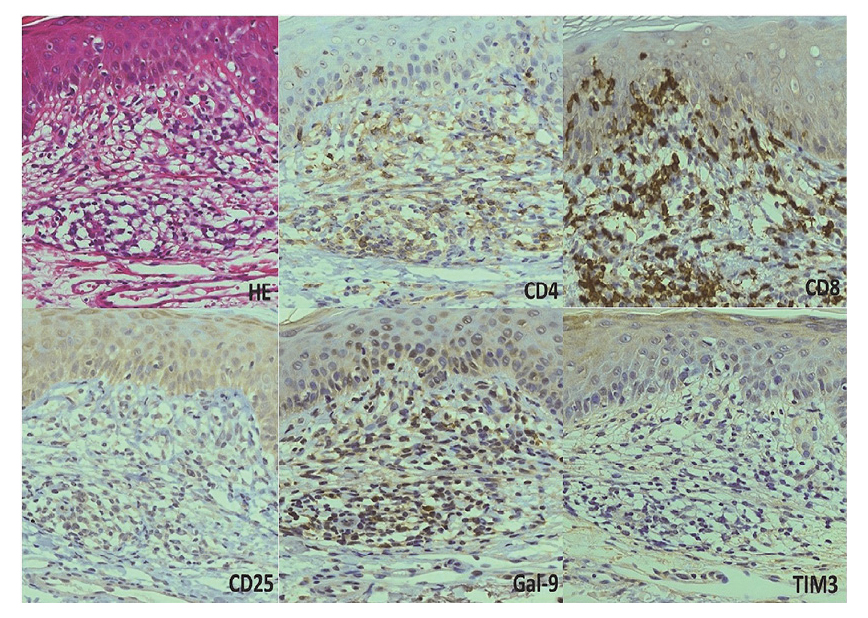
A skin biopsy was obtained for immunohistochemical analysis from one of the patients (case no. 5) who experienced skin eruption as adverse effect. The slide was stained with hematoxylin and eosin, and immunohistochemically analyzed for the expressions of CD4, CD8, CD25, Gal-9, and TIM3, as described previously (Chagan-Yasutan et al. 2011). The following antibodies were used in this order to analyze the expression of each of the aforementioned markers: anti-CD4 (clone 4B12, Nichirei Corp., Japan), anti-CD8 (clone C8/144B, Dako, USA), anti-CD25 (clone 4C9, Roche Diagnostics, USA), anti-Gal-9 (clone 9M1-3, Gal Pharma, Co., Ltd.), and anti-TIM3 (catalog #AF2365, R&D Systems, USA). The images were taken by AxioSkop2 microscope (Zeiss, German) with AxioCam HRc (Zeiss) and edited by AxioVision version4.8 (Zeiss).
Data analysis
Average cytokine plasma concentrations were determined to compare cytokine levels before and after treatment with chemotherapy to identify if any cytokines were initially increased at presentation; the change is expressed as a percentage decrease. Data from 3 patients were available for this purpose. Further, absolute cytokine concentrations at several time points were analyzed for each patient to investigate biomarker kinetics during the course of both chemotherapy and mogatherapy.
Statistical analysis
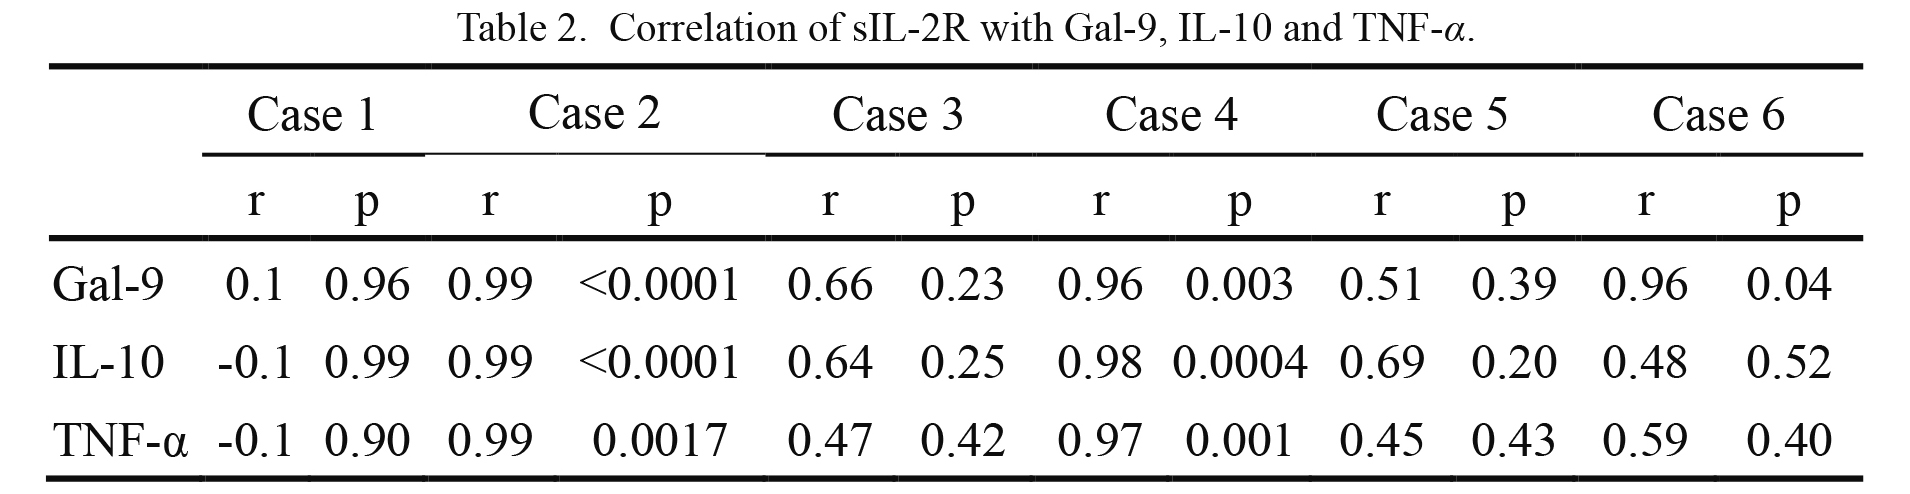
Graph Pad Prism, version 6 (GraphPad Software, San Diego, CA, USA) was used to perform data analysis and figure generation. The Pearson correlation coefficient was used to analyze associations between levels of sIL-2R and those of Gal-9, IL-10, and TNF-α during several time points. Differences of P < 0.05 were considered significant.
Ethical consideration
The study was conducted in accordance with the Declaration of Helsinki, and approved by the Ethics Committee of Tohoku University (approval no.: 2014-1-280) and Kumamoto Shinto General Hospital (approval no.: 25-05-02).
Results
Patients’ characteristics
Patients’ characteristics are summarized in Table 1. All 6 patients had received one or more courses of chemotherapy before switching to mogatherapy because of resistance to chemotherapy. Four of these patients (case nos. 1, 4, 5, and 6) experienced skin eruptions during or after mogatherapy. Finally, following the completion of mogatherapy, 5 patients exhibited complete remission (CR), whereas 1 patient (case no. 3) showed no response (NR) to therapy and died.
Increased levels of Gal-9, IL-10, and TNF-α at presentation
Forty biomarkers were analyzed in this study; however, 36 of them were either out of range below detection limit levels or very low concentrations close to the levels of HCs and were excluded.
To assess changes in biomarkers before and after treatment with chemotherapy, average concentrations in available plasma samples (from cases 2, 4, and 6) collected before and after treatment were analyzed. Levels of sIL-2R, Gal-9, IL-10, and TNF-α decreased markedly after chemotherapy. Particularly, levels of sIL-2R, Gal-9, and IL-10 decreased more than 80% (Fig. 1). Before chemotherapy, mean plasma concentrations for sIL-2R, Gal-9, IL-10, and TNF-α were 37,113 U/mL, 1,435 pg/mL, 69 pg/mL, and 29 pg/mL, respectively. Mean plasma concentrations levels of HCs, as calculated from 6 healthy individuals, were 302 U/mL, 117 pg/mL, 3 pg/mL, and 5 pg/mL for sIL-2R, Gal-9, IL-10, and TNF-α, respectively.
Levels of sIL-2R, Gal-9, IL-10, and TNF-α during the course of treatment with chemotherapy followed by mogatherapy
Biomarker levels were analyzed during the course of treatment with chemotherapy followed by mogatherapy (Fig. 2). sIL-2R levels initially increased before chemotherapy and decreased substantially afterward in case nos. 2 and 4, whereas it was low in case no. 1 both before and after chemotherapy. Also, high levels of sIL-2R in case no. 6 clearly decreased after mogatherapy. In contrast, the sIL-2R level increased in case no. 3. Changes in the Gal-9 level were very similar to those of the sIL-2R level. However, increments in Gal-9 levels were observed after mogatherapy in case nos. 1 and 5 when skin eruption was observed (Fig. 3A, B). Changes in the IL-10 level were also similar to those of the Gal-9 level, and there was a slight increase only in case no. 1 after mogatherapy. Changes in the TNF-α level were less pronounced, and the increase before mogatherapy in case no. 6 was small; however, a small increase was also seen in case no. 1 after mogatherapy. In contrast to the other patients, the levels of all markers remained high after mogatherapy in the patient with NR (case no. 3). In this patient, the highest peak of sIL-2R was observed just before death, whereas the highest peaks for Gal-9, IL-10, and TNF-α were 2 days after the initiation of mogatherapy. Results of statistical analysis indicated that the sIL-2R level was positively associated with all three biomarkers in case nos. 4 and 5, and with only the Gal-9 level in case no. 6 (Table 2).
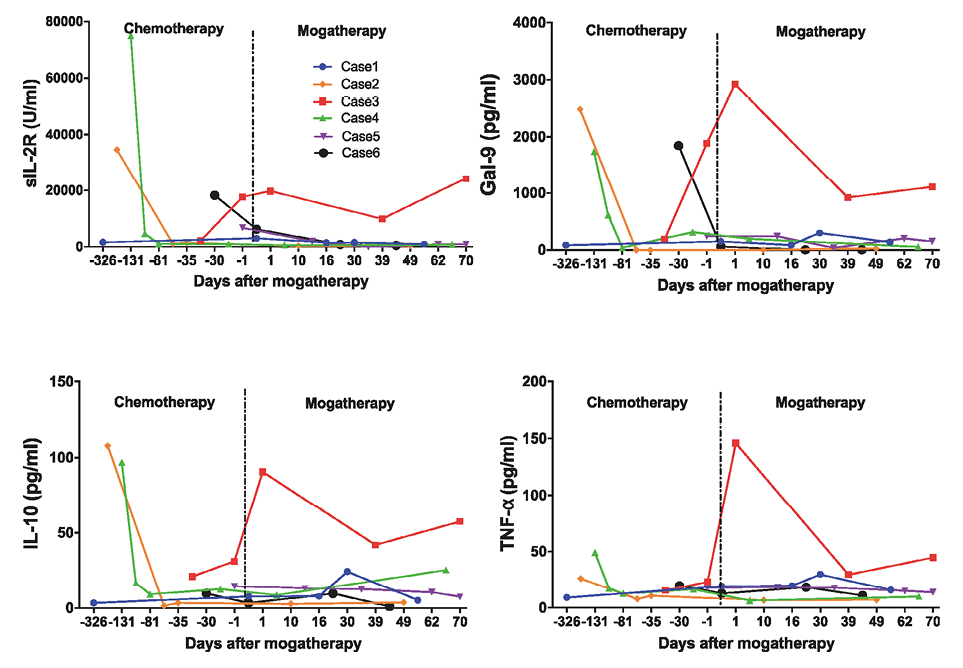
Although skin eruptions were not observed in patients during chemotherapy, 4 patients developed skin eruptions as adverse effect during or after mogatherapy (Table 1). Biomarkers were analyzed in case nos. 1 and 5 to investigate the relationship between plasma biomarker levels and the occurrence of skin eruptions. Blood samples were collected when skin eruptions occurred, and the plasma biomarker levels were measured. Compared to the previous time point, about a 3-fold increment in Gal-9 levels for case no. 1 and approximately a 5-fold increment for case no. 5 were observed (Fig. 3A, B).
Skin eruptions and immunohistochemical findings
Results of immunohistochemical analysis of a biopsy specimen from case no. 5 (Fig. 4) indicated predominant infiltration by CD8-positive cells over CD4-positive cells. Moreover, the area positive for CD8 was positive for Gal-9 but not for TIM-3. Biopsy results from another case of skin eruption (case no. 1) showed essentially similar results (data not shown).
Occurrence of multiple opportunistic infections (OI) in the patient with NR
As indicated in Table 1, 1 patient had NR to mogatherapy, and his condition failed to ameliorate during the course of treatment. This patient received chemotherapy from November 2013 to March 2014. He was found to have a Helicobacter pylori infection upon the diagnosis of acute ATL/ATLL, but no other infectious conditions were observed during chemotherapy. The recurrence of ATL/ATLL was observed in April 2014. Mogatherapy was started in May, 2014. Further, before the therapy, the numbers of ATL cells were 3,100/ul in peripheral blood and decreased to 290/ul promptly when Gal-9 levels increased at day 1 (Fig. 2). Furthermore, he had a fever 3 days after receiving mogatherapy, and the cytomegalovirus (CMV) antigen was detected in his blood on day 7 of treatment. The CMV infection was successfully treated by ganciclovir. After the fourth course of mogatherapy, the recurrence of fever was noted, and Mycobacterium intracellulare was detected in his sputum; he was diagnosed as having nontuberculous mycobacterial pneumonia associated with the recurrence of CMV. Further mogatherapy was ineffective, and the increase in β-D-glucan and galactomannan levels as well as chest radiography findings indicated that he also had an Aspergillus infection (day 84). Despite treatment, the recurrence of CMV infection occurred, which resulted in death (day 109). Examination of the clinical data for this patient indicated an increased CRP level and decreased LDH level from day 0 to day 8 of the first course of mogatherapy (Fig. 5).

Discussion
We previously reported increased Gal-9 levels in both acute infections and allergic disorders (Chagan-Yasutan et al. 2009, 2010, 2013; Saitoh et al. 2012; Dembele et al. 2016). Similarly, in the current study, it is noteworthy that the Gal-9 level was markedly increased in patients with ATL/ATLL before chemotherapy (mean, 1,435 pg/mL). After chemotherapy, the Gal-9 level substantially decreased (mean, 117 pg/mL), and this decrease was seemingly associated with the sIL-2R level, which is a marker of tumor burden (Yasuda et al. 1988), indicating that Gal-9 also reflects tumor burden. Immunohistochemical staining of several samples from patients with ATL/ATLL also indicated that most samples stained positive for Gal-9 (unpublished observation). As far as we know, this is the first study to report increased Gal-9 levels in the plasma of patients with ATL/ATLL. Gal-9 is involved in the induction of an immunosuppressive environment, because it induces Treg cells (Seki et al. 2008). It is noteworthy that CD4T cells expressing Gal-9 on the cell surface secrete Gal-9 upon T-cell receptor (TCR) stimulation (Oomizu et al. 2012). We previously proposed that stimulation of the TCR/CD3 complex, represented by a low density of the CD3 antigen, is a unique feature of ATL/ATLL cells (Suzushima et al. 1991). A recent integrated molecular study of the ATL/ATLL genome also showed frequent alteration of TCR-nuclear factor κB signaling, which may suggest stimulation of ATL/ATLL cells through the TCR (Kataoka et al. 2015). Gal-9 shows apoptotic activity toward tumor cells or T cells (Fujihara et al. 2013), and it should be studied whether Gal-9 has an apoptotic effect on fresh ATL/ATLL cells.
In contrast to chemotherapy, an increase in plasma Gal-9 levels was observed in three patients (case nos. 1, 3, and 5) after mogatherapy. Two of these patients had skin eruption as adverse effect (case nos. 1 and 5). In these two cases, an increment in the Gal-9 level was found to be closely related to the occurrence of skin eruptions. Furthermore, the increase in Gal-9 levels was not due to the recurrence of ATL/ATLL cells, because the levels of sIL-2R remained low and immunohistochemical analysis suggested the synthesis of Gal-9 by infiltrating CD8 cells. We previously reported the increase in the Gal-9 level in an insulin allergy patient who also had a skin rash and generalized itching (Chagan-Yasutan et al. 2010). Accordingly, the Gal-9 level can increase in adverse drug phenomena, though the elevations were relatively small due to the size of the lesion. In case no. 3, the levels of Gal-9, sIL-2R, IL-10, and TNF-α increased dramatically after mogatherapy though the percentage of ATL cells decreased. Mogatherapy clears tumor cells; however, aggressive immune activation and skin eruptions can occur owing to the suppression of Treg cells in vivo (Inagaki et al. 2006). Recently, the induction of CMV in two of 14 patients with ATL/ATLL treated with mogatherapy has been reported (Kawano et al. 2016). A recent retrospective study from Japan also reported that pre-transplant mogatherapy increases the risk of severe and steroid-refractory graft-versus-host disease (GVHD), which leads to increases in non-relapse mortality and the overall mortality. It was proposed that mogatherapy depletes Treg cells for at least a few months, which may increase the risk of GVHD after allo-hematopoietic stem cell transplantation (Fuji and Shindo 2016).
Therefore, it is possible that fatal OIs in case no. 3 could have been caused by an adverse effect of mogatherapy. The decrease of ATL cells associated with the rise of Gal-9 indicated that Gal-9 is not derived from ATL cells. The clinical profile resembles immune reconstruction inflammatory syndrome (IRIS), which is seen in patients with AIDS receiving antiretroviral therapy, though IRIS occurs in highly heterogeneous conditions and there is still no definitive diagnostic test for this complication (Walker et al. 2015). Recently, a patient with ATL/ATLL with complicated infections, including gram-negative bacterial sepsis, CMV antigenemia, and aspergillosis, after mogatherapy has been reported (Tamaki et al. 2015). In addition, it is also possible that worsening of ATL occur after immune-mediated adverse effect, because ATL cells are also derived from activated T cells and such complicated interaction should be carefully studied in future since low number of patients were enrolled in the study.
Taken together, we suggest that Gal-9 may serve as a marker for tumor burden before treatment and a marker for immune mediated adverse reactions after treatment. Recently, various effective biological agents have been developed for intractable diseases, such as autoimmune diseases and cancer; however, the introduction of these agents has also been found to be associated with IRIS or immune-related adverse events (Gupta et al. 2015). More studies on the prognostic potential of inflammatory markers, including Gal-9, would be helpful to determine whether these markers can predict patients’ clinical outcomes.
Acknowledgments
This study was supported by a grant from the Ministry of Education, Culture, Sports, Science and Technology, Japan for the Joint Research Program of the Research Center for Zoonosis Control, Hokkaido University and Japan Society for the Promotion of Science (KAKEN grant number: JP26257506). This research was also supported by the Research Program on Emerging and Re-emerging Infectious Diseases from Japan Agency for Medical Research and Development.
Conflict of Interest
The authors declare no conflict of interest.
References
-
Anderson,
A.C.,
Joller,
N. &
Kuchroo,
V.K.
(2016) Lag-3, Tim-3, and TIGIT: Co-inhibitory Receptors with Specialized Functions in Immune Regulation. Immunity, 44, 989-1004.
-
Chagan-Yasutan,
H.,
Saitoh,
H.,
Ashino,
Y.,
Arikawa,
T.,
Hirashima,
M.,
Li,
S.,
Usuzawa,
M.,
Oguma,
S.,
Telan,
E.F.O.,
Obi,
C.L. &
Hattori,
T.
(2009) Persistent elevation of plasma osteopontin levels in HIV patients despite highly active antiretroviral therapy. Tohoku J. Exp. Med., 218, 285-292.
-
Chagan-Yasutan,
H.,
Shiratori,
B.,
Siddiqi,
U.R.,
Saitoh,
H.,
Ashino,
Y.,
Arikawa,
T.,
Hirashima,
M. &
Hattori,
T.
(2010) The increase of plasma galectin-9 in a patient with insulin allergy: a case report. Clin. Mol. Allergy, 8, 12.
-
Chagan-Yasutan,
H.,
Ndhlovu,
L.C.,
Lacuesta,
T.L.,
Kubo,
T.,
Leano,
P.S.,
Niki,
T.,
Oguma,
S.,
Morita,
K.,
Chew,
G.M.,
Barbour,
J.D.,
Telan,
E.F.,
Hirashima,
M.,
Hattori,
T. &
Dimaano,
E.M.
(2013) Galectin-9 plasma levels reflect adverse hematological and immunological features in acute dengue virus infection. J. Clin. Virol., 58, 635-640.
-
Chagan-Yasutan,
H.,
Tsukasaki,
K.,
Takahashi,
Y.,
Oguma,
S.,
Harigae,
H.,
Ishii,
N.,
Zhang,
J.,
Fukumoto,
M. &
Hattori,
T.
(2011) Involvement of osteopontin and its signaling molecule CD44 in clinicopathological features of adult T cell leukemia. Leuk. Res., 35, 1484-1490.
-
Dardalhon,
V.,
Anderson,
A.C.,
Karman,
J.,
Apetoh,
L.,
Chandwaskar,
R.,
Lee,
D.H.,
Cornejo,
M.,
Nishi,
N.,
Yamauchi,
A.,
Quintana,
F.J.,
Sobel,
R.A.,
Hirashima,
M. &
Kuchroo,
V.K.
(2010) Tim-3/galectin-9 pathway: regulation of Th1 immunity through promotion of CD11b+Ly-6G+ myeloid cells. J. Immunol., 185, 1383-1392.
-
Dembele,
B.P.,
Chagan-Yasutan,
H.,
Niki,
T.,
Ashino,
Y.,
Tangpukdee,
N.,
Shinichi,
E.,
Krudsood,
S.,
Kano,
S. &
Hattori,
T.
(2016) Plasma levels of Galectin-9 reflect disease severity in malaria infection. Malar. J., 15, 403.
-
Fuji,
S. &
Shindo,
T.
(2016) Friend or foe? Mogamulizumab in allogeneic hematopoietic stem cell transplantation for adult T-cell leukemia/lymphoma. Stem Cell Investig., 3, 70.
-
Fujihara,
S.,
Mori,
H.,
Kobara,
H.,
Rafiq,
K.,
Niki,
T.,
Hirashima,
M. &
Masaki,
T.
(2013) Galectin-9 in cancer therapy. Recent Pat. Endocr. Metab. Immune Drug Discov., 7, 130-137.
-
Gupta,
M.,
Jafri,
K.,
Sharim,
R.,
Silverman,
S.,
Sindher,
S.B.,
Shahane,
A. &
Kwan,
M.
(2015) Immune reconstitution inflammatory syndrome associated with biologic therapy. Curr. Allergy Asthma Rep., 15, 499.
-
Hattori,
T.,
Asou,
N.,
Suzushima,
H.,
Takatsuki,
K.,
Tanaka,
K.,
Naito,
K.,
Natori,
H. &
Oizumi,
K.
(1991) Leukaemia of novel gastrointestinal T-lymphocyte population infected with HTLV-I. Lancet, 337, 76-77.
-
Hattori,
T.,
Uchiyama,
T.,
Toibana,
T.,
Takatsuki,
K. &
Uchino,
H.
(1981) Surface phenotype of Japanese adult T-cell leukemia cells characterized by monoclonal antibodies. Blood, 58, 645-647.
-
Ikeda,
K.,
Oka,
M.,
Yamada,
Y.,
Soda,
H.,
Fukuda,
M.,
Kinoshita,
A.,
Tsukamoto,
K.,
Noguchi,
Y.,
Isomoto,
H.,
Takeshima,
F.,
Murase,
K.,
Kamihira,
S.,
Tomonaga,
M. &
Kohno,
S.
(1999) Adult T-cell leukemia cells over-express the multidrug-resistance-protein (MRP) and lung-resistance-protein (LRP) genes. Int. J. Cancer, 82, 599-604.
-
Inagaki,
A.,
Ishida,
T.,
Ishii,
T.,
Komatsu,
H.,
Iida,
S.,
Ding,
J.,
Yonekura,
K.,
Takeuchi,
S.,
Takatsuka,
Y.,
Utsunomiya,
A. &
Ueda,
R.
(2006) Clinical significance of serum Th1-, Th2- and regulatory T cells-associated cytokines in adult T-cell leukemia/lymphoma: high interleukin-5 and -10 levels are significant unfavorable prognostic factors. Int. J. Cancer, 118, 3054-3061.
-
Ishida,
T.,
Ito,
A.,
Sato,
F.,
Kusumoto,
S.,
Iida,
S.,
Inagaki,
H.,
Morita,
A.,
Akinaga,
S. &
Ueda,
R.
(2013) Stevens-Johnson Syndrome associated with mogamulizumab treatment of adult T-cell leukemia / lymphoma. Cancer Sci., 104, 647-650.
-
Ishida,
T.,
Joh,
T.,
Uike,
N.,
Yamamoto,
K.,
Utsunomiya,
A.,
Yoshida,
S.,
Saburi,
Y.,
Miyamoto,
T.,
Takemoto,
S.,
Suzushima,
H.,
Tsukasaki,
K.,
Nosaka,
K.,
Fujiwara,
H.,
Ishitsuka,
K.,
Inagaki,
H., et al.
(2012) Defucosylated anti-CCR4 monoclonal antibody (KW-0761) for relapsed adult T-cell leukemia-lymphoma: a multicenter phase II study. J. Clin. Oncol., 30, 837-842.
-
Ishida,
T. &
Ueda,
R.
(2011) Immunopathogenesis of lymphoma: focus on CCR4. Cancer Sci., 102, 44-50.
-
Ishida,
T.,
Utsunomiya,
A.,
Iida,
S.,
Inagaki,
H.,
Takatsuka,
Y.,
Kusumoto,
S.,
Takeuchi,
G.,
Shimizu,
S.,
Ito,
M.,
Komatsu,
H.,
Wakita,
A.,
Eimoto,
T.,
Matsushima,
K. &
Ueda,
R.
(2003) Clinical significance of CCR4 expression in adult T-cell leukemia/lymphoma: its close association with skin involvement and unfavorable outcome. Clin. Cancer Res., 9, 3625-3634.
-
Karube,
K.,
Ohshima,
K.,
Tsuchiya,
T.,
Yamaguchi,
T.,
Kawano,
R.,
Suzumiya,
J.,
Utsunomiya,
A.,
Harada,
M. &
Kikuchi,
M.
(2004) Expression of FoxP3, a key molecule in CD4CD25 regulatory T cells, in adult T-cell leukaemia/lymphoma cells. Br. J. Haematol., 126, 81-84.
-
Kataoka,
K.,
Nagata,
Y.,
Kitanaka,
A.,
Shiraishi,
Y.,
Shimamura,
T.,
Yasunaga,
J.,
Totoki,
Y.,
Chiba,
K.,
Sato-Otsubo,
A.,
Nagae,
G.,
Ishii,
R.,
Muto,
S.,
Kotani,
S.,
Wattani,
Y.,
Takeda,
J., et al.
(2015) Integrated molecular analysis of adult T cell leukemia/lymphoma. Nat. Genet., 47, 1304-1315.
-
Kawano,
N.,
Kuriyama,
T.,
Sonoda,
K.H.,
Yoshida,
S.,
Yamashita,
K.,
Ochiai,
H.,
Shimoda,
K.,
Ishikawa,
F.,
Ueda,
A. &
Kikuchi,
I.
(2016) Clinical Impact of a Humanized CCR4 Antibody (Mogamulizumab) in 14 Patients with Aggressive Adult T-cell Leukemia-lymphoma Treated at a Single Institution During a Three-year Period (2012-2014). Intern. Med., 55, 1439-1445.
-
Kohno,
T.,
Yamada,
Y.,
Akamatsu,
N.,
Kamihira,
S.,
Imaizumi,
Y.,
Tomonaga,
M. &
Matsuyama,
T.
(2005) Possible origin of adult T-cell leukemia/lymphoma cells from human T lymphotropic virus type-1-infected regulatory T cells. Cancer Sci., 96, 527-533.
-
Monney,
L.,
Sabatos,
C.A.,
Gaglia,
J.L.,
Ryu,
A.,
Waldner,
H.,
Chernova,
T.,
Manning,
S.,
Greenfield,
E.A.,
Coyle,
A.J.,
Sobel,
R.A.,
Freeman,
G.J. &
Kuchroo,
V.K.
(2002) Th1-specific cell surface protein Tim-3 regulates macrophage activation and severity of an autoimmune disease. Nature, 415, 536-541.
-
Mori,
N. &
Prager,
D.
(1998) Interleukin-10 gene expression and adult T-cell leukemia. Leuk. Lymphoma, 29, 239-248.
-
Oomizu,
S.,
Arikawa,
T.,
Niki,
T.,
Kadowaki,
T.,
Ueno,
M.,
Nishi,
N.,
Yamauchi,
A.,
Hattori,
T.,
Masaki,
T. &
Hirashima,
M.
(2012) Cell surface galectin-9 expressing Th cells regulate Th17 and Foxp3+ Treg development by galectin-9 secretion. PLoS One, 7, e48574.
-
Roncador,
G.,
Garcia,
J.F.,
Garcia,
J.F.,
Maestre,
L.,
Lucas,
E.,
Menarguez,
J.,
Ohshima,
K.,
Nakamura,
S.,
Banham,
A.H. &
Piris,
M.A.
(2005) FOXP3, a selective marker for a subset of adult T-cell leukaemia/lymphoma. Leukemia, 19, 2247-2253.
-
Saitoh,
H.,
Ashino,
Y.,
Chagan-Yasutan,
H.,
Niki,
T.,
Hirashima,
M. &
Hattori,
T.
(2012) Rapid decrease of plasma galectin-9 levels in patients with acute HIV infection after therapy. Tohoku J. Exp. Med., 228, 157-161.
-
Seki,
M.,
Oomizu,
S.,
Sakata,
K.M.,
Sakata,
A.,
Arikawa,
T.,
Watanabe,
K.,
Ito,
K.,
Takeshita,
K.,
Niki,
T.,
Saita,
N.,
Nishi,
N.,
Yamauchi,
A.,
Katoh,
S.,
Matsukawa,
A.,
Kuchroo,
V. &
Hirashima,
M.
(2008) Galectin-9 suppresses the generation of Th17, promotes the induction of regulatory T cells, and regulates experimental autoimmune arthritis. Clin. Immunol., 127, 78-88.
-
Shimoyama,
M.
(1991) Diagnostic criteria and classification of clinical subtypes of adult T-cell leukaemia-lymphoma. A report from the Lymphoma Study Group (1984-87). Br. J. Haematol., 79, 428-437.
-
Suzushima,
H.,
Hattori,
T.,
Asou,
N.,
Wang,
J.X.,
Nishikawa,
K.,
Okubo,
T.,
Anderson,
P. &
Takatsuki,
K.
(1991) Discordant gene and surface expression of the T-cell receptor/CD3 complex in adult T-cell leukemia cells. Cancer Res., 51, 6084-6088.
-
Tamaki,
K.,
Kinjo,
T.,
Aoyama,
H.,
Tomoyose,
T.,
Nakachi,
S.,
Hanashiro,
T.,
Shimabukuro,
N.,
Tedokon,
I.,
Morichika,
K.,
Nishi,
Y.,
Taira,
N.,
Fujita,
J.,
Yoshimi,
N.,
Fukushima,
T. &
Masuzaki,
H.
(2015) Fatal pneumonia and viremia due to human parainfluenza virus type 1 in a patient with adult T-cell leukemia-lymphoma treated with mogamulizumab. J. Infect. Chemother., 21, 820-823.
-
Tsukasaki,
K.,
Utsunomiya,
A.,
Fukuda,
H.,
Shibata,
T.,
Fukushima,
T.,
Takatsuka,
Y.,
Ikeda,
S.,
Masuda,
M.,
Nagoshi,
H.,
Ueda,
R.,
Tamura,
K.,
Sano,
M.,
Momita,
S.,
Yamaguchi,
K.,
Kawano,
F., et al.
(2007) VCAP-AMP-VECP compared with biweekly CHOP for adult T-cell leukemia-lymphoma: Japan Clinical Oncology Group Study JCOG9801. J. Clin. Oncol., 25, 5458-5464.
-
Uchiyama,
T.,
Yodoi,
J.,
Sagawa,
K.,
Takatsuki,
K. &
Uchino,
H.
(1977) Adult T-cell leukemia: clinical and hematologic features of 16 cases. Blood, 50, 481-492.
-
Walker,
N.F.,
Scriven,
J.,
Meintjes,
G. &
Wilkinson,
R.J.
(2015) Immune reconstitution inflammatory syndrome in HIV-infected patients. HIV AIDS (Auckl.), 7, 49-64.
-
Wang,
F.,
Wan,
L.,
Zhang,
C.,
Zheng,
X.,
Li,
J. &
Chen,
Z.K.
(2009) Tim-3-Galectin-9 pathway involves the suppression induced by CD4+CD25+ regulatory T cells. Immunobiology, 214, 342-349.
-
Yamada,
Y.,
Ohmoto,
Y.,
Hata,
T.,
Yamamura,
M.,
Murata,
K.,
Tsukasaki,
K.,
Kohno,
T.,
Chen,
Y.,
Kamihira,
S. &
Tomonaga,
M.
(1996) Features of the Cytokines Secreted by Adult T Cell Leukemia (ATL) Cells. Leuk. Lymphoma, 21, 443-447.
-
Yamamura,
Y.,
Hattori,
T.,
Obaru,
K.,
Sakai,
K.,
Asou,
N.,
Takatsuki,
K.,
Ohmoto,
Y.,
Nomiyama,
H. &
Shimada,
K.
(1989) Synthesis of a novel cytokine and its gene (LD78) expressions in hematopoietic fresh tumor cells and cell lines. J. Clin. Invest., 84, 1707-1712.
-
Yasuda,
N.,
Lai,
P.K.,
Ip,
S.H.,
Kung,
P.C.,
Hinuma,
Y.,
Matsuoka,
M.,
Hattori,
T.,
Takatsuki,
K. &
Purtilo,
D.T.
(1988) Soluble interleukin 2 receptors in sera of Japanese patients with adult T cell leukemia mark activity of disease. Blood, 71, 1021-1026.
-
Yoshie,
O.,
Fujisawa,
R.,
Nakayama,
T.,
Harasawa,
H.,
Tago,
H.,
Izawa,
D.,
Hieshima,
K.,
Tatsumi,
Y.,
Matsushima,
K.,
Hasegawa,
H.,
Kanamaru,
A.,
Kamihira,
S. &
Yamada,
Y.
(2002) Frequent expression of CCR4 in adult T-cell leukemia and human T-cell leukemia virus type 1-transformed T cells. Blood, 99, 1505-1511.
-
Zhu,
C.,
Anderson,
A.C.,
Schubart,
A.,
Xiong,
H.,
Imitola,
J.,
Khoury,
S.J.,
Zheng,
X.X.,
Strom,
T.B. &
Kuchroo,
V.K.
(2005) The Tim-3 ligand galectin-9 negatively regulates T helper type 1 immunity. Nat. Immunol., 6, 1245-1252.