Abstract
Insufficient hemoglobin and depression share several symptoms and often occur in the same patients. Here, we sought to clarify their relationship by investigating two indices of oxygenation at the tissue level: mean corpuscular hemoglobin concentration (MCHC) and hemoglobin level. We hypothesized that MCHC would be more informative than hemoglobin levels. This prospective, longitudinal, community-based study included 337 participants (108 men and 229 women; age range, 38-87 years) who received evaluations of MCHC, hemoglobin levels and depressive symptom scores (DSS) during baseline and follow-up examinations, which were performed in 2008-2011 and 2010-2012, respectively. MCHC and hemoglobin levels were measured as part of complete blood counts, while DSS was evaluated using the Beck Depression Inventory. Associations were analyzed using linear regression. We found a statistically significant association between baseline MCHC and follow-up DSS (β = −0.69, p = 0.026), which remained statistically significant after controlling for potential confounders (β = −0.71, p = 0.011). Further, when we analyzed the relationship separately for men and women, we observed that it remained stable for women before (β = −1.00, p = 0.014) and after (β = −1.09, p = 0.003) adjusting for confounders. The stable association indicates that MCHC may be superior to hemoglobin level as a prognostic factor for future depressive symptoms in women. MCHC is easy to measure and low MCHC is usually treatable. Therefore, screening and intervention efforts could be targeted at women with low MCHC, who appear to have elevated risks of developing depressive symptoms.
Introduction
Depression was the fourth leading contributor to the global burden of disease in 2002, and is projected to be the second and first leading contributor by 2030 globally and among high-income countries, respectively (Mathers and Loncar 2006). In the United States, the prevalence of major depressive episode diagnosed by Diagnostic and Statistical Manual of Mental Disorders, 4th Edition (DSM-IV) among adults (more than 18 years old) in 2013-2014 was 6.6% (Center for Behavioral Health Statistics and Quality 2015). The estimated prevalence of depressive symptoms, according to data from National Health and Nutrition Examination Survey (NHANES) during 2005-2010, among adults (more than 18 years old) was 25.6% (Wittayanukorn et al. 2014). Among Korean adults (18 to 64 years of age), the prevalence of major depressive disorder sharply increased from 4.0% in 2001 to 6.7% in 2011 (Ministry of Health and Welfare Republic of Korea Division of Mental Health Policy 2012). Depression is the leading cause of disability in the world (World Health Organization 2013), in part because of suicide attempts, and depression-related suicides have increased in Korea in recent decades (National Statistical Office of Korea Vital Statistics Division 2012). Due to its social burden, depression is now a major public health problem (Beardslee et al. 2013). Despite its significance, however, there is a lack of epidemiologic studies on depression risk factors and the prevention of depression in community settings in the Asia-Pacific region.
Conditions involving hemoglobin insufficiency, including anemia, have similar symptoms as depression, such as fatigue, weakness, helplessness, melancholy, and impaired quality of life (Krishnan et al. 2006; Hamer and Molloy 2009; Umegaki et al. 2011; Steptoe et al. 2012). In Korea, the prevalence of anemia in 2011 was 2.4% among men and 12.8% among women (Korean Centers for Disease Control and Prevention 2013). Despite the alarming prevalence of hemoglobin insufficiency and depression and their overlapping symptomatology (Umegaki et al. 2011), few studies have addressed the association between these two conditions (Umegaki et al. 2011). Furthermore, previous studies have utilized only cross-sectional (Onder et al. 2005; Umegaki et al. 2011; Chen et al. 2012; Stewart and Hirani 2012) or relatively short longitudinal analysis (e.g., 1-month duration) (Steptoe et al. 2012) restricted to the elderly (Onder et al. 2005; Umegaki et al. 2011; Chen et al. 2012; Stewart and Hirani 2012) or specific groups of patients (Steptoe et al. 2012). These studies showed that lower hemoglobin is significantly associated with depressive symptoms; however, their external validity was very limited. Although hemoglobin insufficiency could be a useful risk factor for depression symptom in clinical practice, the association between hemoglobin level and depressive symptoms remains underexplored.
Mean corpuscular hemoglobin concentration (MCHC) is a measure of the concentration of hemoglobin per volume of packed red blood cells (RBCs). If reduced hemoglobin synthesis rate is faster than reduced synthetic RBC volume, then MCHC level is decreased. We hypothesize that MCHC may be a better index of oxygenation at the tissue level than total systemic hemoglobin concentration, because it provides information on the hemoglobin concentration of each RBC. A conceptual framework outlining potential pathways between MCHC and depressive symptoms is described in Fig. 1. If MCHC is lower for a long period, we assume that oxygenation of brain cells would be reduced, and these micro-hypoxic brain cells may affect depressive symptoms. Therefore, this study aimed to analyze the longitudinal association between MCHC and depressive symptom scores in a community based prospective cohort study among relatively healthy participants over a 2.2-year mean follow-up period. Additionally, we analyzed the association between hemoglobin concentration and depressive symptom score in comparison to MCHC results.

Methods
Study participants
We conducted a longitudinal analysis of data collected in the prospective Korean Genome and Epidemiologic Study (KoGES)-Kangwha cohort study, which started in 2006 and involves community dwellers on the Kangwha Island, Incheon, South Korea. Detailed methods for the KoGES-Kangwha study are reported elsewhere (Lee et al. 2012). Because the Korean version of the Beck Depression Inventory (K-BDI) has been available to the study since 2008, we included participants who completed a baseline examination between 2008 and 2011 and a follow-up health examination between 2010 and 2012. The K-BDI was administered twice-once at baseline and once at follow-up. Out of a total of 338 participants, one participant was excluded due to the use of depression medication at baseline, resulting in 337 (108 men, 229 women) participants who were between the ages of 38 and 87 years, being included in this study. The study was carried out at Department of Preventive Medicine, Yonsei University College of Medicine, Seoul, Korea. All participants signed an informed consent form, and the study protocol was approved by the Institutional Review Board of Yonsei University Health System (4-2010-0272) and monitored by the Human Research Protection Center of Severance Hospital, Yonsei University Health System. This study has been carried out in accordance with The Code of Ethics of the World Medical Association (Declaration of Helsinki) for research involving humans.
Measurements
Depressive symptoms: Trained research interviewers obtained participant information, including personal history, family history, and health behaviors, using a standardized questionnaire. Depressive symptoms were assessed using the K-BDI, which has been demonstrated to be a valid and reliable screening tool for depressive symptoms (Beck et al. 1961; Hahn et al. 1986; Lee and Song 1991). The K-BDI is a 21-item measure that evaluates the emotional, cognitive, and motivational aspects of depression. Each of the 21 K-BDI items was scored from 0 to 3 points, which was summed to give a final score between 0 and 63. K-BDI score was used as a continuous variable.
Biomarkers: MCHC and hemoglobin concentrations were obtained from a standard complete blood count (CBC) blood panel. Blood samples were collected from the antecubital vein after at least eight hours of fasting and were sent to a centralized research laboratory for analysis. CBC, fasting glucose, total cholesterol, high-density lipoprotein cholesterol (HDL), and triglyceride levels were measured by colorimetric and impedance methods using automatic analyzers (ADVIA 120, Siemens medical Sol, USA). Diabetes mellitus was defined as fasting glucose ≥ 126 mg/dL or current use of diabetic medication. Dyslipidemia was defined as total cholesterol ≥ 240 mg/dL or triglyceride ≥ 200 mg/dL or low-density lipoprotein (LDL) ≥ 160 mg/dL or HDL ≤ 40 mg/dL or current use of lipid-lowering medication.
Covariates: Participants were required to refrain from smoking or ingesting caffeine for eight hours preceding the health examination. Prior to resting heart rate and blood pressure measurements, participants were asked to sit and rest in a room for at least five minutes. With participants seated, an appropriately sized cuff was applied snugly around the upper right arm at the heart level. Heart rate and blood pressure were measured twice with at least a 5-minute interval between measurements using an automatic sphygmomanometer (Dinamap 1846 SX/P; GE Healthcare, USA). If the difference between the first and second measurements was greater than 10 mmHg, additional measurements were taken. The average of the last two measurements was used for analysis. Hypertension was defined as average systolic blood pressure ≥ 140 mmHg, or average diastolic blood pressure ≥ 90 mmHg, or current blood pressure medication use. Standing height was measured to the nearest 0.1 cm on a stadiometer (SECA763, SECA GMBH, Germany). Body weight was measured to the nearest 0.1 kg on a digital scale with participants wearing underwear and examination gowns. Body mass index (BMI) was calculated as weight (kg) divided by height (m2).
Marriage status was utilized as a categorical variable: never married, currently married, or divorced/separated/widowed. Menopause was defined as absence of menorrhea during recent 12 months or previous history of total hysterectomy. Cigarette smoking was utilized as categorical variable as never smoker (less than 100 cigarettes during lifetime), former smoker, and current smoker. Alcohol drinking also utilized as categorical variable as never drinker, former drinker, and current drinker. Information on chronic disease history, including cardiovascular disease diagnosis, and cancer diagnosis were collected by interview. Medication histories, such as aspirin intake were obtained.
Statistical analysis
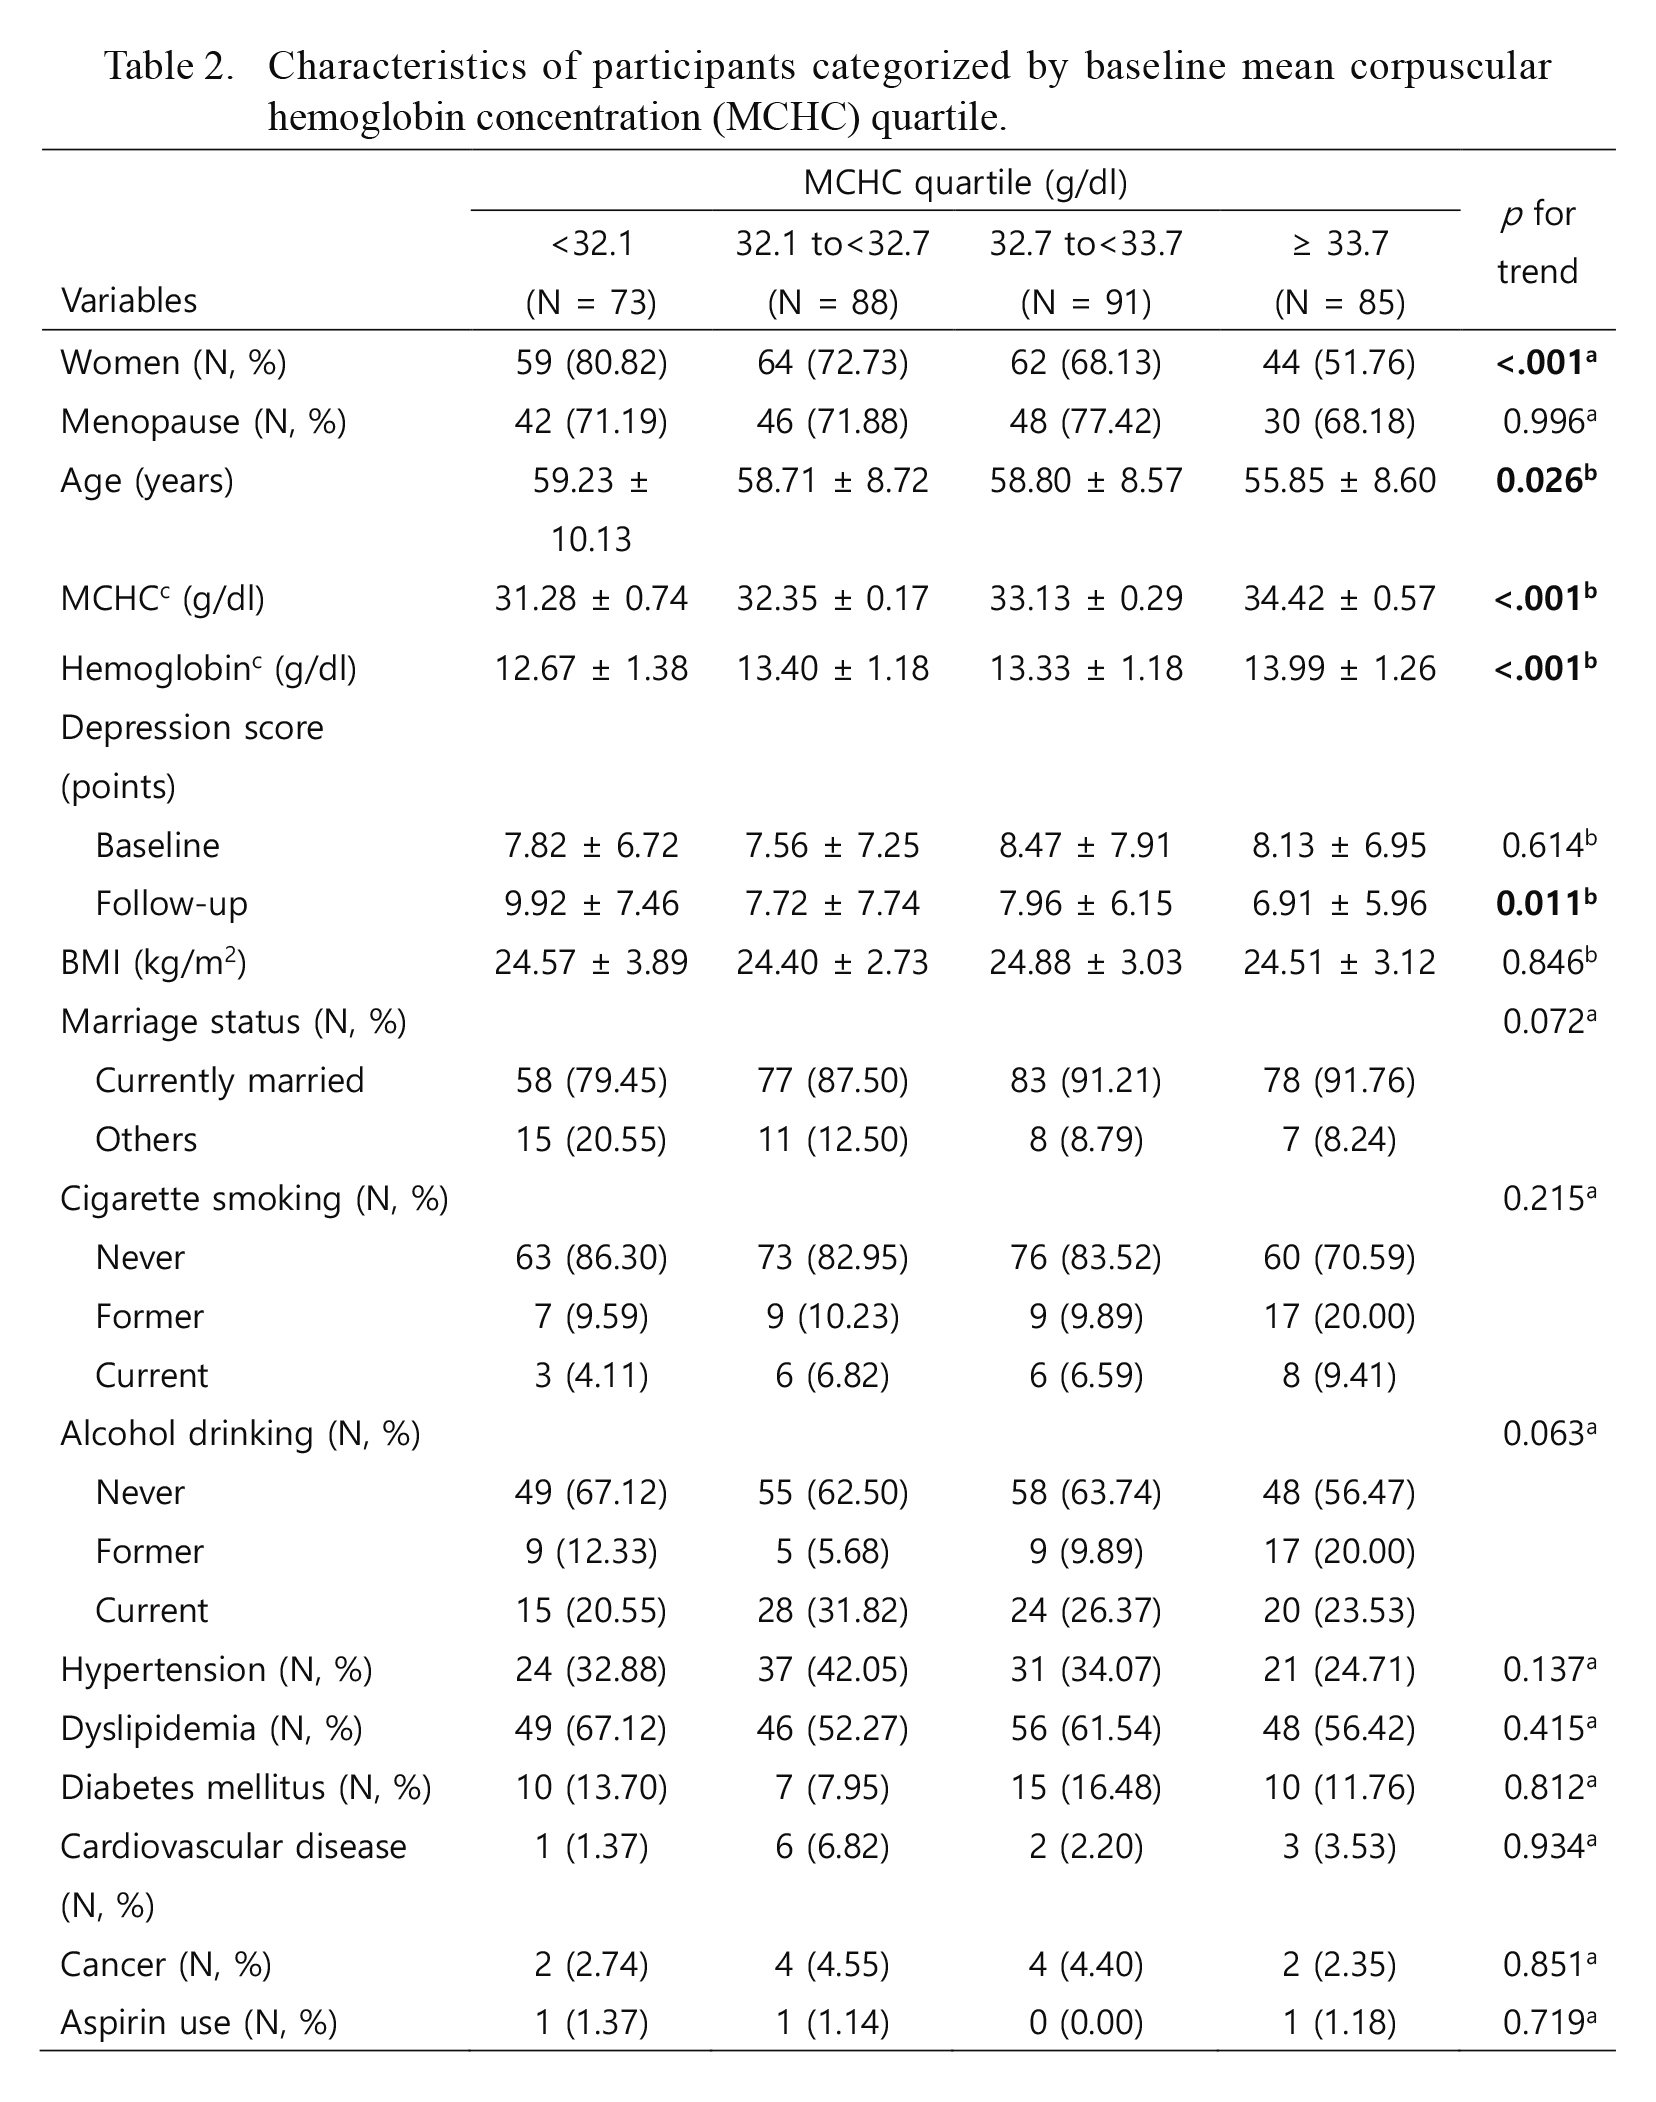
T-tests, Chi-square tests, and Fisher’s exact tests were used for testing sex differences of each variable (Table 1). Trends between variable means and MCHC quartiles were tested using trend tests (Table 2). Correlations between variables and follow-up depressive symptom score were assessed by Pearson’s correlation coefficients (Table 3). Multiple linear regression analysis was used to evaluate the associations between baseline MCHC, hemoglobin, and follow-up depressive symptom scores (Tables 4 and 5); unadjusted and adjusted β coefficients, standard error, and p values were calculated. In the final adjusted model, we controlled for baseline depressive symptom scores, age, sex, BMI, menopause status, cigarette smoking, alcohol drinking, marriage status, hypertension, dyslipidemia, diabetes mellitus, medical history of cardiovascular disease, medical history of cancer, and aspirin intake. As hemoglobin concentration depends on age and sex (Weiskopf et al. 2005), we included age and sex in the model. In addition, we included smoking status, alcohol drinking, marriage status, chronic underlying diseases, aspirin intake, menopause, and BMI because they could influence hemoglobin and depression. We also included baseline depressive symptom scores to consider baseline depression status.
All statistical analyses were performed using SAS version 9.2.0 (SAS Institute, Cary, NC, USA). A two-tailed p value of < 0.05 was considered statistically significant.
Results
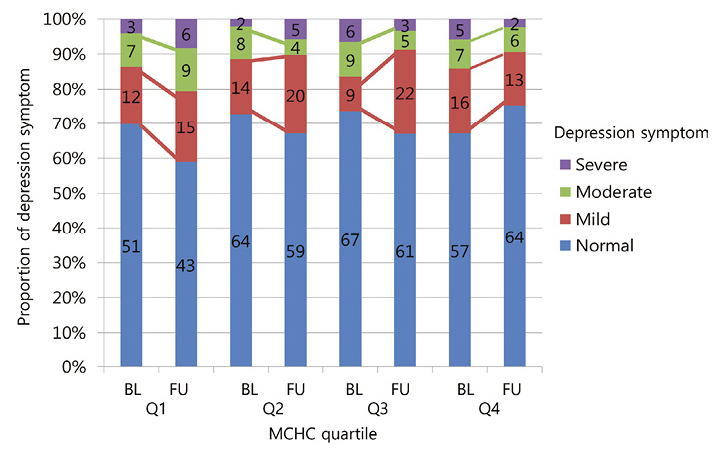
Changes in depression symptom categories during study periods stratified with MCHC quartiles are shown in Fig. 2.
Differences in baseline MCHC and hemoglobin concentrations were shown between men and women (Table 1). Women had lower baseline MCHC and hemoglobin levels compared to men. Characteristics of study participants categorized by baseline MCHC quartile are shown in Table 2. Sex, age, and depressive symptom score at follow-up showed significant linear trends. Correlations between participant characteristics and follow-up depressive symptom scores are shown in Table 3. Among women, follow-up depressive symptom scores were positively correlated with baseline MCHC, baseline hemoglobin, and baseline depressive symptom score. Among men, however, only follow-up depressive symptom score at follow-up was positively correlated with baseline depressive symptom scores. Associations between baseline MCHC and follow-up depressive symptom score are shown in Table 4. In the total population, there was a significant inverse association between baseline MCHC and follow-up depressive symptom score (β = −0.69, p = 0.026). This association remained significant in the final model after controlling for baseline depressive symptom score, age, sex, BMI, menopause status, cigarette smoking, alcohol drinking, marriage status, hypertension, dyslipidemia, diabetes mellitus, medical history of cardiovascular disease, medical history of cancer, and aspirin intake (β = −0.71, p = 0.011). Among women, this association was stable before (β = −1.00, p = 0.014) and after (β = −1.09, p = 0.003) adjusting for confounding factors and covariates. In contrast, this association was not significant among men (β = −0.03, p = 0.954). Cross-sectional analysis revealed no significant association between baseline MCHC and baseline depressive symptom score nor between follow up MCHC and follow up depressive symptom score (data were not shown). Associations between baseline Hb and follow-up depressive symptom score are shown in Table 5. There was a significant inverse association between baseline hemoglobin and follow-up depressive symptom score in women (β = −1.14, p = 0.039). However, after adjustment for confounders the association was no longer significant (β = −0.87, p = 0.081).
Discussion
We found that baseline MCHC was significantly associated with future depressive symptom scores in women. Cross-sectional analysis, however, revealed no significant association between baseline MCHC and baseline depressive symptom score. We also found that MCHC is a better biomarker than hemoglobin for future prediction of depression risk.
Prior studies about hemoglobin and depression have been conducted; However, the study populations involved mostly the elderly (Onder et al. 2005; Lucca et al. 2008; Hamer and Molloy 2009; Umegaki et al. 2011; Chen et al. 2012; Pan et al. 2012; Stewart and Hirani 2012) or patients with specific diseases such as acute coronary syndrome (Steptoe et al. 2012), beta-thalassemia (Keskek et al. 2013), postpartum (Corwin et al. 2003), stroke (Ormstad et al. 2012), and depression (Maes et al. 1996). Because previous studies were limited to specific populations, epidemiologic evidence for such a link in the general or a younger population is still inadequate. Most of these studies used a cross-sectional study design (Maes et al. 1996; Corwin et al. 2003; Onder et al. 2005; Lucca et al. 2008; Umegaki et al. 2011; Chen et al. 2012; Pan et al. 2012; Stewart and Hirani 2012; Keskek et al. 2013). There were only three prospective studies with follow-up length of 3 weeks (Steptoe et al. 2012), 12 to 18 months (Ormstad et al. 2012), and 2 years (Hamer and Molloy 2009). Moreover, longitudinal study results were lacking on this topic, with no longitudinal study available that targeted Asian-Pacific populations. Many studies have found significant an association between hemoglobin and depression (Maes et al. 1996; Hamer and Molloy 2009; Umegaki et al. 2011; Steptoe et al. 2012), but others have failed to show statistically significant findings. In men, there was no significant relationship between hemoglobin and depressive symptoms (Umegaki et al. 2011). Baseline hemoglobin values were not associated with depressive symptom scores after 2 years in elderly from the United Kingdom (Hamer and Molloy 2009). In stroke patients, hemoglobin levels were associated with depressive symptoms at both 12 months and 18 months following stroke, but hemoglobin levels were not associated with depressive symptoms 6 months later (Ormstad et al. 2012). In a study with an elderly population in Italy, mild anemia had a higher odds ratio of depression symptoms than those who did not have anemia (Lucca et al. 2008). However, the association failed to show statistical significance after adjustment for chronic disease status. This present study was started from an examination of these small inconsistencies. Considering a possible transportation pathway for oxygen, which encounters the blood brain barrier to reach the brain tissue, we hypotheses that MCHC may be a better index of oxygenation at the brain tissue level than total hemoglobin concentration, because it provides information on the hemoglobin concentration of each RBC (Fig. 1). No previous study has examined the association between MCHC and depressive symptom score. Among women in Table 4, the association between MCHC concentration and follow-up depression score was stable before (β = −1.00, p = 0.014) and after (β = −1.09, p = 0.003) adjusting for confounding factors and covariates. However, among women in Table 5, the association between hemoglobin concentration and follow-up depression score was significant before adjusting (β = −1.14, p = 0.039), but not after (β = −0.87, p = 0.081). This finding goes along with our hypothesis and suggests that MCHC may be a better biomarker for future depressive symptoms than hemoglobin.
Strengths
To our knowledge, our study is the first prospective study that investigated the association between MCHC and depressive symptoms as far as we know. Second, our study used both longitudinal approach (mean follow-up time was 2.20 years) and cross-sectional approach. This study adjusted for a baseline depressive symptoms score to demonstrate a clearer association between MCMH and future depressive symptoms. Third, this study suggests that MCHC may be a better biomarker for future depressive symptoms than hemoglobin. Fourth, our study population was comprised of middle to elder age spectrum. Fifth, our data were obtained from a well-established community-based cohort study that used standardized methodology for ascertaining MCHC and depressive symptom scores as well as relevant confounding factors.
A number of mechanisms may underlie the link between hemoglobin insufficiency and depression. One possible explanation is related to brain oxygen supply (Weiskopf et al. 2005). Because the brain is a major oxygen- and energy-consuming organ, it is sensitive to even mild hemoglobin insufficiency (Umegaki et al. 2011). A second explanation is related to micronutrients such as iron (Stewart and Hirani 2012) and vitamins (Pan et al. 2012) that are involved in hemoglobin insufficiency. Iron is implicated in dopamine function (Snyder and Connor 2009), which has clear potential relevance for mood disorders. Iron also plays a role in oxygenation of brain parenchyma and the synthesis of several neurotransmitters (Beard et al. 1993) that may be associated with depression. A third explanation is related to erythropoiesis by occult bleeding (Onder et al. 2005; Umegaki et al. 2011). Psychological distress may increase the risk of occult bleeding in the digestive tract (Peura 1987), and activated sympathetic tone may inhibit erythropoiesis (Maestroni 2000; Umegaki et al. 2011; Stewart and Hirani 2012). Also there is possibility that iron metabolism and erythron affect the prooxidant and antioxidant systems and proinflammatory cytokine levels, and induce depression (Rybka et al. 2013). Any or all of these factors could lead to chronically or repeatedly low levels of MCHC, which may in turn lead to the development of depression symptoms (Fig. 1).
Limitations
First, depressive symptom scores were only available since 2008 and using 1st follow up till 2012, therefore our study included small number of participants, with a mean follow-up time is 2.20 years. However, this marks the longest follow up duration on this subject to our knowledge. In particular, our study included a small number of men, particularly those who were hemoglobin insufficient or depressed according to K-BDI. However, a previous cross-sectional study of elderly Japanese individuals showed a sex difference that was similar to that found in the present study (Umegaki et al. 2011). Despite the small number of participants, we were still able to observe sex-different association, and we also expect future results due to the ongoing nature of this cohort study. Second, we did not explicitly determine the underlying cause of low MCHC. Further studies are needed to further investigate different types of anemia and low MCHC.
Conclusion
Our results suggest that lower MCHC is a risk factor for future depressive symptom. Fortunately, diagnosis of hemoglobin insufficiency is relatively simple, and appropriate treatments exist in most cases (e.g. iron supplement), suggesting that prevention of depression in a certain percentage of people may be possible. These findings suggest that screening and intervention efforts should target hemoglobin insufficient (low MCHC concentration) among women, although further investigations are required to establish cut-off levels for depression prevention.
Acknowledgments
Lee, J.M. thanks to Philip Greenland for scientific discussion. Lee, J.M. also thanks the All But Dissertation (ABD) trainee program, which is supported by a National Research Foundation of Korea Grant funded by the Korean Government, for covering U.S. boarding costs while this research was carried out.
Nadimpalli, S.B. thanks the T32 program, which is supported by a National, Heart, Lung, and Blood Institute of the National Institutes of Health under Award Number T32HL069771. The content is solely the responsibility of the authors and does not necessarily represent the official views of the National Institute of Health.
This study was supported by the grants from the Korea Centers for Disease Control and Prevention (2008-E71004-00, 2009-E71006-00, 2010-E71003-00, 2011-E71002-00, 2012-E71007-00). Korean CDC had no role in the design of this study, analysis of the data, in the writing of the manuscript, or in the decision to submit the manuscript for publication.
Author Contributions
Kim, H.C. and Suh, I. were responsible for designing the study and selecting study instruments. Lee, J.M. formulated research questions, collected data, and wrote the first draft of the paper. Kim, H.C. supervised the study. Lee, J.M. and Kim, H.C. analyzed the data. Nadimpalli, S.B., Yoon, J.H. and Mun, S.Y. contributed scientific discussion and improve manuscript.
Conflict of Interest
The authors declare no conflict of interests.
References
-
Beard,
J.L.,
Connor,
J.R. &
Jones,
B.C.
(1993) Iron in the brain. Nutr. Rev., 51, 157-170.
-
Beardslee,
W.R.,
Brent,
D.A.,
Weersing,
V.R.,
Clarke,
G.N.,
Porta,
G.,
Hollon,
S.D.,
Gladstone,
T.R.,
Gallop,
R.,
Lynch,
F.L.,
Iyengar,
S.,
DeBar,
L. &
Garber,
J.
(2013) Prevention of depression in at-risk adolescents: longer-term effects. JAMA Psychiatry, 70, 1161-1170.
-
Beck,
A.T.,
Ward,
C.H.,
Mendelson,
M.,
Mock,
J. &
Erbaugh,
J.
(1961) An inventory for measuring depression. Arch. Gen. Psychiatry, 4, 561-571.
-
Center for Behavioral Health Statistics and Quality
(2015) Behavioral health trends in the United States: results from the 2014 National Survey on Drug Use and Health, U.S. Department of Health and Human services, USA.
-
Chen,
H.H.,
Yeh,
H.L. &
Tsai,
S.J.
(2012) Association of lower hemoglobin levels with depression, though not with cognitive performance, in healthy elderly men. Psychiatry Clin. Neurosci., 66, 367-369.
-
Corwin,
E.J.,
Murray-Kolb,
L.E. &
Beard,
J.L.
(2003) Low hemoglobin level is a risk factor for postpartum depression. J. Nutr., 133, 4139-4142.
-
Hahn,
H.M.,
Yum,
T.H.,
Shin,
Y.W.,
Kim,
K.H.,
Yoon,
D.J. &
Chung,
K.J.
(1986) A standardization study of Beck Depression Inventory in Korea. J. Korean Neuropsychiatr. Assoc., 25, 77-100.
-
Hamer,
M. &
Molloy,
G.J.
(2009) Cross-sectional and longitudinal associations between anemia and depressive symptoms in the English Longitudinal Study of Ageing. J. Am. Geriatr. Soc., 57, 948-949.
-
Keskek,
S.O.,
Kirim,
S.,
Turhan,
A. &
Turhan,
F.G.
(2013) Depression in subjects with beta-thalassemia minor. Ann. Hematol., 92, 1611-1615.
-
Korean Centers for Disease Control and Prevention
(2013) Korean National Health and Nutrition Examination Survey 2011, KCDC press, Seoul, Korea.
-
Krishnan,
G.,
Grant,
B.J.,
Muti,
P.C.,
Mishra,
A.,
Ochs-Balcom,
H.M.,
Freudenheim,
J.L.,
Trevisan,
M. &
Schunemann,
H.J.
(2006) Association between anemia and quality of life in a population sample of individuals with chronic obstructive pulmonary disease. BMC Pulm. Med., 6, 23.
-
Lee,
J.M.,
Kim,
H.C.,
Cho,
H.M.,
Oh,
S.M.,
Choi,
D.P. &
Suh,
I.
(2012) Association between serum uric acid level and metabolic syndrome. J. Prev. Med. Public Health, 45, 181-187.
-
Lee,
Y.H. &
Song,
J.Y.
(1991) A study of the reliability and the validity of the BDI, SDS, and MMPI-D scales. Korean J. Clin. Psychol., 10, 98-113.
-
Lucca,
U.,
Tettamanti,
M.,
Mosconi,
P.,
Apolone,
G.,
Gandini,
F.,
Nobili,
A.,
Tallone,
M.V.,
Detoma,
P.,
Giacomin,
A.,
Clerico,
M.,
Tempia,
P.,
Guala,
A.,
Fasolo,
G. &
Riva,
E.
(2008) Association of mild anemia with cognitive, functional, mood and quality of life outcomes in the elderly: the “Health and Anemia” study. PLoS One, 3, e1920.
-
Maes,
M.,
Van de Vyvere,
J.,
Vandoolaeghe,
E.,
Bril,
T.,
Demedts,
P.,
Wauters,
A. &
Neels,
H.
(1996) Alterations in iron metabolism and the erythron in major depression: further evidence for a chronic inflammatory process. J. Affect. Disord., 40, 23-33.
-
Maestroni,
G.J.
(2000) Neurohormones and catecholamines as functional components of the bone marrow microenvironment. Ann. NY Acad. Sci., 917, 29-37.
-
Mathers,
C.D. &
Loncar,
D.
(2006) Projections of global mortality and burden of disease from 2002 to 2030. PLoS Med., 3, e442.
-
Ministry of Health and Welfare Republic of Korea Division of Mental Health Policy
(2012) The epidemiological survey of mental disorders in Korea 2011, Seoul National University, Seoul, Korea.
-
National Statistical Office of Korea Vital Statistics Division
(2012) Causes of death statistics 2011, National Statistical Office press, Taejeon, Korea.
-
Onder,
G.,
Penninx,
B.W.,
Cesari,
M.,
Bandinelli,
S.,
Lauretani,
F.,
Bartali,
B.,
Gori,
A.M.,
Pahor,
M. &
Ferrucci,
L.
(2005) Anemia is associated with depression in older adults: results from the InCHIANTI study. J. Gerontol. A Biol. Sci. Med. Sci., 60, 1168-1172.
-
Ormstad,
H.,
Aass,
H.C.,
Amthor,
K.F.,
Lund-Sorensen,
N. &
Sandvik,
L.
(2012) Serum levels of cytokines, glucose, and hemoglobin as possible predictors of poststroke depression, and association with poststroke fatigue. Int. J. Neurosci., 122, 682-690.
-
Pan,
W.H.,
Chang,
Y.P.,
Yeh,
W.T.,
Guei,
Y.S.,
Lin,
B.F.,
Wei,
I.L.,
Yang,
F.L.,
Liaw,
Y.P.,
Chen,
K.J. &
Chen,
W.J.
(2012) Co-occurrence of anemia, marginal vitamin B6, and folate status and depressive symptoms in older adults. J. Geriatr. Psychiatry Neurol., 25, 170-178.
-
Peura,
D.A.
(1987) Stress-related mucosal damage: an overview. Am. J. Med., 83, 3-7.
-
Rybka,
J.,
Kedziora-Kornatowska,
K.,
Banas-Lezanska,
P.,
Majsterek,
I.,
Carvalho,
L.A.,
Cattaneo,
A.,
Anacker,
C. &
Kedziora,
J.
(2013) Interplay between the pro-oxidant and antioxidant systems and proinflammatory cytokine levels, in relation to iron metabolism and the erythron in depression. Free Radic.Biol. Med., 63, 187-194.
-
Snyder,
A.M. &
Connor,
J.R.
(2009) Iron, the substantia nigra and related neurological disorders. Biochim. Biophys. Acta, 1790, 606-614.
-
Steptoe,
A.,
Wikman,
A.,
Molloy,
G.J. &
Kaski,
J.C.
(2012) Anaemia and the development of depressive symptoms following acute coronary syndrome: longitudinal clinical observational study. BMJ Open, 2, e000551.
-
Stewart,
R. &
Hirani,
V.
(2012) Relationship between depressive symptoms, anemia, and iron status in older residents from a national survey population. Psychosom. Med., 74, 208-213.
-
Umegaki,
H.,
Yanagawa,
M. &
Endo,
H.
(2011) Association of lower hemoglobin level with depressive mood in elderly women at high risk of requiring care. Geriatr. Gerontol. Int., 11, 262-266.
-
Weiskopf,
R.B.,
Toy,
P.,
Hopf,
H.W.,
Feiner,
J.,
Finlay,
H.E.,
Takahashi,
M.,
Bostrom,
A.,
Songster,
C. &
Aminoff,
M.J.
(2005) Acute isovolemic anemia impairs central processing as determined by P300 latency. Clin. Neurophysiol., 116, 1028-1032.
-
Wittayanukorn,
S.,
Qian,
J. &
Hansen,
R.A.
(2014) Prevalence of depressive symptoms and predictors of treatment among U.S. adults from 2005 to 2010. Gen. Hosp. Psychiatry, 36, 330-336.
-
World Health Organization
(2013) Investing in Mental Health: evidence for action, WHO Press, World Health Organization, Geneva, Switzerland.