Abstract
MicroRNAs (miRNAs) are short noncoding RNA that participate in posttranscriptional gene regulation. However, little is understood about the roles of miRNAs in Alzheimer’s disease (AD). In this study, we used next-generation sequencing on RNA extracted from the serum samples of 20 AD patients and 20 controls, yielding a total of 72 miRNAs with significantly changed expression levels. Among these candidates, we selected 9 miRNAs with most significant alteration in disease, and validated their expression levels using RT-qPCR analysis on serum samples from 45 AD patients and 40 control subjects. Thus, the serum levels of miR-146a-5p, 106b-3p, 195-5p, 20b-5p, and 497-5p were significantly higher, while those of miR-125b-3p, 29c-3p, 93-5p and 19b-3p were significantly lower in AD patients, compared with control subjects. Two miRNAs, miR-29c-3p and miR-19b-3p, were selected because both RNA deep-sequencing and q-PCR methods indicated lower serum levels of these miRNAs in AD patients. Computational analysis predicted that 3′-untranslated region of signal transduction and activator of transcription 3 (STAT3) mRNA is targeted both by miR-29c-3p and miR-19b-3p. Using SH-SY5Y human neuroblastoma cells, we showed that transfection with miR-29c-3p or miR-19b-3p inhibitor significantly increased STAT3 phosphorylation. Furthermore, Water maze test, which assesses the learning and memory deficits in rodents, showed that escape latency was significantly shorter in AD rats with overexpression of miR-29c-3p or miR-19b-3p than in control AD rats. These results suggest that miR-29c-3p or miR-19b-3p may contribute to the cognitive function. In conclusion, the serum levels of miR-29c-3p and miR-19b-3p are helpful biomarkers for AD.
Introduction
Alzheimer’s disease (AD) is a neurodegenerative disease that occurs in senile and presenile patients (Kumar et al. 2015) and is associated with typical histopathologic changes, including neuritic plaques, neurofibrillary tangles, neuronal loss, and gliosis (Braak and Braak 1991; Cairns et al. 2009). AD has become a serious social and public health problem because its high morbidity and disability rates severely affect human health (Ballard et al. 2011). Research has demonstrated that the morbidity of AD is 4-6% in developed countries and ~1% in China (Fratiglioni et al. 1999). The morbidity among patients aged > 65 years is 3-5%, which increases annually, and doubles every 5 years, reaching an incidence of > 20% in patients aged > 80 years. However, at present there are no treatments that can effectively reverse the cognitive deficits associated with the disease (Khachaturian 1985; Small et al. 1997). Collecting brain tissue or cerebrospinal fluid samples is difficult due to the invasive nature of these procedures and the high skill level that is required for their implementation. It is therefore challenging to apply these tools to the clinical diagnosis and study of AD, making it necessary to study the pathogenesis of AD from a new angle.
miRNAs are small non-coding RNAs of 18-30 nucleotides (nt) in length that regulate gene expression. miRNAs regulate various important biological processes and play important roles in the occurrence and development of diseases by affecting the stability or translation of mRNAs (Moss 2002). Dysfunction of miRNA regulation relates to many diseases, including cancer, acute myocardial infarction and AD (Wang et al. 2010; Mathe et al. 2015; Jonckheere et al. 2015; Ceder 2016; Tang et al. 2016). Lukiw et al. (2008) found that miRNA-146a-mediated modulation of complement factor H (CFH) gene expression may partially regulate an inflammatory response in the AD brain and in oxidatively stressed human brain cells. Many studies have also reported that the levels of miRNAs, including miR-27a, 9, 137, 181c, 146a, 155, 424, and 29c, are altered in the cerebrospinal fluid of AD patients (Geekiyanage and Chan 2011; Alexandrov et al. 2012; Sala Frigerio et al. 2013). Recent studies have revealed that the serum levels of miRNAs are stable and that miRNAs can be used to diagnose conditions, such as acute myocardial infarction and multiple myeloma (Wang et al. 2010; Lu et al. 2016; Amodio et al. 2016). In addition, an increasing number of studies have analyzed serum miRNAs in patients with nervous system-related disorders. For example, specific miRNAs in sera from patients with Parkinson’s disease, multiple sclerosis, and other diseases can be used as disease markers (Cardo et al. 2013). Serological detection is an ideal means of performing early screening because of its convenience, non-invasiveness, and suitability for screening large populations. However, the identity of miRNAs in the serum of AD patients remains unclear.
In this study, we compared the miRNAs in the serum of AD patients with those in the serum of healthy controls by RNA deep-sequencing bioinformatics analysis and quantitative real-time PCR (qPCR). The two groups showed significant differential levels of nine miRNAs. Furthermore, we showed that miR-29c-3p and miR-19b-3p share a mutual target gene, signal transduction and activator of transcription 3 (STAT3). In addition, overexpression of miR-29c-3p or miR-29c-3p could partly improve the cognitive function of AD rats. Thus, serum miR-29c-3p and miR-19b-3p are potential biomarkers for AD disease.
Materials and Methods
Study populations
A total of 65 outpatients with AD and 60 control subjects matched for age and sex (Table 1) were recruited from the Department of Gerontology and Neurology at the 117th Hospital of Peoples Liberation Army (PLA) from January 2014 to July 2015. AD was identified according to the National Institute of Neurologic, Communicative Disorders and Stroke-AD and Related Disorders Association (NINCDS-ADRDA) criteria (McKhann et al. 1984). The control subjects had normal neurological function, as reflected by their clinical features, laboratory examination results, and mini-mental state examination scores. Serum samples from 20 AD patients and 20 control subjects (who were recruited from January 2014 to June 2014) were separated for screening of differentially expressed genes using Illumina deep sequencing of small RNAs. The remaining serum samples from the other 45 AD patients and 40 control subjects (who were recruited form July 2014 to July 2015) were used for further validation of the differentially expressed miRNAs using qPCR. All subjects provided written informed consent to participate in the study after the nature of the procedure was fully explained to them. The study protocol was approved by the Ethics Committee of the 117th Hospital of PLA.
Patients aged 60 to 85 who were suffering from Alzheimer’s disease or no dementia were included in this study. The following patients were excluded from the study: patients receiving heparin therapy at the time of the blood draws (since heparin can interfere with RNA isolation); patients who had been diagnosed with any non-Alzheimer’s type of dementia; and patients suffering from other diseases, such as AMI, cancer, Parkinson’s disease, and multiple sclerosis, as these diseases can cause differences in miRNA expression (Lugli et al. 2015).
Small RNA library construction and Illumina small RNA deep sequencing
Total RNA was isolated from serum using the mirVana miRNA Isolation Kit (Ambion, TX, USA). The quality of the isolated RNAs was evaluated with a Bioanalyzer 2100 system (Agilent Technologies, USA). The small RNAs were ligated to linkers, and bar-coded cDNAs were prepared using a TruSeq Small RNA Sample Prep Kit (Illumina, USA). A Bioanalyzer 2100 system was then used to screen individual libraries for the presence of linked cDNAs, and each bar-coded library was pooled into one sample. The pooled libraries were sequenced in one lane of the Illumina HiSeq2500 Sequencer. MiRBase v19 and 50-bp single-end reads of the libraries were obtained. Reads with a minimum length of 15 nt and fewer than three terminal mismatches in the sequence were sorted and counted. Sequencing reads were extracted from the image files generated by the Illumina/Solexa 1G Genome Analyzer.
Quantitative real-time PCR (qPCR)
qPCR was performed using an Mx3000p™SYBR® Green real-time quantitative PCR system. Total RNA was isolated from human serum using a miRcute miRNA Isolation Kit (Qiagen, Germany) according to the manufacturer’s instructions. miRNAs were reverse-transcribed into cDNA using a miRcute miRNA First-Strand cDNA Synthesis Kit (Qiagen). Then, qPCR was performed using a miRcute miRNA qPCR Detection Kit (Qiagen). Relative miRNA expression levels were calculated using the comparative ΔΔCt method, and the values are expressed as 2–ΔΔCt.
Predicting specific miRNA target genes
Target genes were predicted using bioinformatics software (miRanda, DIANA-microT, PicTar, miRBase, RNAhybrid, and TargetScan). The genes predicted by at least 3 different software programs were listed as possible target genes, and the relevant target proteins were identified using the appropriate databases. Then, the high-confidence target (HCTarget) algorithm was used to integrate expression and sequence information to validate the forecasted target genes.
Cell culture
The SH-SY5Y human neuroblastoma cell line was purchased from the Shanghai Institute of Cell Biology, China. The cells (< 25 passages) were cultured in Dulbecco’s modified Eagle’s medium (DMEM)/F12 (Invitrogen, Carlsbad, CA, USA) containing 10% FBS (Invitrogen) at 37˚C with 5% CO2.
Cell transfection
The cells were transfected with an inhibitory oligonucleotide targeting miR-29c or miR-19b (miRNA inhibitor, 100 nM) or with nonspecific control (NC) miRNAs (GenePharma, Shanghai, China) using Lipofectamine™ 2000 reagent (Invitrogen) according to the manufacturer’s instructions. Five samples were tested in per group.
Western blot analysis
Cells were lysed in lysis buffer (Promega, Madison, WI) and the protein concentration was determined using the BCA protein assay (Bio-Rad, CA, USA). For each sample, 40 µg of protein was separated using 10% SDS-PAGE and transferred onto PVDF membranes (Millipore, Bedford, MA, USA). After blocking with 5% nonfat milk in TBS-Tween-20 (TBST), the membranes were blotted with STAT3, p-STAT3 (Proteintech, Chicago, IL, USA), or GAPDH (glyceraldehyde phosphate dehydrogenase, the internal reference; Beyotime Biotechnology, China) primary antibodies at a 1:1,000 dilution. The membranes were then incubated with the appropriate horseradish peroxidase (HRP)-conjugated anti-rabbit, anti-goat, or anti-mouse secondary antibodies (Santa Cruz, CA, USA) at a 1:2000 dilution for 1 h. After washing the membranes in TBST, we detected the immunoreactive bands using enhanced chemiluminescence (ECL; Amersham, Chicago, IL, USA).
Animals
Sprague-Dawley rats (aged 8-12 weeks) with a body weight of 200-300 g were obtained from Shanghai SLAC Laboratory Animal Co., Ltd. They were maintained under controlled laboratory temperature (25 ± 2°C) and humidity (60%) conditions, with a controlled light cycle (14 h light/10 h dark). Distilled water and sterilized food pellets were available ad libitum. The care and use of the animals were approved by the Ethics Committee of the 117th Hospital of PLA.
Rat model of dementia
Aβ1-40 (amyloid-β1-40) was diluted to a concentration of 2 μg/μL in sterile physiological saline and incubated at 37°C for 1 week. The rats were anesthetized with an intraperitoneal injection of 10% chloral hydrate and fixed on a stereotaxic apparatus after their hair had been shaved. Next, the skin of each rat was disinfected, and the skull was exposed using a longitudinal incision in the middle of the back of the head. Bregma was used as the target location, and the skin was cut with a 2.6-mm side incision, a 3.0-mm backward incision, and a 3.0-mm downward incision. Two holes, which were the hippocampus injection points, were punched in the skull using an engine bit, the dura was pierced with a needle, and each side of the hippocampus was injected with 5 μL of Aβ1-40 (10 μg) using a microsyringe. The solution was injected slowly over 10 min, and the microsyringes were held in place for an additional 10 min to ensure that the solution dispersed fully. The control group received an injection of the same amount of normal saline. Then, the holes in the skull were filled with dental acrylic, and the skin was sutured and disinfected. Gentamicin (3-5 drops, 2.50 × 10⁴ μL/kg) was used to protect the incision from infection before the regional incision was sutured. Each rat was held in a single cage until it was fully awake.
Water maze experiment
Lentiviruses, a subset of retroviruses, can be expressed stably in cells, and lentiviral plasmid for overexpression of miR-19b-3p or miR-29c-3p was generated and injected into the caudal veins of the rats. The titre of the recombinant lentivirus (lentiviral vector, lentiviral plasmid) was 1 × 10⁹ infectious units per millilitre. The water maze experiment was performed 7 days after the injection of 300 μL of lentiviral plasmid carrying miRNA. Fifteen rats were included in each group. Directed navigation was conducted during the first 4 days after injection, and space exploration began on the fifth day. The water maze consisted of a circular pool that was 100 cm in diameter and 60 cm in height, with a movable platform that was 10 cm in diameter. The pool was filled with tap water at a temperature of 25 ± 0.5°C, and the water level was 0.5-1 cm above the platform. The pool was divided into 4 quadrants before the experiment. Then, the platform was placed in the first quadrant. A digital video camera was hung above the pool and connected to a computer. The set tracking time was 2 minutes. The computer stopped tracking after 2 minutes or when the rat reached the platform. The time taken to find the platform after entering the water was considered the escape latency. During the 4 days of the place navigation test, training was conducted once per day in different quadrants. After the start of training, the rat was placed in the water facing the pool wall. If the rat failed to find the platform within 2 minutes, it was guided onto the platform and allowed to rest for 30 seconds. If the rat found the platform on its own within 2 minutes, it was allowed to rest on the platform for 30 seconds. The interval between the training sessions in each quadrant was 60 seconds. The computer tracked the entire training process, and the videos were saved to calculate the escape latency.
Statistical analysis
Data for the analysis of differences in miRNA expression between the 2 groups are presented as the mean ± standard error (SE). Nonparametric Mann-Whitney U tests were used to compare miRNA expression between the groups. Spearman’s rank correlation test was performed to evaluate the correlations between miR-29c miR-19b and STAT3 mRNA levels. All statistical analyses were conducted using SPSS 17.0 (SPSS, WA, USA). P < 0.05 was considered significant.
Results
Differentially expressed miRNAs between AD patients and control subjects
Illumina small RNA deep sequencing was used to determine the relative abundance of various miRNA families by calculating their sequence frequencies. The results of these calculations indicated that 72 dysregulated miRNAs showed at least a 2-fold difference in their expression levels between the patients and control subjects (Fig. 1A). Ten miRNAs with > 400 reads in Illumina deep-sequencing analysis were dysregulated in AD compared with control subjects (Fig. 1B). The expression levels of these differentially expressed miRNAs were subsequently validated using qPCR. The serum levels of miR-146a-5p, 106b-3p, 195-5p, 20b-5p, and 497-5p were higher, while those of miR-125b-3p, 29c-3p, 93-5p and 19b-3p were lower in AD patients than in control subjects. (Fig. 2; P < 0.05).
Predicting specific miRNA target genes
The serum levels of 9 miRNAs were different between the two groups. The number of serum miRNA target genes closely related to AD was determined using bioinformatics software (Table 2). In further studies, we focused on miR-29c-3p and miR-19b-3p which showed lower serum levels in AD patients, judged by RNA deep-sequencing and q-PCR method. We searched for miR-19b-3p and miR-29c-3p target genes by using online software (http://www.targetscan.org and http://starbase.sysu.edu.cn). These analyses revealed that STAT3 is a direct target of miR-19b-3p and miR-29c-3p (Table 3). Then, the HCTarget algorithm was used to validate predicted target genes, and a regulatory network of miRNAs and target genes was identified. This network contained miRNAs (miR-19b-3p and miR-29c-3p), 4 AD virulence genes, and STAT3.
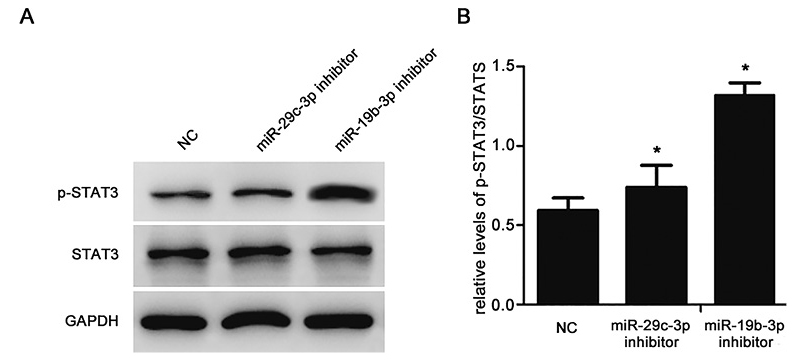
STAT3 activation is regulated by inhibitors of miR-19b-3p or miR-29c-3p
We next examined whether STAT3 activation is regulated by miR-19b-3p or miR-29c-3p in vitro. Downregulation of miR-29c-3p or miR-19b-3p promoted STAT3 phosphorylation (P < 0.05; Fig. 3A, B). This suggests that miR-19b-3p and miR-29c-3p may be endogenous regulators of STAT3 activation.
The functions of miR-19b-3p and miR-29c-3p in AD rats
Lentiviral plasmid expressing miR-19b-3p or miR-29c-3p was injected into the vein of AD rats. The rats were then studied with water maze experiments. Compared with the rats in the control group, the rats in the AD model group and the AD+vector group (injected with no-load plasmid) showed longer escape latencies (P < 0.05), confirming that the AD model was generated successfully. Compared with the rats in the AD+vector group, the rats in the AD+miR-29c-3p group (transfected with miR-29c-3p) and those in the AD+miR-19b-3p group (transfected with miR-19b-3p) showed significantly shorter escape latencies (P < 0.05; Fig. 4). Therefore, miR-29c-3p or miR-29c-3p overexpression improved cognitive function in a rat model of AD.
Discussion
Serum collection is simple and effective, unlike cerebrospinal fluid collection. In addition, the emergence of next-generation sequencing technology has made the detection of serum miRNAs more convenient and accurate (Wang et al. 2010; Lu et al. 2016; Amodio et al. 2016). However, there is currently a lack of studies on serum miRNAs in AD. In this study, we found the serum levels of miR-146a-5p, 106b-3p, 195-5p, 20b-5p, and 497-5p were higher, while the levels of miR-125b-3p, 29c-3p, 93-5p and 19b-3p were lower in AD patients than in healthy controls. The nine serum miRNAs profiled here may serve as candidate non-invasive biomarkers for AD and may be helpful for AD diagnosis and treatment in the future.
Among the 9 miRNAs identified, the downregulation of miR-125b noted herein was consistent with a previous study (Tan et al. 2014). Dong et al. (2015) found that the expression of miR-93-5p in AD patients was 0.48 times that in control subjects, a finding consistent with those of the current study. Some studies have also reported the lower levels of miR-137, 181c, 9, 29a, and 29b in the serum of patients with mild cognitive impairment (Geekiyanage et al. 2012). Although the expression levels of some of these miRNAs changed in the current study, the copy numbers were below 400; therefore, those miRNAs cannot be used as biomarkers.
miRNAs regulate the expression of their target genes. miRNAs suppress mRNA translation or promote mRNA degradation by binding to specific sequences in the 3´-UTRs of mRNAs. We used online software to confirm that STAT3 may be a direct target of miR-19b-3p and miR-29c-3p. The HCTarget algorithm was used to validate predicted target genes. Furthermore, a regulatory network of miRNAs and target genes was identified. This network contains miRNAs (miR-19b-3p and miR-29c-3p), 4 AD virulence genes, and STAT3. Gliogenesis occurs at a relatively late stage of development in the mammalian central nervous system. During this stage, glial differentiation from neural stem cells (NSCs) is tightly regulated by various factors, including STAT3 activation (Wang et al. 2011). In the adult brain, STAT3 activation can be observed under certain conditions, such as facial nerve axotomy, brain ischemia, dopamine neuron damage in the striatum, and spinal cord injury. Several studies suggest that STAT3 activation can promote glial differentiation of neural progenitor cells and inhibit neuronal differentiation of neural progenitor cells (Schwaiger et al. 2000; Choi et al. 2003; Sriram et al. 2004; Okada et al. 2006). STAT3 activation can result in excessive gliosis (Kwak et al. 2010; Tsuda et al. 2011), which is often observed in patients with AD. Therefore, we hypothesize that miR-19b-3p and miR-29c-3p may participate in the occurrence and development of AD by regulating STAT3 expression.
Next, the current study assessed potential miR-29c-3p and miR-19b-3p target genes in SH-SY5Y cells and studied the function of these two miRNAs in AD rats. Downregulation of miR-29c-3p or miR-19b-3p promoted STAT3 phosphorylation in SH-SY5Y cells. Our findings were consistent with the results of previous studies showing that STAT3 was negatively regulated by miR-29c-3p in brain tissues (Lei et al. 2015). Other studies demonstrated that miR-19b-3p levels were significantly decreased in the cerebrospinal fluid of AD patients (Gui et al. 2015). However, few reports have described target genes of miR-19b-3p. Li et al. (2014) used software prediction models revealed that tissue factor (TF) was a potential target of miR-19b-3p. Luciferase reporter constructs were then used to confirm that TF has miR-19b-3p binding sites. MiR-19b-3p expression could inhibit TF expression, which suggests that TF may be a target gene of miR-19b-3p. In another study, Qin et al. (2013) found that miR-19b-3p may be associated with the Wnt signalling pathway in cardiac development but without showing the direct target genes. In the current study, STAT3 activation was negatively regulated by miR-19b-3p and miR-29c-3p in SH-SY5Y cells, suggesting that STAT3 may be a direct target gene of these miRNAs. In addition, animal experiments showed that cognitive function of AD rats was improved when miR-19b-3p or miR-29c-3p was upregulated. Taken together, these findings demonstrated that miR-19b-3p and miR-29c-3p may participate in AD occurrence and development by regulating STAT3 activation.
In this study, we showed that miR-29c-3p and miR-19b-3p have a potential common target gene, STAT3. In addition, we found that overexpression of miR-29c-3p or miR-29c-3p could partially improve cognitive function in AD rats and that miR-29c-3p and miR-19b-3p in serum may be two candidate non-invasive biomarkers for AD. We did not include other differentially expressed miRNAs in our present study, but we will conduct further experiments in the future. In addition, we used only biochemical method to examine whether STAT3 is regulated by miR-19b-3p or miR-29c-3p, and a luciferase-based functional binding assay need to be performed to further evaluate the direct effects of miR-19b-3p and miR-29c-3p on STAT3.
In summary, the present study has demonstrated that miR-29c-3p and miR-19b-3p may participate in AD occurrence and development by regulating STAT3 activation. We propose that miR-29c-3p and miR-19b-3p are potential biomarkers for AD.
Acknowledgments
This work was supported by the Science and Technology Project of Hangzhou (No. 20130633B31) and the Natural Science Foundation of Zhejiang Province (No. LY13H250001).
We thank the editorial service American Journal Experts for its linguistic assistance during the preparation of this manuscript.
Conflict of Interest
The authors have no conflict of interest.
References
-
Alexandrov,
P.N.,
Dua,
P.,
Hill,
J.M.,
Bhattacharjee,
S.,
Zhao,
Y. &
Lukiw,
W.J.
(2012) microRNA (miRNA) speciation in Alzheimer’s disease (AD) cerebrospinal fluid (CSF) and extracellular fluid (ECF). Int. J. Biochem. Mol. Biol., 3, 365-373.
-
Amodio,
N.,
Stamato,
M.A.,
Gulla,
A.M.,
Morelli,
E.,
Romeo,
E.,
Raimondi,
L.,
Pitari,
M.R.,
Ferrandino,
I.,
Misso,
G.,
Caraglia,
M.,
Perrotta,
I.,
Neri,
A.,
Fulciniti,
M.,
Rolfo,
C.,
Anderson,
K.C., et al.
(2016) Therapeutic Targeting of miR-29b/HDAC4 epigenetic loop in multiple myeloma. Mol. Cancer Ther., 15, 1364-1375.
-
Ballard,
C.,
Gauthier,
S.,
Corbett,
A.,
Brayne,
C.,
Aarsland,
D. &
Jones,
E.
(2011) Alzheimer’s disease. Lancet, 377, 1019-1031.
-
Braak,
H. &
Braak,
E.
(1991) Neuropathological stageing of Alzheimer-related changes. Acta Neuropathol., 82, 239-259.
-
Cairns,
N.J.,
Ikonomovic,
M.D.,
Benzinger,
T.,
Storandt,
M.,
Fagan,
A.M.,
Shah,
A.R.,
Reinwald,
L.T.,
Carter,
D.,
Felton,
A.,
Holtzman,
D.M.,
Mintun,
M.A.,
Klunk,
W.E. &
Morris,
J.C.
(2009) Absence of Pittsburgh compound B detection of cerebral amyloid beta in a patient with clinical, cognitive, and cerebrospinal fluid markers of Alzheimer disease: a case report. Arch. Neurol., 66, 1557-1562.
-
Cardo,
L.F.,
Coto,
E.,
de Mena,
L.,
Ribacoba,
R.,
Moris,
G.,
Menendez,
M. &
Alvarez,
V.
(2013) Profile of microRNAs in the plasma of Parkinson’s disease patients and healthy controls. J. Neurol., 260, 1420-1422.
-
Ceder,
Y.
(2016) Non-coding RNAs in prostate cancer: from discovery to clinical applications. Adv. Exp. Med. Biol., 886, 155-170.
-
Choi,
J.S.,
Kim,
S.Y.,
Cha,
J.H.,
Choi,
Y.S.,
Sung,
K.W.,
Oh,
S.T.,
Kim,
O.N.,
Chung,
J.W.,
Chun,
M.H.,
Lee,
S.B. &
Lee,
M.Y.
(2003) Upregulation of gp130 and STAT3 activation in the rat hippocampus following transient forebrain ischemia. Glia, 41, 237-246.
-
Dong,
H.,
Li,
J.,
Huang,
L.,
Chen,
X.,
Li,
D.,
Wang,
T.,
Hu,
C.,
Xu,
J.,
Zhang,
C.,
Zen,
K.,
Xiao,
S.,
Yan,
Q.,
Wang,
C. &
Zhang,
C.Y.
(2015) Serum microRNA profiles serve as novel biomarkers for the diagnosis of Alzheimer’s disease. Dis. Markers, 2015, doi:10.1155/2015/625659.
-
Fratiglioni,
L.,
De Ronchi,
D. &
Aguero-Torres,
H.
(1999) Worldwide prevalence and incidence of dementia. Drugs Aging, 15, 365-375.
-
Geekiyanage,
H. &
Chan,
C.
(2011) MicroRNA-137/181c regulates serine palmitoyltransferase and in turn amyloid β, novel targets in sporadic Alzheimer’s disease. J. Neurosci., 31, 14820-14830.
-
Geekiyanage,
H.,
Jicha,
G.A.,
Nelson,
P.T. &
Chan,
C.
(2012) Blood serum miRNA: non-invasive biomarkers for Alzheimer’s disease. Exp. Neurol., 235, 491-496.
-
Gui,
Y.,
Liu,
H.,
Zhang,
L.,
Lv,
W. &
Hu,
X.
(2015) Altered microRNA profiles in cerebrospinal fluid exosome in Parkinson disease and Alzheimer disease. Oncotarget, 6, 37043-37053.
-
Jonckheere,
N.,
Lahdaoui,
F. &
Van Seuningen,
I.
(2015) Targeting MUC4 in pancreatic cancer: miRNAs. Oncoscience, 2, 799-800.
-
Khachaturian,
Z.S.
(1985) Diagnosis of Alzheimer’s disease. Arch. Neurol., 42, 1097-1105.
-
Kumar,
A.,
Singh,
A. & Ekavali.
(2015) A review on Alzheimer’s disease pathophysiology and its management: an update. Pharmacol. Rep., 67, 195-203.
-
Kwak,
Y.D.,
Dantuma,
E.,
Merchant,
S.,
Bushnev,
S. &
Sugaya,
K.
(2010) Amyloid-β precursor protein induces glial differentiation of neural progenitor cells by activation of the IL-6/gp130 signaling pathway. Neurotox. Res., 18, 328-338.
-
Lei,
X.,
Lei,
L.,
Zhang,
Z.,
Zhang,
Z. &
Cheng,
Y.
(2015) Downregulated miR-29c correlates with increased BACE1 expression in sporadic Alzheimer’s disease. Int. J. Clin. Exp. Pathol., 8, 1565-1574.
-
Li,
S.,
Ren,
J.,
Xu,
N.,
Zhang,
J.,
Geng,
Q.,
Cao,
C.,
Lee,
C.,
Song,
J.,
Li,
J. &
Chen,
H.
(2014) MicroRNA-19b functions as potential anti-thrombotic protector in patients with unstable angina by targeting tissue factor. J. Mol. Cell. Cardiol., 75, 49-57.
-
Lu,
Y.,
Wu,
D.,
Wang,
J.,
Li,
Y.,
Chai,
X. &
Kang,
Q.
(2016) miR-320a regulates cell proliferation and apoptosis in multiple myeloma by targeting pre-B-cell leukemia transcription factor 3. Biochem. Biophys. Res. Commun., 473, 1315-1320.
-
Lugli,
G.,
Cohen,
A.M.,
Bennett,
D.A.,
Shah,
R.C.,
Fields,
C.J.,
Hernandez,
A.G. &
Smalheiser,
N.R.
(2015) Plasma exosomal miRNAs in persons with and without Alzheimer disease: altered expression and prospects for biomarkers. PLoS One, 10, e0139233.
-
Lukiw,
W.J.,
Zhao,
Y. &
Cui,
J.G.
(2008) An NF-κB-sensitive micro RNA-146a-mediated inflammatory circuit in Alzheimer disease and in stressed human brain cells. J. Biol. Chem., 283, 31315-31322.
-
Mathe,
A.,
Scott,
R.J. &
Avery-Kiejda,
K.A.
(2015) MiRNAs and other epigenetic changes as biomarkers in triple negative breast cancer. Int. J. Mol. Sci., 16, 28347-28376.
-
McKhann,
G.,
Drachman,
D.,
Folstein,
M.,
Katzman,
R.,
Price,
D. &
Stadlan,
E.M.
(1984) Clinical diagnosis of Alzheimer’s disease: report of the NINCDS-ADRDA Work Group under the auspices of Department of Health and Human Services Task Force on Alzheimer’s Disease. Neurology, 34, 939-944.
-
Moss,
E.G.
(2002) MicroRNAs: hidden in the genome. Curr. Biol., 12, R138-140.
-
Okada,
S.,
Nakamura,
M.,
Katoh,
H.,
Miyao,
T.,
Shimazaki,
T.,
Ishii,
K.,
Yamane,
J.,
Yoshimura,
A.,
Iwamoto,
Y.,
Toyama,
Y. &
Okano,
H.
(2006) Conditional ablation of Stat3 or Socs3 discloses a dual role for reactive astrocytes after spinal cord injury. Nat. Med., 12, 829-834.
-
Qin,
D.N.,
Qian,
L.,
Hu,
D.L.,
Yu,
Z.B.,
Han,
S.P.,
Zhu,
C.,
Wang,
X. &
Hu,
X.
(2013) Effects of miR-19b overexpression on proliferation, differentiation, apoptosis and Wnt/β-catenin signaling pathway in P19 cell model of cardiac differentiation in vitro. Cell Biochem. Biophys., 66, 709-722.
-
Sala Frigerio,
C.,
Lau,
P.,
Salta,
E.,
Tournoy,
J.,
Bossers,
K.,
Vandenberghe,
R.,
Wallin,
A.,
Bjerke,
M.,
Zetterberg,
H.,
Blennow,
K. &
De Strooper,
B.
(2013) Reduced expression of hsa-miR-27a-3p in CSF of patients with Alzheimer disease. Neurology, 81, 2103-2106.
-
Schwaiger,
F.W.,
Hager,
G.,
Schmitt,
A.B.,
Horvat,
A.,
Hager,
G.,
Streif,
R.,
Spitzer,
C.,
Gamal,
S.,
Breuer,
S.,
Brook,
G.A.,
Nacimiento,
W. &
Kreutzberg,
G.W.
(2000) Peripheral but not central axotomy induces changes in Janus kinases (JAK) and signal transducers and activators of transcription (STAT). Eur. J. Neurosci., 12, 1165-1176.
-
Small,
G.W.,
Rabins,
P.V.,
Barry,
P.P.,
Buckholtz,
N.S.,
DeKosky,
S.T.,
Ferris,
S.H.,
Finkel,
S.I.,
Gwyther,
L.P.,
Khachaturian,
Z.S.,
Lebowitz,
B.D.,
McRae,
T.D.,
Morris,
J.C.,
Oakley,
F.,
Schneider,
L.S.,
Streim,
J.E., et al.
(1997) Diagnosis and treatment of Alzheimer disease and related disorders. Consensus statement of the American Association for Geriatric Psychiatry, the Alzheimer’s Association, and the American Geriatrics Society. JAMA, 278, 1363-1371.
-
Sriram,
K.,
Benkovic,
S.A.,
Hebert,
M.A.,
Miller,
D.B. &
O’Callaghan,
J.P.
(2004) Induction of gp130-related cytokines and activation of JAK2/STAT3 pathway in astrocytes precedes up-regulation of glial fibrillary acidic protein in the 1-methyl-4-phenyl-1,2,3,6-tetrahydropyridine model of neurodegeneration: key signaling pathway for astrogliosis in vivo? J. Biol. Chem., 279, 19936-19947.
-
Tan,
L.,
Yu,
J.T.,
Liu,
Q.Y.,
Tan,
M.S.,
Zhang,
W.,
Hu,
N.,
Wang,
Y.L.,
Sun,
L.,
Jiang,
T. &
Tan,
L.
(2014) Circulating miR-125b as a biomarker of Alzheimer’s disease. J. Neurol. Sci., 336, 52-56.
-
Tang,
J.,
Li,
Y.,
Wang,
J.,
Wen,
Z.,
Lai,
M. &
Zhang,
H.
(2016) Molecular mechanisms of microRNAs in regulating epithelial-mesenchymal transitions in human cancers. Cancer Lett., 371, 301-313.
-
Tsuda,
M.,
Kohro,
Y.,
Yano,
T.,
Tsujikawa,
T.,
Kitano,
J.,
Tozaki-Saitoh,
H.,
Koyanagi,
S.,
Ohdo,
S.,
Ji,
R.R.,
Salter,
M.W. &
Inoue,
K.
(2011) JAK-STAT3 pathway regulates spinal astrocyte proliferation and neuropathic pain maintenance in rats. Brain, 134, 1127-1139.
-
Wang,
F.W.,
Hao,
H.B.,
Zhao,
S.D.,
Zhang,
Y.M.,
Liu,
Q.,
Liu,
H.J.,
Liu,
S.M.,
Yuan,
Q.H.,
Bing,
L.J.,
Ling,
E.A. &
Hao,
A.J.
(2011) Roles of activated astrocyte in neural stem cell proliferation and differentiation. Stem Cell Res., 7, 41-53.
-
Wang,
G.K.,
Zhu,
J.Q.,
Zhang,
J.T.,
Li,
Q.,
Li,
Y.,
He,
J.,
Qin,
Y.W. &
Jing,
Q.
(2010) Circulating microRNA: a novel potential biomarker for early diagnosis of acute myocardial infarction in humans. Eur. Heart J., 31, 659-666.