Abstract
Carbon monoxide (CO) and nitrogen oxide (NO) affect vasodilation and cause hemodynamic change. Hemodynamic instability due to liver transplantation may result in poor prognosis of graft. This study investigated the hemodynamic implications of CO and NO levels measured using carboxyhemoglobin (COHb) and methemoglobin (MetHb) during living donor liver transplantation (LDLT). The hemodynamic instability with a pressor dose (norepinephrine equivalent) was estimated 1 hour after graft reperfusion. COHb and MetHb were used as indexes of CO and NO, and were measured using an arterial blood gas analyzer. One hundred and ten recipients who underwent LDLT from May 2011 to July 2013 were selected. Recipients were divided into high (≥ 1.9%) and low (< 1.9%) COHb groups with COHb concentrations at 5 minutes after reperfusion. Recipients were also divided into high (≥ 0.4%) and low (< 0.4%) MetHb groups with MetHb concentrations at 30 minutes after reperfusion. Data are presented as mean ± standard deviation or number (percentage). Model for End-stage Liver Disease (MELD) scores were different for the two COHb groups (low: 13.4 ± 9.0 vs. high: 19.7 ± 10.6, p < 0.001), and pressor doses adjusted by MELD scores were also different between the two COHb groups (low: 0.09 ± 0.01 μg/kg/min vs. high: 0.14 ± 0.01 μg/kg/min, p = 0.029). By contrast, pressor doses and MELD scores were not different between the two MetHb groups. In conclusion, CO rather than NO has hemodynamic implications during LDLT. Therefore, the increase in COHb during LDLT is predictive of hemodynamic instability.
Introduction
Carbon monoxide (CO) and nitrogen oxide (NO) have a number of functions in vivo. The physical and pharmacological roles of NO have been extensively studied in experimental and clinical models in recent decades (Gladwin et al. 2004; Lee et al. 2007; Hon et al. 2010; Hare et al. 2013). In contrast, our awareness of CO as a mediator of cardiovascular homeostasis and a maintenance factor in organ function developed relatively recently.
Both CO and NO are produced by enzymes in vivo and related with heme protein. Endogenous CO is produced by heme oxygenase and NO is synthesized from NO synthase. Both increase the formation of cyclic guanosine monophosphate from guanosine triphosphate and serve to lower vascular tone. CO tightly binds with hemoglobin and forms carboxyhemoglobin (COHb), which is slowly reconverted to hemoglobin in the presence of sufficient oxygen concentrations (Takeda et al. 2002). In the presence of NO, hemoglobin with ferrous heme is converted to hemoglobin with ferric heme (methemoglobin, MetHb). MetHb is reconverted to hemoglobin with ferrous heme through two enzyme systems, cytochrome b5 MetHb reductase and nicotinamide-adenine-dinucleotide-phosphate MetHb reductase. The former is responsible for removal of 95% of endogenous MetHb (Lee and Lee 2013). One study demonstrated that the increased concentration of COHb in liver transplantation is associated with initial function of the transplanted liver (Ali et al. 2007). The extent of damage can be estimated through expired CO levels after reperfusion in liver transplantation (Matsusaki et al. 2008). However, there are not yet studies about COHb and MetHb as predictors of hemodynamic change due to CO and NO during living donor liver transplantation (LDLT). This study investigated the hemodynamic implications of CO and NO levels based on COHb and MetHb as indexes during LDLT.
Methods
Subjects
The Institutional Review Board of Samsung Medical Center approved this retrospective study and waived the requirement for written informed consent (SMC 2014-09-090-003). Medical records of 300 recipients who underwent elective LDLT from May 2011 to July 2013 were initially screened. One case of re-transplantation, 24 cases of pediatric liver transplantation, 82 cases of deceased donor liver transplantation, 34 cases of unmounted pulmonary artery catheter, and 11 cases of aberrant gas analysis were excluded from the study. Thirty-eight recipients who were transfused with allogeneic packed red blood cells until 5 minutes after reperfusion were excluded. Conversely, 40 recipients who were transfused with Cell Saver (Haemonetics, Cell Saver®5, USA) blood until 5 minutes after reperfusion were included. Finally, 110 recipients were chosen as subjects.
Anesthetic care
Anesthetic management was conducted according to our institutional liver transplantation protocol. Induction was performed with 5 mg/kg thiopental sodium and sevoflurane, and maintained with isoflurane. The bispectral index was monitored and maintained in the 40-60 range. Mechanical ventilation was delivered at tidal volume of 8-10 ml/kg using a mixture of oxygen and medical air at a flow rate of 2 L/min. Mechanical ventilation was controlled to maintain normocapnea. Direct blood pressure was monitored via the right radial artery, right femoral artery, right femoral vein, and right internal jugular vein. A large-bore central venous catheter was placed in combination with a pulmonary arterial catheter (Swan-Ganz CCOmboV, Edward Lifesciences, LLC, Irvine, CA). The protocol aimed to maintain mean arterial pressure ≥ 70 mmHg, and the following was performed if mean arterial pressure was below 70 mmHg: adjustment of anesthetic depth to maintain a bispectral index of 40-60, fluid and blood product infusion to maintain central venous pressure ≥ 5 mmHg, administration of dopamine to maintain right ventricular ejection fraction ≥ 40, and administration of norepinephrine to maintain systemic vascular resistance ≥ 600 dyn·s/cm5. The rate of pressor infusion was recorded. Body temperature was maintained in the normal range using a whole-body convective warming blanket, room temperature set at 24°C, and a rapid fluid warmer.
Data collection
In all patients, preoperative data such as age, sex, body weight, height, model for end-stage liver disease (MELD) score, and graft recipient weight ratio were collected. Pressor dose was measured one hour after graft reperfusion, and pressor dose was expressed with norepinephrine equivalent. The relative potency of dopamine and norepinephrine were 1:100 (De Backer et al. 2010). Because smoking can affect the concentration of COHb, the proportion of non-smokers, ex-smokers, and current smokers was analyzed.
COHb and MetHb were used as indexes of CO and NO. The concentration of COHb and MetHb were measured in percentage using an arterial blood gas analyzer (RAPIDLab®1265, SIEMENS, Tarrytown NY, USA). Arterial blood gas analysis was performed six times: after induction of anesthesia (Time 1), at the beginning of the anhepatic phase (Time 2), at 10 minutes before reperfusion (Time 3), at 5 minutes after reperfusion (Time 4), at 30 minutes after reperfusion (Time 5), and at 1 hour after reperfusion (Time 6).
Maximal oxidative stress occurs just after reperfusion. Because CO has 200 times higher affinity for hemoglobin than oxygen, the concentration of COHb in blood immediately reaches the highest level (Peterson and Stewart 1970). COHb was divided into two groups at Time 4. There has been little research on the time course of MetHb, such as affinity for hemoglobin and half-life. Hon et al. (2010) reported that MetHb reached its maximum concentration at 30 minutes after administration of sodium nitrite. Accordingly, patients were divided into high and low MetHb groups with MetHb concentrations at 30 minutes after reperfusion.
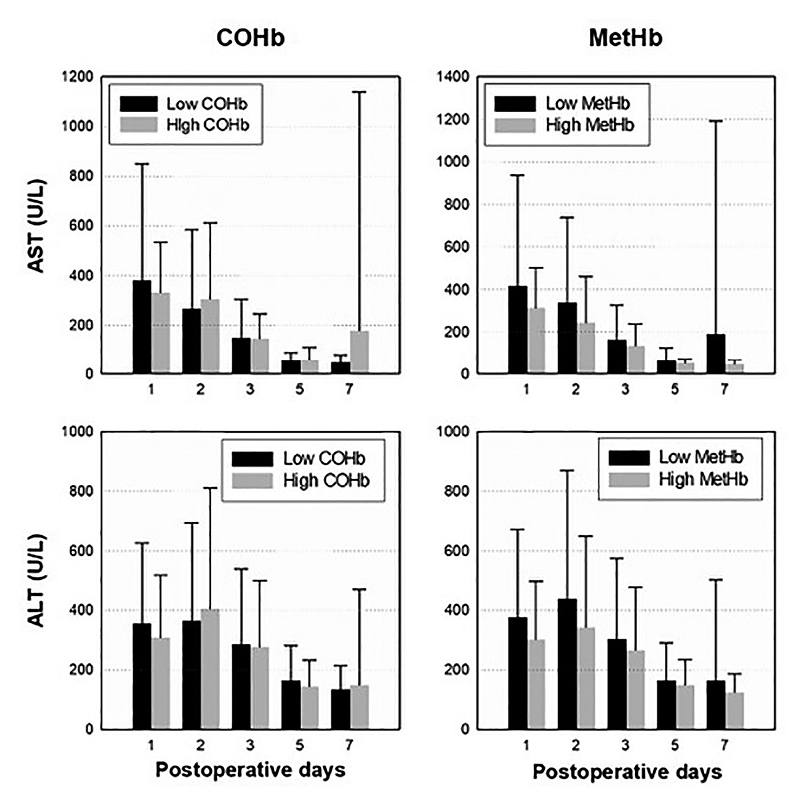
The postoperative course of patients was assessed by aspartate aminotransferase (AST) and alanine aminotransferase (ALT) at 1, 2, 3, 5, and 7 days after surgery in both low and high groups of COHb and MetHb.
Statistics
Data are presented as mean ± standard deviation (SD) or number and percentage. Continuous variables were compared with Mann-Whitney U test or independent T-test according to Kolmogorov-Smirnov Z test, and categorical values were compared with Chi-square test. In COHb, the pressor dose at Time 6 was compared between two groups with Analysis of Covariance (ANCOVA) test adjusted by MELD score. The value is represented as mean ± standard error. Repeated measures ANOVA using Bonferroni correction for post-hoc analysis was used for AST and ALT at 1, 2, 3, 5, and 7 days after surgery. The correlation analysis for continuous values was evaluated through Pearson correlation analysis. Data were considered significant at p-value is less than 0.05 (two-tailed). All statistical analyzes were performed using SPSS (version 22.0, SPSS Inc., Chicago, IL, USA).
Results
Division into two COHb groups
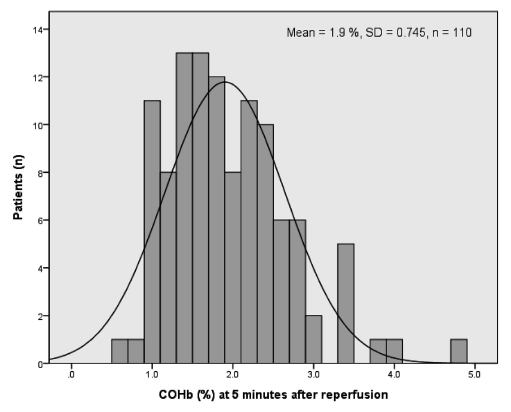
Fig. 1 shows the distribution of COHb at 5 minutes after reperfusion in all patients. The mean ± standard deviation was 1.90 ± 0.764%. The patients were divided into high (COHb ≥ 1.9%) and low groups (COHb < 1.9%).
Comparison of characteristics between two COHb groups
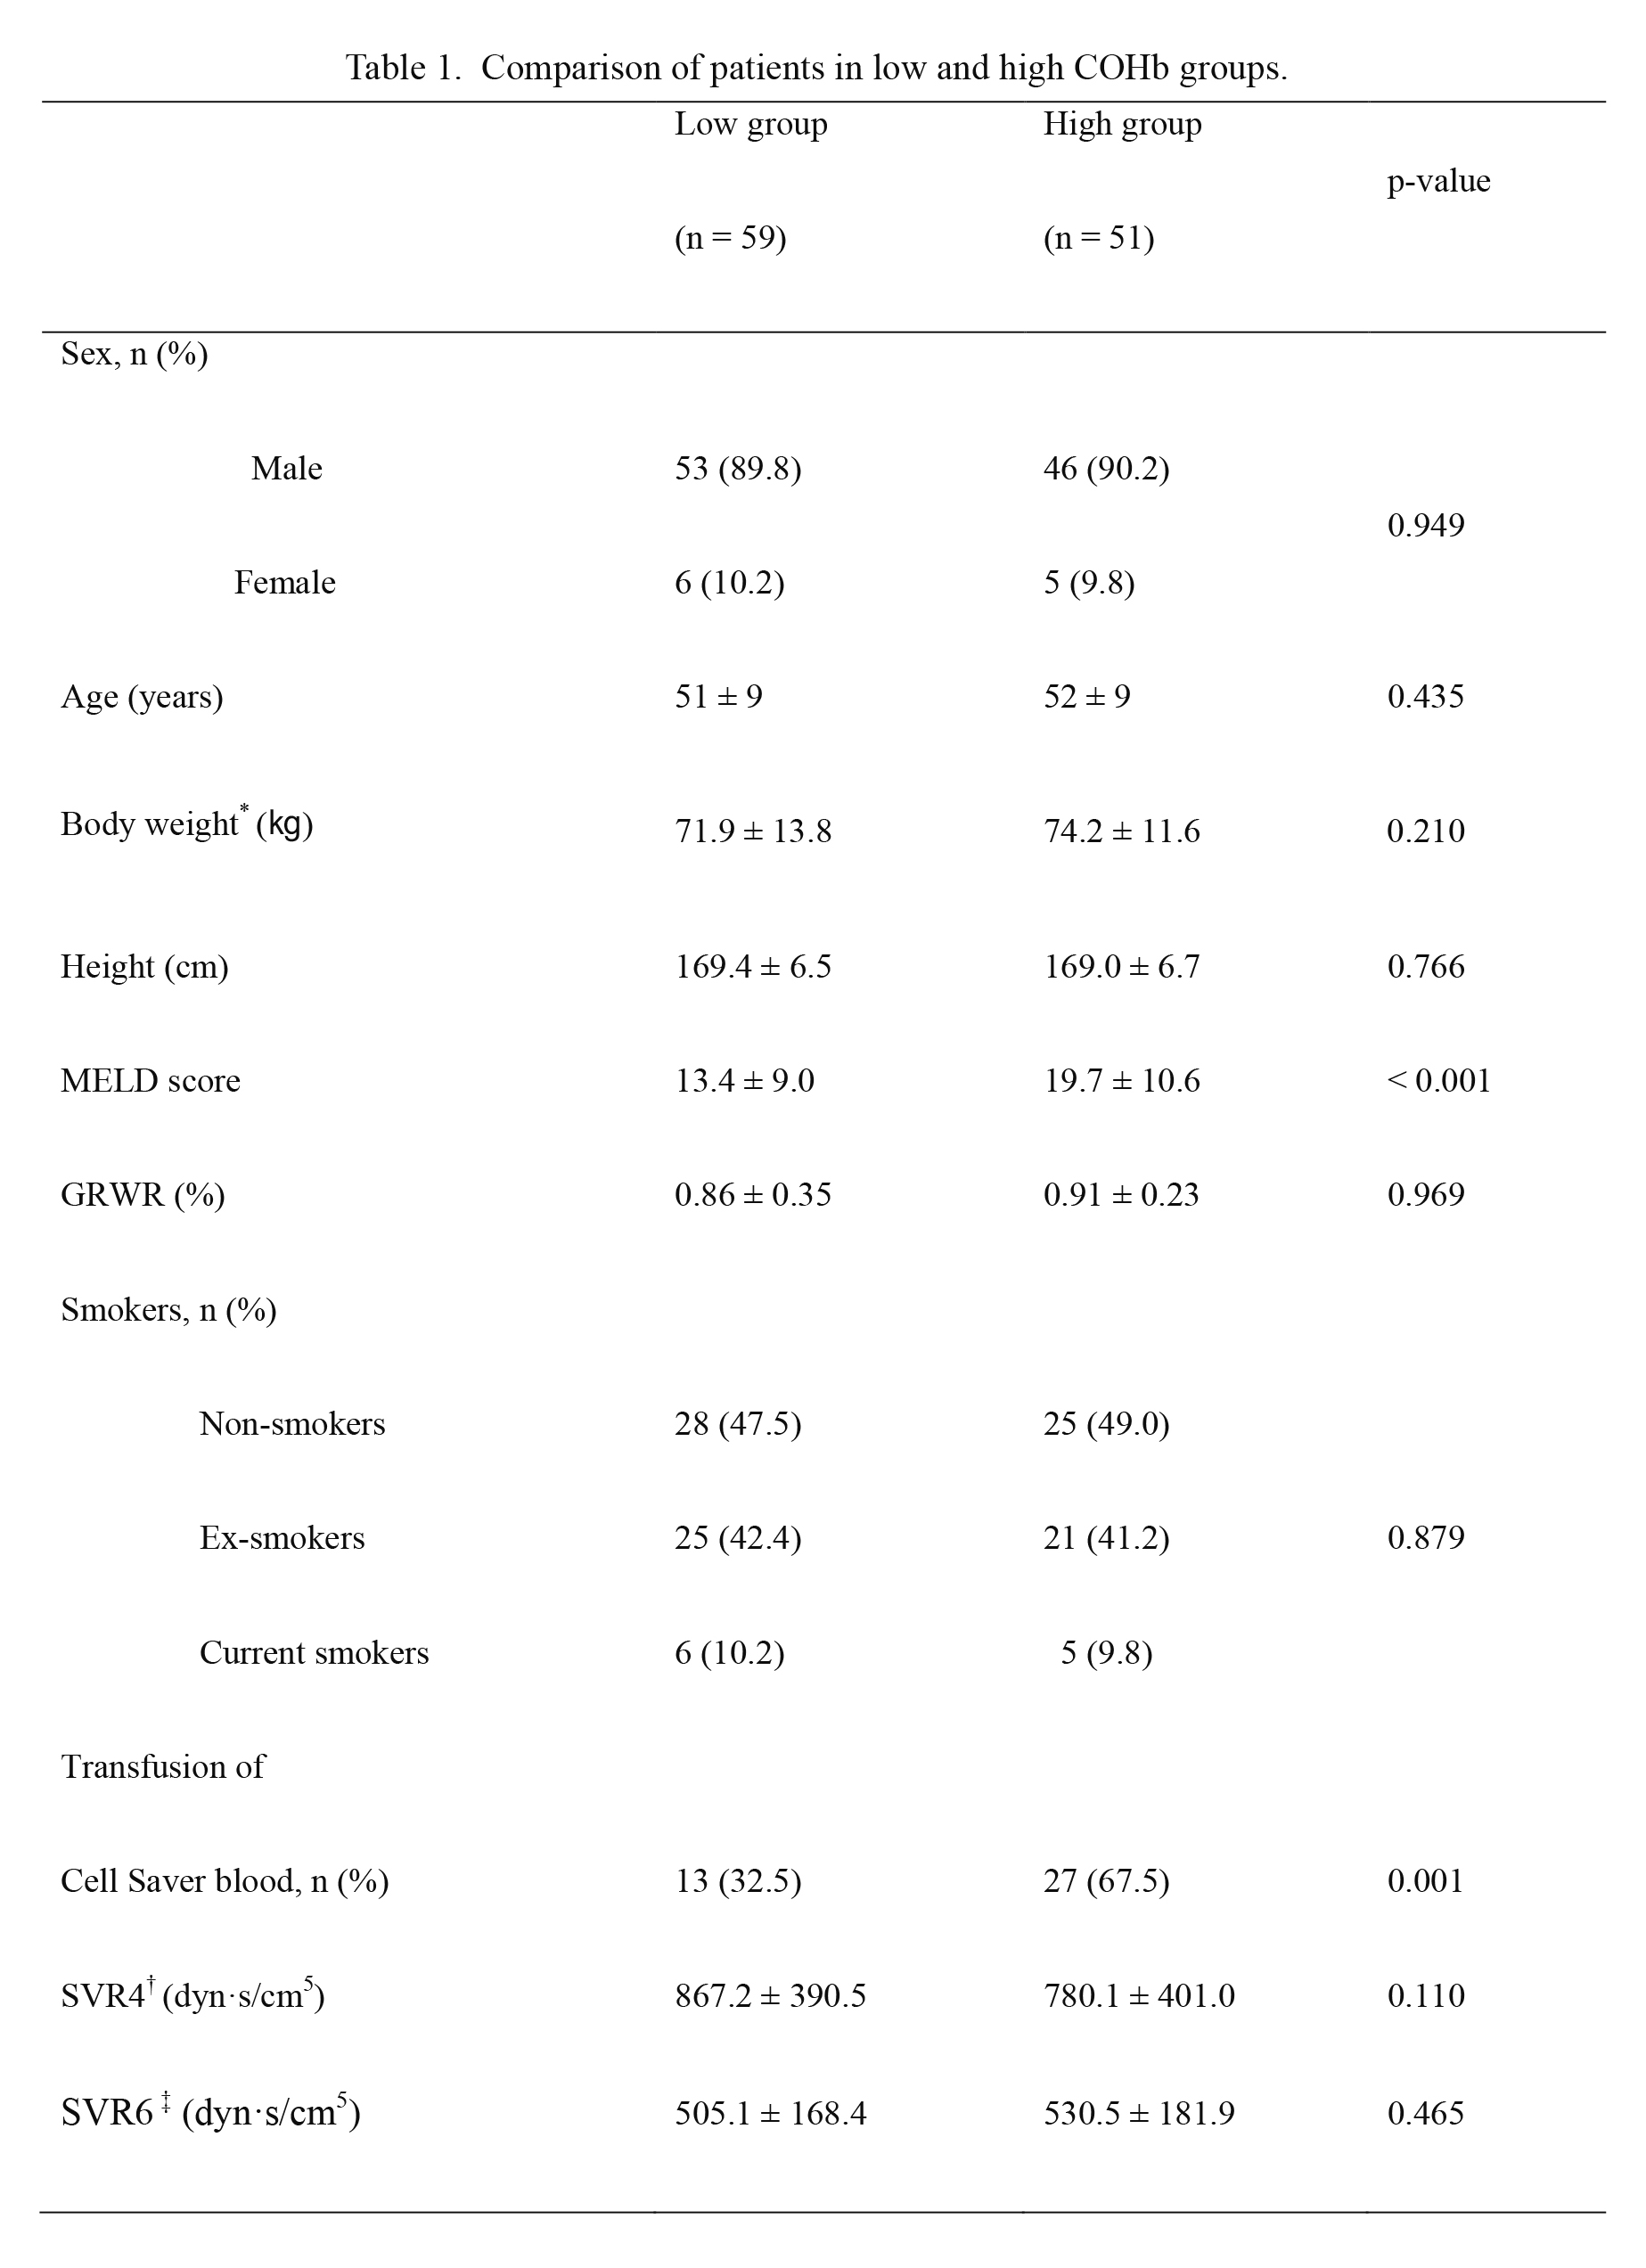
Patient data did not vary between the two groups except for MELD score (low COHb group: 13.4 ± 9.0, high COHb group: 19.7 ± 10.6, p < 0.001) and patients transfused with Cell Saver blood (low COHb group: 32.5% and high COHb group: 67.5%, p = 0.001) (Table 1).
Comparison of pressor dose between two COHb groups
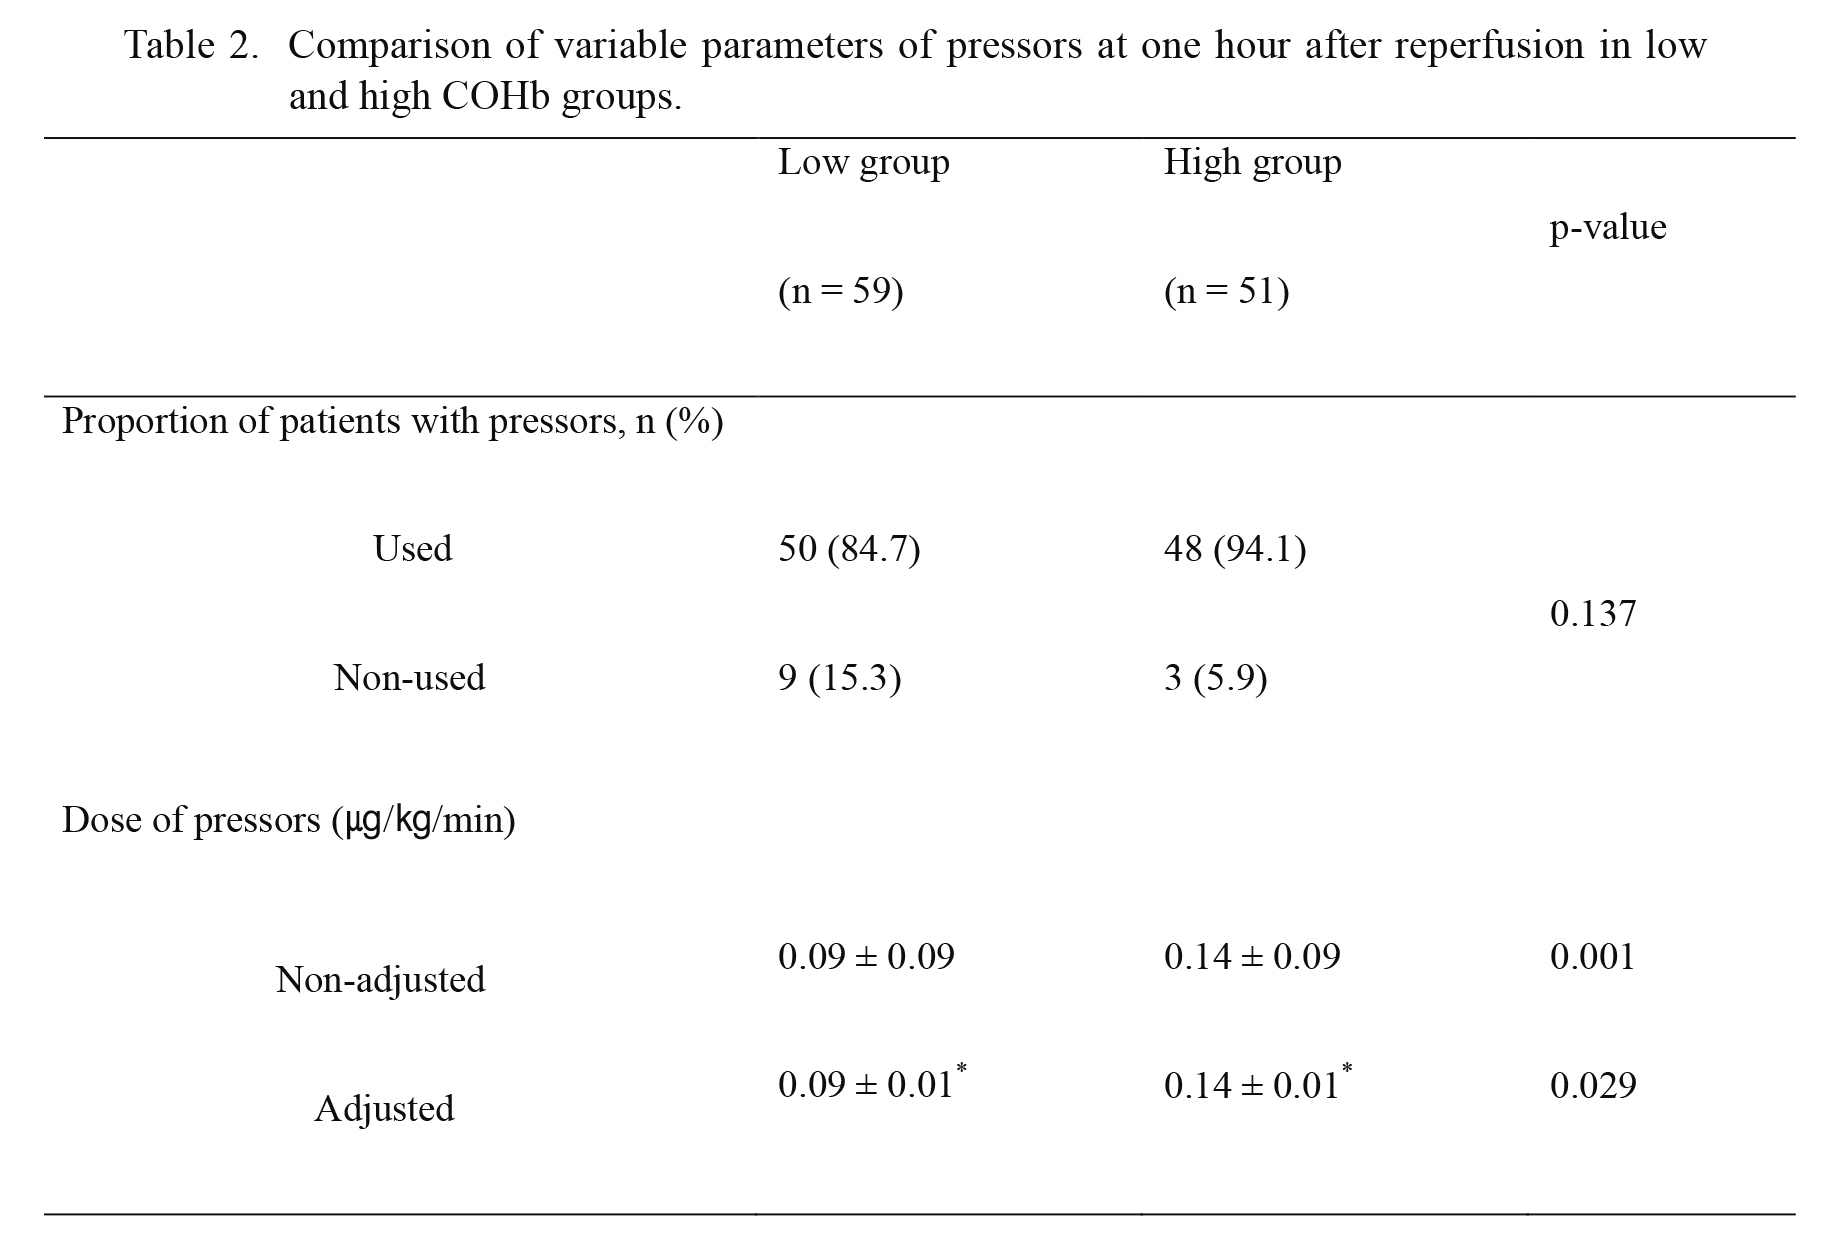
At one hour after reperfusion, the proportion of patients with infusion of pressor was similar between the two groups (Table 2). Pressor doses were significantly different between the two groups (low COHb group: 0.09 ± 0.09 μg/kg/min and high COHb group: 0.14 ± 0.09 μg/kg/min, p = 0.001). With the Analysis of Covariance (ANCOVA) test to adjust MELD score, pressor dose was significantly different between the two groups (mean ± standard error, low COHb group: 0.09 ± 0.01 μg/kg/min and high COHb group: 0.14 ± 0.01 μg/kg/min, p = 0.029). This indicates that increased COHb after ischemia/reperfusion can predict hemodynamic instability.
Division into two MetHb groups
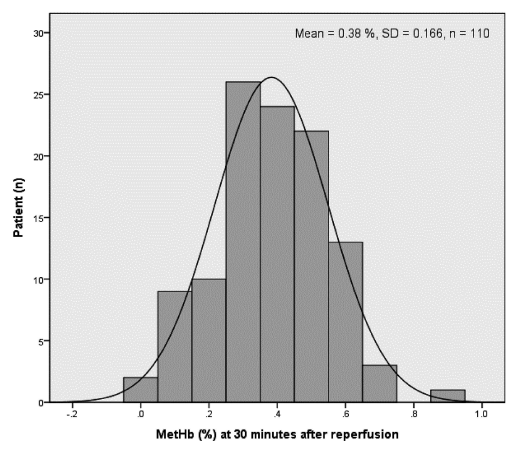
Fig. 2 shows the distribution of MetHb at 30 minutes after reperfusion in all patients. The mean ± standard deviation was 0.380 ± 0.166%. Patients were divided into high (MetHb ≥ 0.4%) and low groups (MetHb < 0.4%).
Comparison of characteristics and pressor dose between two MetHb groups
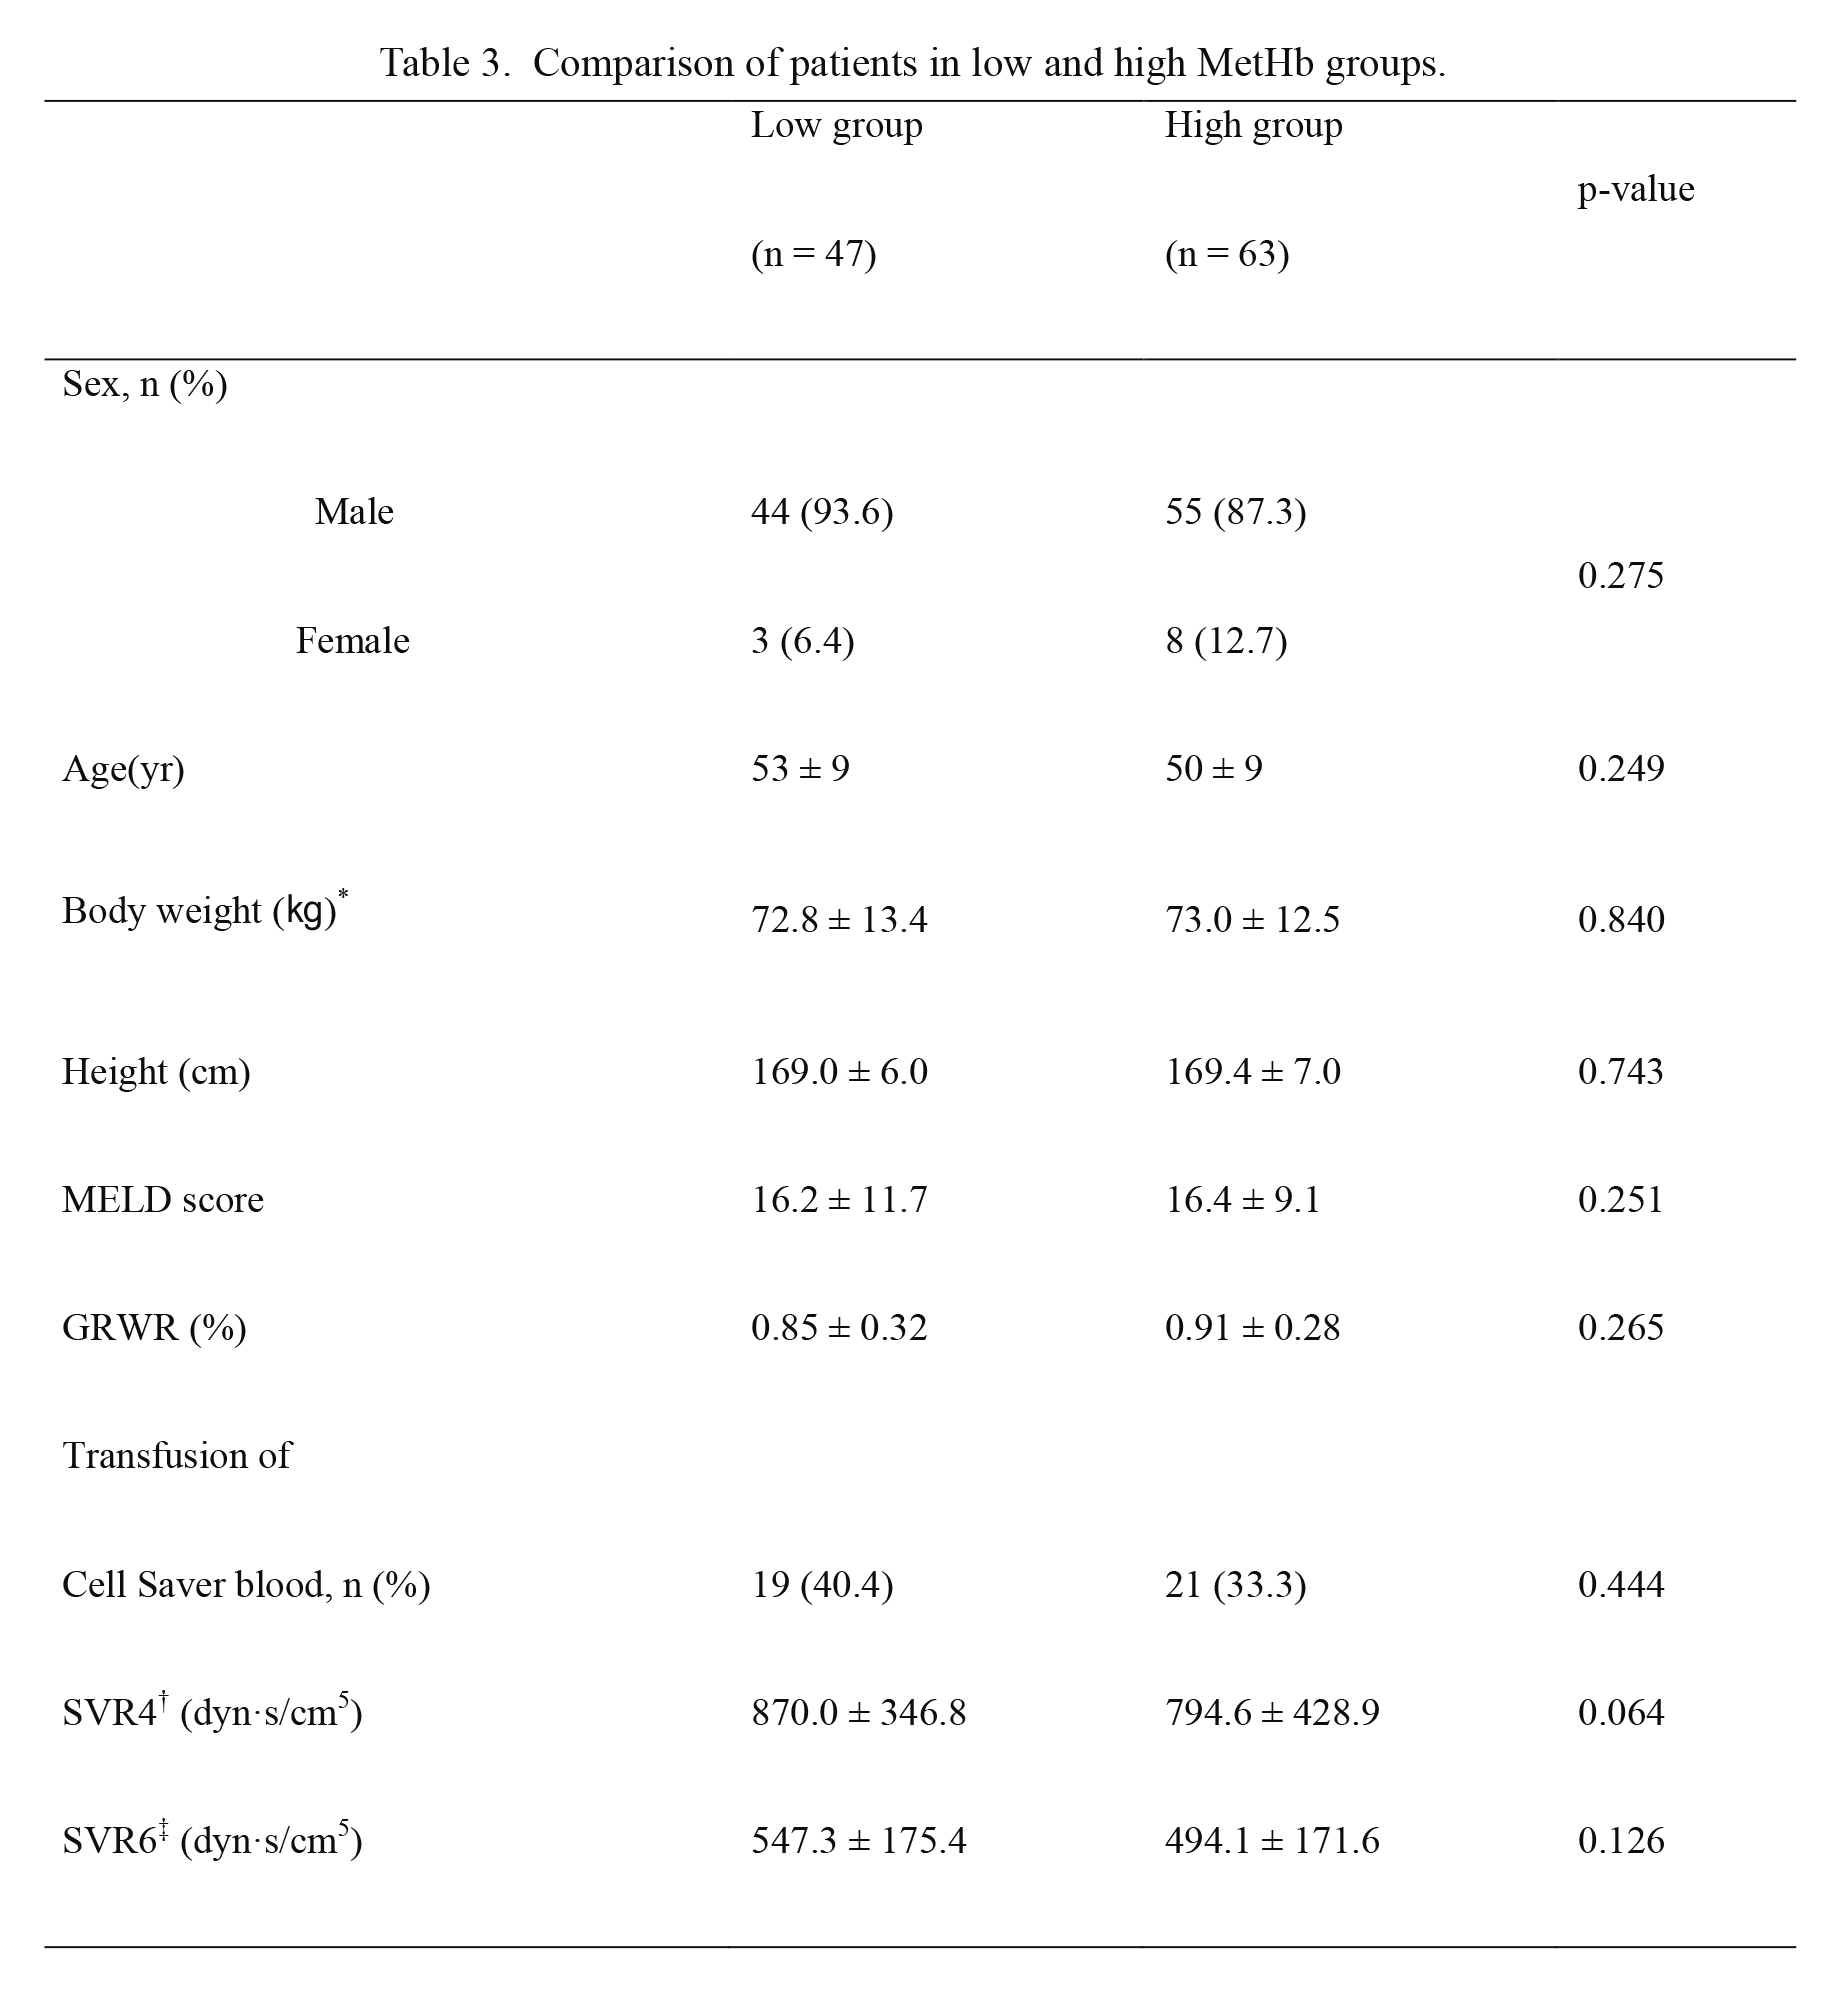
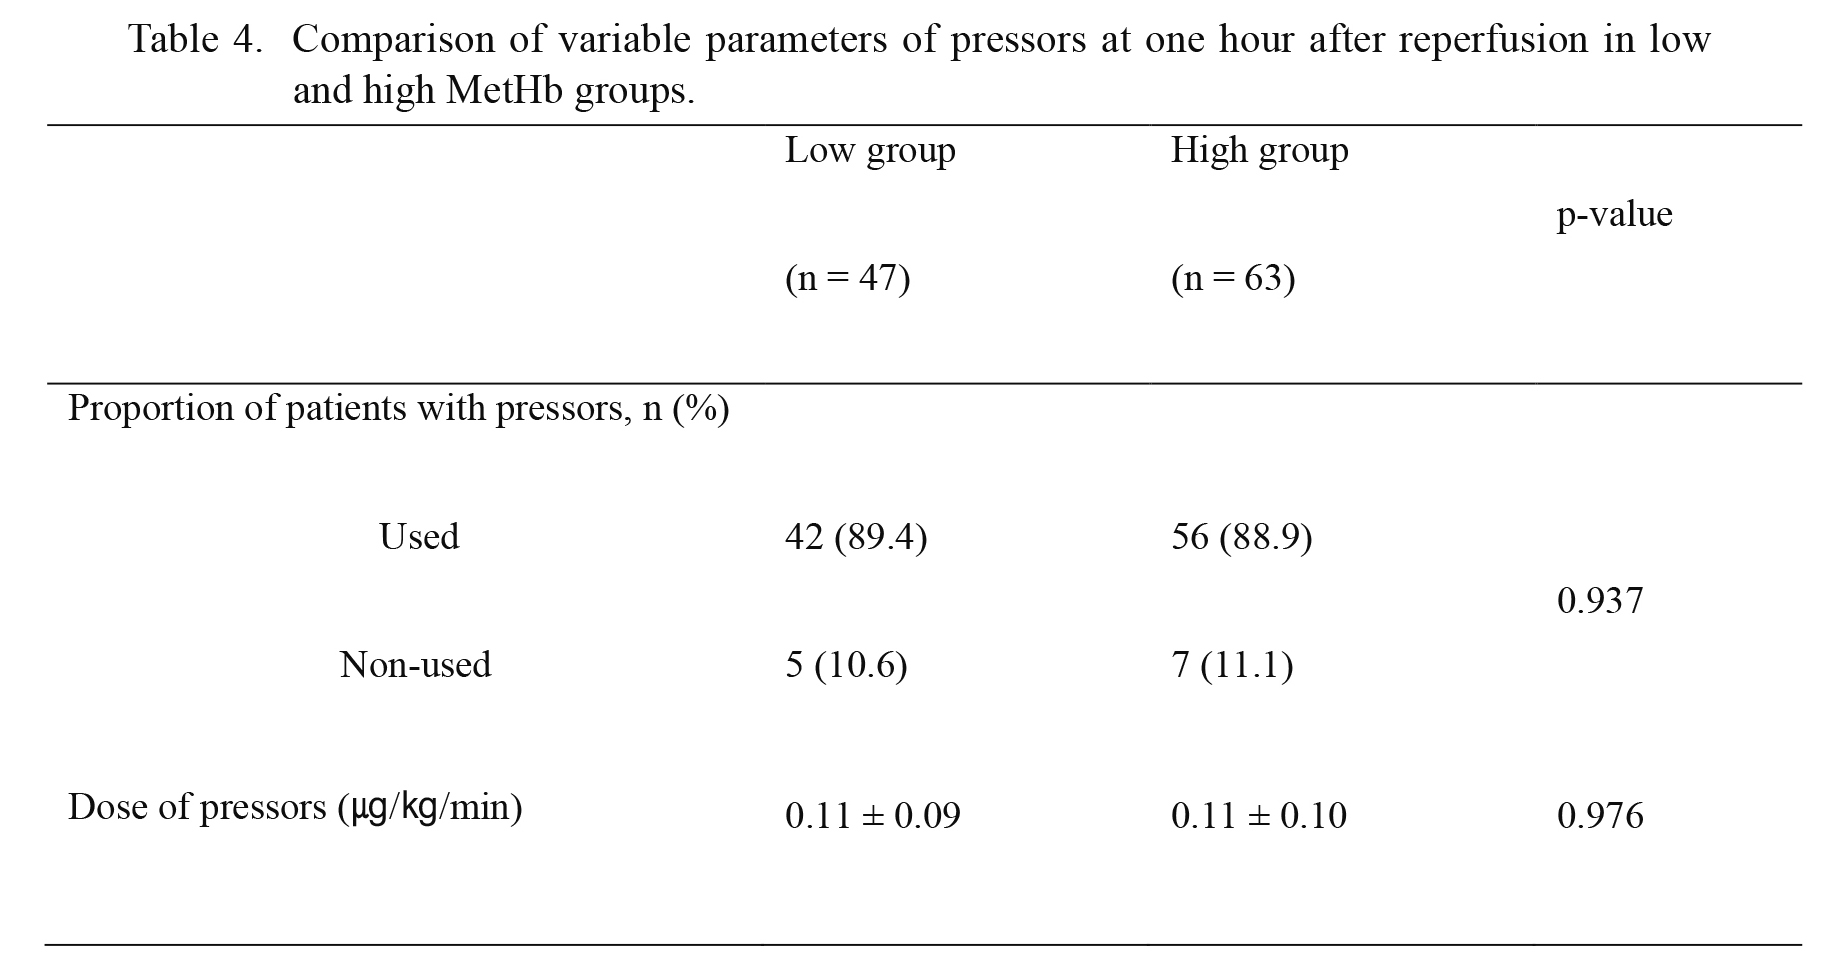
Patient data did not vary between the two groups, including MELD score. Pressor doses at one hour after reperfusion and the proportion of patients with pressor were not significantly different between the two groups (Tables 3 and 4).
Correlation analysis among MELD score, COHb, and pressor dose
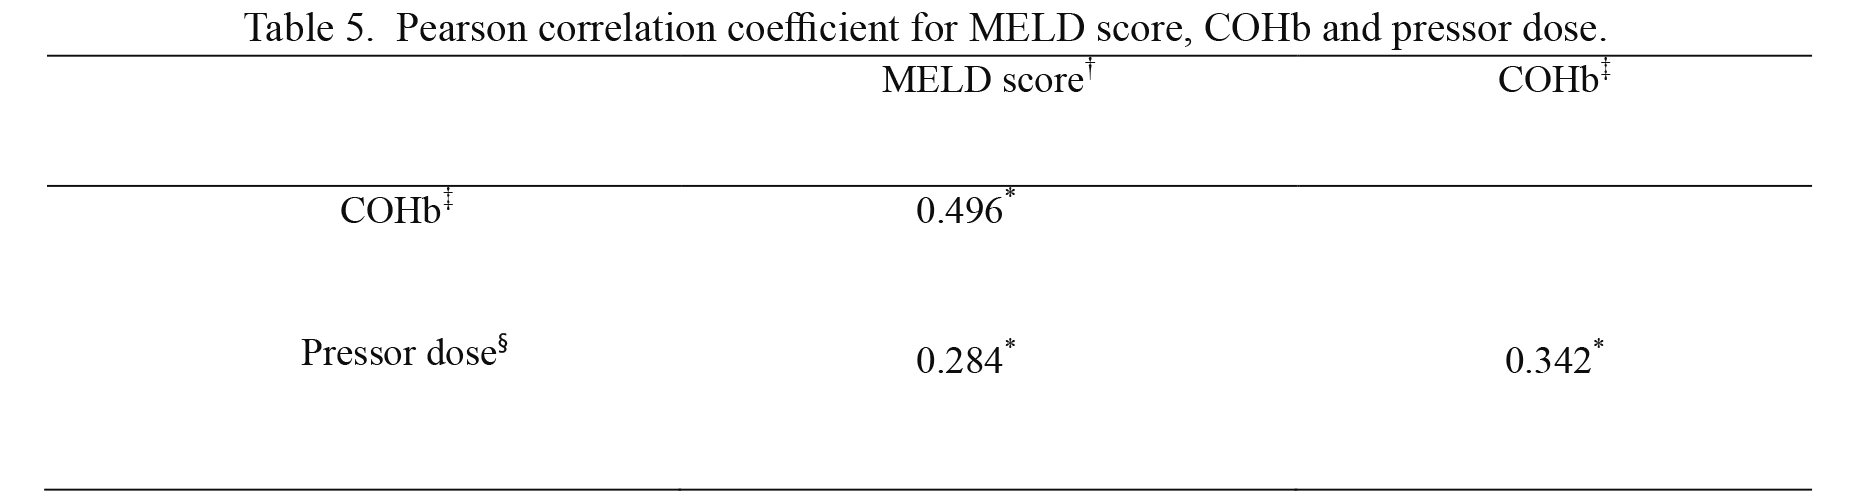
A correlation among preoperative MELD score, COHb at 5 minutes after reperfusion, and pressor doses at 1 hour after reperfusion were observed. There was moderate correlation between the COHb and pressor doses (correlation coefficient = 0.342, p < 0.001). Weak correlation was also seen between preoperative MELD scores and pressor doses at one hour after reperfusion (correlation coefficient = 0.284, p = 0.003). Moderate correlation was seen between preoperative MELD scores and COHb at 5 minutes after reperfusion (correlation coefficient = 0.496, p < 0.001) (Table 5).
Correlation analysis between COHb at 5 minutes and MetHb at 30 minutes after reperfusion
There was weak correlation between COHb at 5 minutes after reperfusion and MetHb at 30 minutes after reperfusion, but not significant (correlation coefficient = 0.176, p = 0.065).
Comparison of postoperative aspartate aminotransferase and alanine aminotransferase
There were no significant differences in AST and ALT between the low and high COHb groups (Fig. 3). There were also no significant differences in AST and ALT between the low and high MetHb groups.
Discussion
Various endogenous hormones and monoxides are related to vascular tone adjustment. Many studies (Gladwin et al. 2004; Lee et al. 2007) indicate that NO lowers systemic vascular resistance in patients with end-stage liver disease, but there are few studies on the effects of CO. Takeda et al. (2002) reported that organ perfusion and function is affected by monoxide gas mediators during abdominal surgery. De Las Heras et al. (2003) claimed that heme oxygenase activity and expression is increased in liver tissues of patients with liver cirrhosis, and this was confirmed by COHb concentration. The concentration of COHb in patients with end-stage liver disease was 1.0 ± 0.1%, which is significantly higher than the value in healthy people (0.6 ± 0.1%). Hayashi et al. (2004) stated that heme oxygenase is induced by oxidative stress not only in surgery but also in sepsis, systemic inflammation, and organ dysfunction. They also indicated that COHb can be used as a marker for oxidative stress. If someone has hypoxic damage or oxidative stress due to ischemia/reperfusion injury, CO and NO are generated from cells. During liver transplantation in patients with end-stage liver disease, oxidative stress caused by ischemia/reperfusion injury can lower systemic vascular resistance and worsen hemodynamic instability. During the post-reperfusion period of liver transplantation, hemodynamic instability can reduce blood flow to the graft, liver function recovery may be delayed, and outcomes may be worse. Because the pressor dose was proportional to hemodynamic instability, we studied the relationship of hemodynamic instability to changes in CO and NO and the dose of pressor.
The concentration of CO is determined through gas analysis directly from the breath. However, CO has 200 times higher affinity for hemoglobin than oxygen. Hemoglobin immediately couples with CO, and the concentration of COHb in blood immediately reaches the highest level (Peterson and Stewart 1970). Because co-oximetry blood gas analyzer (hemoglobin, oxyhemoglobin, carboxyhemoglobin, methemoglobin, and oxygen saturation) is commonly used during liver transplantation, COHb was used as an index of generated CO. Indeed, Matsusaki et al. (2008) reported a significant correlation between the concentration of CO and COHb 5 minutes after reperfusion.
Typically, smokers have a higher concentration of CO in blood than non-smokers. Tran et al. (2007) reported that the normal range of COHb is 0-1.5% in ordinary persons and 4-9% in smokers. However, the half-life of COHb was 320 minutes (Peterson and Stewart 1970). Patients were divided by COHb concentration at 5 minutes after reperfusion. The effects of smoking may be not significant. Moreover, the ratio of smokers did not vary between the two groups, and there was no significant difference in COHb concentration after induction among non-smokers, ex-smokers, and current smokers.
The exact concentration of COHb in Cell Saver blood is difficult to determine. Slucky et al. (1996) argued that an increase in the concentration of COHb is due to transfusion of autologous blood collecting through the Cell Saver. In addition, COHb concentration changes in proportion to the degree of electric cauterization during spine surgery. However, COHb concentration 5 minutes after reperfusion is lower in recipients with Cell Saver blood transfusion than recipients without Cell Saver blood transfusion (1.7 ± 0.7% vs. 2.3 ± 0.7%, p < 0.001). Therefore, the use of Cell Saver did not affect the outcomes of the present study.
Pressors are inevitably used during liver transplantation for hemodynamic stability. CO produced by oxidative stress increases vasodilation and contributes to a higher demand for pressor. In fact, there were no significant differences in systemic vascular resistance 5 minutes and 1 hour after reperfusion in the two groups (Table 1). This indicates that the use of pressor corrects decreased systemic vascular resistance. The low COHb group has a lower MELD score, and the high COHb group has a higher MELD score. That is, the severity of liver disease is associated with increased CO production. Moreover, both COHb level at 5 minutes after reperfusion and MELD score had a weak correlation with the pressor dosage at 1 hour after reperfusion. Therefore, the concentration of COHb at 5 minutes after reperfusion and preoperative MELD score are weakly associated with hemodynamic instability during liver transplantation.
With oxidative stress such as operations and acute anemia, Hare et al. (2013) reported a small but consistent increase in MetHb levels. When oxidative stress increases, the enzyme system re-converting MetHb quickly reaches its limit and MetHb accumulates (Lee and Lee 2013). However, there has been little research on the time course of MetHb, such as affinity for hemoglobin and half-life. According to Hon et al. (2010), by 30 minutes after administration of sodium nitrite, MetHb reached its maximum concentration. Thus, MetHb was used as an index of NO generation at 30 minutes after reperfusion. Table 4 shows no significant difference in the pressor dose used between low and high MetHb groups. Therefore, there is no relationship between hemodynamic instability after reperfusion and MetHb. Moreover, MetHb and MELD score had no relationship.
CO and NO differ in their effect on blood vessels and contributing to lower tension along with creation of cyclic guanosine monophosphate. According to Pannen and Bauer (1998), NO dilates the hepatic artery and does not affect the portal vein, whereas CO dilates the portal vein, but has little impact on the hepatic artery in the mouse liver. Suematsu et al. (1996) reported that NO dilates the hepatic artery more than the portal vein and CO dilates the portal vein more than the hepatic artery in human livers. According to our findings, COHb is more correlated with vasodilation during LDLT, compared with MetHb. Therefore, CO has a greater impact on hemodynamic instability by affecting the portal vein in LDLT than NO does by affecting the hepatic artery.
This study has several limitations. First, this report is a retrospective study at a single center. Therefore, bias due to unmeasured parameters is not ruled out. Another limitation is the time of MetHb division. Our reference is based on the MetHb concentration after administration of sodium nitrite, but this seems to be a different mechanism from the change in MetHb concentration due to hepatic ischemia/reperfusion injury.
In conclusion, CO and preoperative MELD score are associated with hemodynamic instability during LDLT, while NO is not. Increased COHb after ischemia/reperfusion can predict hemodynamic instability. This is the first study about hemodynamic implications of CO and NO during LDLT. In the future, more research is needed to investigate the clinical significance of CO and NO during liver transplantation and postoperative management.
Conflict of Interest
The authors declare no conflict of interest.
References
-
Ali,
Y.,
Negmi,
H.,
Elmasry,
N.,
Sadek,
M.,
Riaz,
A.,
Al Ouffi,
H. &
Khalaf,
H.
(2007) Early graft function and carboxyhemoglobin level in liver transplanted patients. Middle East J. Anaesthesiol., 19, 513-525.
-
De Backer,
D.,
Biston,
P.,
Devriendt,
J.,
Madl,
C.,
Chochrad,
D.,
Aldecoa,
C.,
Brasseur,
A.,
Defrance,
P.,
Gottignies,
P. &
Vincent,
J.L.
(2010) Comparison of dopamine and norepinephrine in the treatment of shock. N. Engl. J. Med., 362, 779-789.
-
De Las Heras,
D.,
Fernandez,
J.,
Gines,
P.,
Cardenas,
A.,
Ortega,
R.,
Navasa,
M.,
Barbera,
J.A.,
Calahorra,
B.,
Guevara,
M.,
Bataller,
R.,
Jimenez,
W.,
Arroyo,
V. &
Rodes,
J.
(2003) Increased carbon monoxide production in patients with cirrhosis with and without spontaneous bacterial peritonitis. Hepatology, 38, 452-459.
-
Gladwin,
M.T.,
Crawford,
J.H. &
Patel,
R.P.
(2004) The biochemistry of nitric oxide, nitrite, and hemoglobin: role in blood flow regulation. Free Radic. Biol. Med., 36, 707-717.
-
Hare,
G.M.,
Tsui,
A.K.,
Crawford,
J.H. &
Patel,
R.P.
(2013) Is methemoglobin an inert bystander, biomarker or a mediator of oxidative stress. The example of anemia? Redox Biol., 1, 65-69.
-
Hayashi,
M.,
Takahashi,
T.,
Morimatsu,
H.,
Fujii,
H.,
Taga,
N.,
Mizobuchi,
S.,
Matsumi,
M.,
Katayama,
H.,
Yokoyama,
M.,
Taniguchi,
M. &
Morita,
K.
(2004) Increased carbon monoxide concentration in exhaled air after surgery and anesthesia. Anesth. Analg., 99, 444-448.
-
Hon,
Y.Y.,
Sun,
H.,
Dejam,
A. &
Gladwin,
M.T.
(2010) Characterization of erythrocytic uptake and release and disposition pathways of nitrite, nitrate, methemoglobin, and iron-nitrosyl hemoglobin in the human circulation. Drug Metab. Dispos., 38, 1707-1713.
-
Lee,
B.,
Baik,
D.,
Yun,
S.,
Shin,
J.,
Kim,
J.,
Yun,
S.,
Kim,
B.,
Kim,
S.,
Shin,
J. &
Song,
I.
(2007) Peripheral nitric oxide activity in patients with liver cirrhosis. Korean J. Med., 73, 251-251.
-
Lee,
K. &
Lee,
J.
(2013) Antidote for acquired methemoglobinemia: methylene blue. J. Korean Med. Assoc., 56, 1084-1090.
-
Matsusaki,
T.,
Morimatsu,
H.,
Takahashi,
T.,
Matsumi,
M.,
Sato,
K.,
Kaku,
R.,
Sato,
T.,
Yagi,
T.,
Tanaka,
N. &
Morita,
K.
(2008) Increased exhaled carbon monoxide concentration during living donor liver transplantation. Int. J. Mol. Med., 21, 75-81.
-
Pannen,
B.H. &
Bauer,
M.
(1998) Differential regulation of hepatic arterial and portal venous vascular resistance by nitric oxide and carbon monoxide in rats. Life Sci., 62, 2025-2033.
-
Peterson,
J.E. &
Stewart,
R.D.
(1970) Absorption and elimination of carbon monoxide by inactive young men. Arch. Environ. Health, 21, 165-171.
-
Slucky,
A.V. &
Eismont,
F.J.
(1996) Carbon monoxide levels in cell saver salvaged blood exposed to electrocautery during lumbar spine surgery. J. Spinal Disord., 9, 404-408.
-
Suematsu,
M.,
Wakabayashi,
Y. &
Ishimura,
Y.
(1996) Gaseous monoxides: a new class of microvascular regulator in the liver. Cardiovasc. Res., 32, 679-686.
-
Takeda,
R.,
Tanaka,
A.,
Maeda,
T.,
Yamaoka,
Y.,
Nakamura,
K.,
Sano,
K.,
Kataoka,
M.,
Nakamura,
Y.,
Morimoto,
T. &
Mukaihara,
S.
(2002) Perioperative changes in carbonylhemoglobin and methemoglobin during abdominal surgery: alteration in endogenous generation of carbon monoxide. J. Gastroenterol. Hepatol., 17, 535-541.
-
Tran,
T.T.,
Martin,
P.,
Ly,
H.,
Balfe,
D. &
Mosenifar,
Z.
(2007) Carboxyhemoglobin and its correlation to disease severity in cirrhotics. J. Clin. Gastroenterol., 41, 211-215.