Regular Contribution
Estimating Age at Death Based on Costal Cartilage Calcification
2017 Volume 243 Issue 4 Pages 237-246
Details
2017 Volume 243 Issue 4 Pages 237-246
Age estimation is a crucial part of forensic investigations. Because different parts of the body are often found at crime scenes, it is important to explore the regions that can be used for age estimation. Previous studies have used simple X-ray to analyze changes in costal cartilage calcification as a measure of age. Here, we tested whether age could be better estimated using measurements of costal cartilage calcification on postmortem CT images. In this study, male and female decedents (n = 10 each) from autopsy cases were grouped into 10-year incremental age groups (20-29 y; 30-39 y; up to 89 y). We found that the mean Hounsfield unit (CT number) and percentage calcification (the ratio of the ossified area to the whole area) increased with age for both sexes. However, there were marked individual differences within many of the groups, and this led to a statistically significant difference (P < 0.05) only between the 20-29 y group and the older age groups. To improve the ability to correctly assign cases to age groups, we introduced and reanalyzed the data using Bayesian statistics. This improved the classifications rates, with 40% of males and 35% of females correctly assigned into their age groups. Broadening the age range could further improve the number of matches. Thus, combining Bayesian statistics with CT imaging can be used to estimate age at death from costal cartilage calcification, and could be used as an adjunct in forensic investigations.
Previous morphological studies have investigated estimations of age and sex from cadaveric ribs to establish baseline values for the identification of unidentified decedents. Iscan et al. (1984a) found that the sternal end of the fourth rib undergoes age-related metamorphosis. They classified this process into nine stages for each sex (Iscan et al. 1984b, 1985). Similarly, Kunos and colleagues (1999) sought to identify metrical and morphological characteristics of the costal face, tubercle, and head of the first rib. X-ray photograms make it possible to examine the entire costal cartilage for age- and sex-related differences in calcification, and images can be collected from both living and dead persons (Stewart and McCormick 1984; Rejtarova et al. 2004; Garamendi et al. 2011). However, morphological classification with the naked eye or on an X-ray requires advanced skills and experience. Over the past few years, the use of computed tomography (CT) has increased in many forensic institutions in Japan, and advances in software have made the creation of three-dimensional (3D) images relatively easy. These images can be stored digitally and used as a source of objective data, for example, the Hounsfield unit (HU). The HU scale is a quantitative, standardized scale that describes radiodensity as CT numbers. These 3D images can be used to extract target areas by deleting overlapping structures that can disrupt the analysis of a plain radiograph. In this study, we explored a new methodology for age estimation of costal cartilage calcification using HU and the volume ratio of classification areas. Following this, we used a Bayesian theorem to “narrow down” the age estimation range.
In this study, we chose to examine the second and fourth costal cartilages in adults. McCormick (1980) investigated X-ray photographs of costal cartilages from 210 bodies and found that mineralization of the costal cartilages initially appeared at 15 years but was uncommon before the age of 20 years, and show that marked calcification appears after 50 years of age. Calcification can be observed histologically during the first decade of life, and radiologically after the second decade (Rejtarova et al. 2009). Many studies have used the fourth costal cartilage for estimating age (Iscan et al. 1984a, b, 1985; Inoi 1997; Dedouit et al. 2008; Fanton et al. 2010; Verzeletti et al. 2013; Cerezo-Roman and Hernandez Espinoza 2014; Haj Salem et al. 2014), and some researchers have analyzed the first ribs (King 1939; Kampen et al. 1995; Barchilon et al. 1996; Kunos et al. 1999), showing that calcification of the costal cartilage of the first rib is different to that of the other ribs (King 1939; Kampen et al. 1995; Barchilon et al. 1996; Kunos et al. 1999). However, the costal cartilage of the first rib overlaps with the clavicle and soft tissue, and this makes it difficult to extract only the first costal cartilage from a CT image. Below the fourth costal cartilage, there is often fusion with the subsequent costal cartilage, so the boundary between the two areas of cartilage is too ambiguous.
Bayesian estimation was first reported by Lucy et al. (1996) using teeth as a way to overcome constraints with using regression analyses. Here, we report for the first time a method for combining postmortem CT data and Bayesian statistics in evaluating calcification of costal cartilage with aging.
In this study, 10 decedents of each sex in each age group (10-year increments from 20s to 80s) were chosen from among autopsy cases, for which postmortem CT examination had been performed at our institution from January 2013 to September 2015. However, we only had six females in their 20s, because there were fewer cases in this age bracket during our research period. In total, we analyzed radiographic images from 136 individuals (70 males and 66 females).
To determine inter-observer error, 10 cases were chosen from autopsy cases at our institution from November 2015 to May 2016. To assess our age estimation table using Bayesian statistics, an additional 20 males and 20 females were chosen from our autopsy cases at our institution from November 2015 to May 2016, with 1 to 4 individuals in each age group.
To exclude putrefactive artifacts, we analyzed scans performed no later than 3 weeks after death. In addition, as a general rule, severely decomposed bodies do not undergo CT scanning at our institution. Cases with chest injuries, including charred bodies, were also excluded from this study. The study was approved by the Ethics Committee of Tohoku University Graduate School of Medicine (2015-1-410).
CT protocol and image managementA 64-channel (i.e., 64 detector rows with a section thickness of 0.5 mm at the center of rotation) Aquilion Multi Detector (MD) CT scanner (Toshiba Medical Systems, Tokyo, Japan) was used for imaging in this study. Noncontrast volumetric helical scans were acquired from the vertex of the head to the pelvis at 120 kVp or 135 kVp with variable mAs. We used an auto-exposure control system, a beam pitch of 0.844, a scanning field-of-view diameter of 500 mm, and a section thickness of 1.0 mm in 32-slice mode. The MDCT datasets were sent to a server for digital imaging and communication in medicine (POP-Net Server; Image ONE, Tokyo, Japan). Multi-planar reconstruction images, volume rendering (VR) images, and maximum intensity projection (MIP) images were reconstructed using a 3D workstation (Ziostation2 ver. 2.1.5.0; Ziosoft, Tokyo, Japan).
Analysis of costal cartilage in CT imagesThe costal cartilages from both the second and fourth ribs were analyzed for each case. A target area of bone was chosen from the VR images (Fig. 1a). The image was changed to an MIP with a window width (WW) and a window level (WL) of 450 and 1,500, respectively (Fig. 1b). One costal cartilage, including the sternum and the rib, was manually extracted from the image. At this stage, an observer judged the presence or absence of calcification close to the area of sternal attachment. The presence of calcification was determined by visible areas of X-ray absorption–even for a short interval, regardless of shape. Next, to erase the sternum and the rib, we manually extracted only the costal cartilage (Fig. 1c). The image was then changed to WL 80 (Fig. 1d). The total volume of the costal cartilage and whole mean HU were automatically measured using the workstation. Finally, the WL was then changed to 180 to analyze only the area of calcification in the costal cartilage (Fig. 1e). The volume of the ossified area was automatically measured by the workstation. We calculated the percentage of calcification as the ratio of the volume of the ossified area to the volume of the entire area.

This case was an 84-year-old female. (a) The left second costal cartilage, including the sternum and the rib, was manually extracted using volume rendering (VR). (b) Maximum intensity projection image with a window width (WW) of 450 and a window level (WL) of 1,500. (c) Manual extraction of costal cartilage from the image in (b). (d) Automatic extraction of costal cartilage from the VR image with a WL of 80. (e) Automatic extraction of the area of calcification from the VR image with a WL of 180.
To assess inter-observer error, we chose two individuals who had not previously used the 3D workstation to analyze the second and fourth costal cartilages of both ribs from 10 randomly chosen cases that were not part of the 136 study cases. The methods were explained to these individuals both verbally and with written documentation. I also analyzed the samples. The three observers calculated the mean HU and percentage of calcification for each cartilage, and the numerical values were examined by Intraclass Correlation Coefficient (ICC) analysis. The presence or absence of calcification close to the sternal attachment area was also judged by these three observers.
Statistical analysisThe Mann-Whitney U test and the Kruskal-Wallis test: The mean HU and percentage of calcification are not normally distributed. The Mann-Whitney U test was used to determine significant sex differences for the mean HU and percentage of calcification for each cartilage in the 10-year groups. The Kruskal-Wallis test was used to determine significant differences in mean HU and percentage of calcification for each costal cartilage in each 10-year group by sex. P < 0.05 was considered to indicate statistical significance. Analyses were carried out with Microsoft Excel 2010 with the Analysis ToolPak add-in.
Bayesian statisticsUsing Bayes’ theorem, we created an estimation table showing the distribution of posterior probability in each age group. Bayesian statistics consist of prior probability, likelihood, and posterior probability. In age estimation, prior probability, P (Agei), is the probability of an individual belonging to a defined age group without any additional information (Lucy et al. 1996). In this study, P (Agei) was the prior probability based on the age distribution of consecutive forensic autopsy cases for which postmortem CT was performed at our institution from January 2013 to September 2015 (n = 1,206; 783 males, 424 females; Table 1). The 136 cases that were part of this study were not included in the prior probability distribution. The likelihood, P (I|Agei), is the conditional probability of the observed information, I, given any hypothesis is true (Lucy et al. 1996). In this study, P (I|Agei) indicates the probability of that the proportion of the observed average HU (or ossification rate) exists within a specified average HU (or ossification ratio) distribution in each age group.
The posterior probability, P (Agei|I), is the conditional probability of the hypothesis being true given the observed information (Lucy et al. 1996). In other words, P (Agei |I) is the probability of the individual being in a particular age group i if the mean HU I is observed. We use j to refer to all of the i groups together (Sakaue 2015).
Bayes’ theorem states that the posterior probability is proportional to the prior probability multiplied by the likelihood (Lucy et al. 1996; Sakaue 2015). The formula can be expressed as follows:
 | (1) |
If several values are used, Equation 1 can be rewritten as:
 | (2) |
By assuming conditional independence of the observed measurements in each age group, Equation (2) can be rewritten (Lucy et al. 1996; Sakaue 2015) as:
 | (3) |
After numerous observations are evaluated, all the probabilities for the distribution of age categories can be estimated from the observed data with Equation (3) for each individual (Lucy et al. 1996; Sakaue 2015).
In this Bayesian approach, the total data of the mean HU and the percentage of calcification for each case could be freely classified to create the estimation table. In this study, we sought to classify the data between 3 and 5 classes based on the mean HU and percentage of calcification using a scoring system. As the number of classes increased, the number of cases in the class decreased, and as the influence of variation, the hit rate is lowered. We first sorted the 136 study cases by sex and probable age in ascending order, and then classified the data into groups. We found that as the number of classes increased (i.e., 4 or 5 groups), the number of cases in each class decreased, and this affected both the degree of variation and the hit rate, with too few cases in some of the classes. Therefore, we found that the best compromise was to use three classes. The first class (score 1) included the lowest (1st) to the 23rd highest value cases from among the 70 male cases and the 1st to 22nd cases from among the 66 female cases. The second class (score 2) included the 24th to 46th highest value cases from among the remaining 47 male cases and the 23rd to 44th highest value cases from among the remaining 44 female cases. The third class (score 3) incorporated the remaining cases. The likelihood for each age group having all three classes was calculated for each sex. In addition, the presence or absence of calcification close to the sternal attachment region was calculated as a likelihood value for every age group (the presence of calcification has a score of 1, and the absence of calcification has a score of 0). In summary, we created 12 scoring systems: 4 systems for the mean HU of the costal cartilage of both the second and fourth ribs, 4 systems for the percentage of calcification for the same cartilage regions, and 4 systems for the presence or absence of calcification in the same cartilage regions.
An age estimation table was created with each likelihood value, which could be used to estimate the posterior probability in each group. We examined the validity of this estimation table by comparing the actual age of 20 males and 20 females with the posterior probability of being placed in each age group.

Prior probability using male and female populations.
“Autopsy bodies” refers to the total number of bodies imaged by CT scanning from January 2013 to September 2015 before autopsy. There were 782 males and 424 females (total, 1,206 bodies). The prior probability is the distribution of cases based on their ages (20s to 80s) divided by the total number.
For our assessment of inter-observer error for the three observers, ICC values for the mean HU and percentage of calcification were 0.9962 and 0.9813, respectively. Only one costal cartilage image resulted in different judgments among the observers: two observers judged that the calcification was present, and the other did that there was no calcification. For the other 39 costal cartilages, the observers were in complete agreement.
The Mann-Whitney U test showed that mean HU and percentage of calcification were significantly higher (P < 0.05) for females than those for males in the 60s, 70s, and 80s age groups in the left and right forth costal cartilages, except for t the fourth costal cartilage in the 80s group on the left side. There were no significant sex differences with regards to mean HU or percentage of calcification for the left and right second costal cartilages among the age groups.
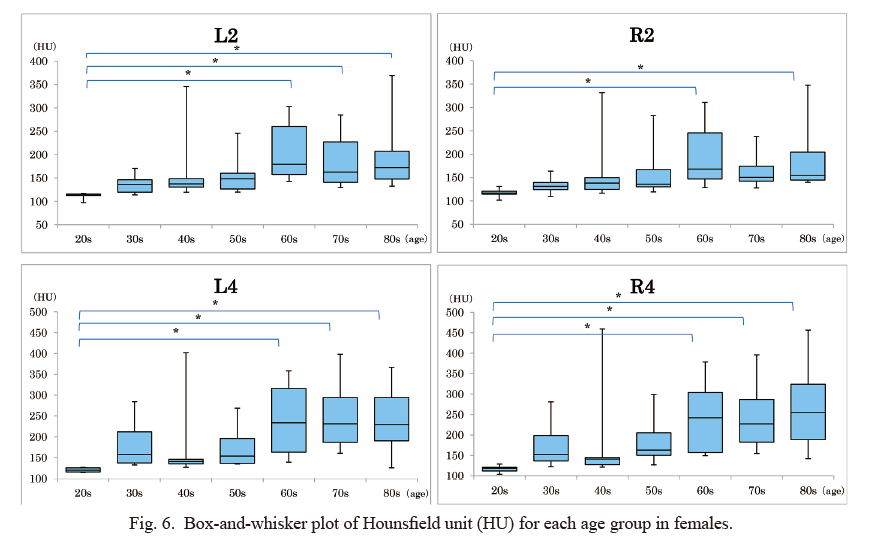
Overall, the mean HU and percentage of calcification seemed to increase with age for both sexes (Figs. 2 and 3). In males, however, there were significantly differences (P < 0.05) only between cases in their 20s and 70s and cases in their 20s and 80s with regards to mean HU, and between cases in their 20s and 70s with regards to percentage of calcification in both second costal cartilages. There were no significant differences among each age group with regards to mean HU and percentage of calcification for the left and right fourth costal cartilages. In females, we measured significant differences (P < 0.05) between cases in their 20s and 60s, 20s and 70s, and 20s and 80s with regards to mean HU and percentage of calcification for the left second and both fourth costal cartilages. In addition, we found significant differences (P < 0.05) among female cases in their 20s and 60s and in their 20s and 80s with regard to the mean HU for the right second costal cartilage.
Despite these trends, there was marked variation across individuals within many age groups (Figs. 4, 5, 6 and 7). Fig. 8 shows a scatter plot of all 136 study cases for the mean HU and percentage of calcification. The coefficient of determination (R2) was greater than 0.8 in all four regions, and we determined a positive correlation between the mean HU and the percentage of calcification.
Based on our Bayesian calculations, only 15 out of 40 sample cases had the highest probability of correctly estimating age group, including eight of 20 males (40%) and seven of 20 females (35%) (Table 2). The hit rate when using three consecutive age groups (i.e., the highest probability age group plus one age group on either side) reached 65% for male cases (n = 13) and 75% for female cases (n = 15) (Table 2). However, in five cases, the actual age was not included in any of the estimated age groups. These were three males aged 42, 58, and 88 years, and two females aged 65 and 75 years in whom a widespread area of costal cartilage was not ossified.

The mean HU was significantly higher for females (P < 0.05) than males in the 60- to 80-year age ranges for the left and right second and fourth costal cartilages, except for the 80s group and the left fourth costal cartilage. For males, there were significant differences (P < 0.05) between cases in their 20s and 70s and cases in their 20s and 80s for both second costal cartilages. In females, there were significant differences (P < 0.05) between cases in their 20s and 60s, 20s and 70s, and 20s and 80s for the left second and both fourth costal cartilages, and between cases in their 20s and 60s and cases in their 20s and 80s for the right second costal cartilage.
L: left, R: right, 2: 2nd cartilage, 4; 4th cartilage.

The percentage of calcification was significantly higher for females (P < 0.05) than for males, as noted for the mean HU. In males, there were significant differences (P < 0.05) between cases in their 20s and 70s with regards to percentage of calcification in both second costal cartilages. In females, there were significant differences (P < 0.05) between cases in their 20s and 60s, 20s and 70s, and 20s and 80s with regards to percentage of calcification in the left second and both fourth costal cartilages.
L, left; R, right; 2, 2nd cartilage; 4, 4th cartilage.

L, left; R, right; 2, 2nd cartilage; 4, 4th cartilage. *P < 0.05.

L, left; R, right; 2, 2nd cartilage; 4, 4th cartilage. *P < 0.05.
L, left; R, right; 2, 2nd cartilage; 4, 4th cartilage. *P < 0.05.

L, left; R, right; 2, 2nd cartilage; 4, 4th cartilage. *P < 0.05.

Scatter plot of all 136 study cases with the percentage of calcification on the y-axis and mean HU on the x-axis. The coefficient of determination (R2) was greater than 0.8 in all four regions, and there was a strong correlation between mean HU and the percentage of calcification.
L, left; R, right; 2, 2nd cartilage; 4, 4th cartilage.

Posterior probability table based on age estimation.
Gray cells show three consecutive age groups that include the highest probability age group plus one age group on either side. When the highest probability age group is the 20s or 80s groups, the three consecutive age groups are 20s, 30s, 40s, and 60s, 70s, 80s, respectively. When a posterior probability of 0 is included in any of the three age groups, that age group was deleted and only two groups are shown. If the actual age was included in the gray cells, it was assumed that age estimation was carried out correctly.
M, male; F, female.
In regard to the mean HU and percentage of calcification, we observed marked individual differences in many of the age groups, and this variability makes it difficult to estimate age. Therefore, we considered the utility of Bayesian statistics to create a reference age estimation table. Bayesian statistics can be applied effectively to a population that contains highly variable individual data. When using a Bayesian method, establishing the prior probability is essential. Recently, Aramaki et al. (2017) challenged the mode of analysis of thyroid cartilage ossification using Bayesian estimation and CT imaging to estimate age at death. The present study echoes the viewpoint raised by Aramaki and colleagues that Bayesian estimation could be a useful tool for age determination studies. Given that different parts of the body are often found at crime scenes, it is important to confirm that other regions can be similarly used for age estimation. In this study, I used the age distribution of consecutive forensic autopsy cases from our institution for which there were available postmortem CT data to estimate the prior probability. Konigsberg et al. (2008) said that if appropriate prior age-at-death distributions are used, the analysis will provide an accurate estimation.
Here, we sought to apply our findings to estimate age in forensic cases, except for cases with severely decomposed bodies. In our institutions, severely decomposed bodies do not undergo CT scanning. In addition, this study primarily focused on confirming whether Bayesian estimation could be useful for estimating age using CT imaging. However, the field of forensics often requires age estimation to be carried out on bodies at various stage of decomposition. Therefore, for its broader applicability in the field, it will be important to extend upon the current work using costal cartilages at various stages of decomposition to estimate age.
In the present study, to verify prior probability, we measured the age composition of a male population in Japan of 2016, and we found little difference in the results. We selected 20 males and 20 females from our autopsy cases (one to four individuals per age group) and entered these cases into the age estimation table (consisting of the 136 study cases). Among these 40 cases, we were unable to correctly classify the actual age for three males and two females (Table 2). However, we noticed that calcification was lower than would be expected for the age in each of these five cases. This scenario could easily occur when the reference population does not include samples that greatly deviate from the mean. As stated above, costal cartilage calcification can differ markedly across individuals, so this outcome is not surprising. The advantage of Bayesian estimation is that one can sequentially update the reference estimation table by adding more data, as they are collected. Using this updated table, the age of the next case could be estimated more accurately.
In Bayesian statistics, probability forms a distribution for individuals who have similar characteristics. The age group with the highest probability does not directly correspond to the most probable age group. In practice, however, we have shown that it would be reasonable to consider the age group with the highest probability as the actual age group. In 40 samples (20 males and 20 females), we had matches for highest probability age and actual age for only eight males (40%) and seven females (35%) (Table 2). We hypothesize that the proportion of correct matching might be low because of the 10-year-unit cut offs. For example, a 39-year-old or 50-year-old individual may have characteristics of the 40-year age group, rather than their actual age groups of 30s or 50s. Thus, if the range of age groups is extended, we would expect an increase in the percentage of correctly matched cases. Indeed, when we considered three consecutive age groups, the number of correctly matched cases reached 13 for males (65%) and 15 for females (75%) (Table 2). Iscan et al. (1984a) claimed that costal cartilages can be used for estimating ages under 30 years (range of 3 to 5 years) and over 30 years old (range of 8 to 13 years) in males, and under 31 years (range, 4 to 6 years) and over 33 years (range, 11 to 15 years) in females (Iscan et al. 1985). However, the authors note that the estimation error is large for cases over 40 years (Cerezo-Roman and Hernandez Espinoza 2014; Haj Salem et al. 2014) and this is also associated with a larger inter-observer error. There are few methods to estimate age in older people because of large individual differences (Kimmerle et al. 2008; Fanton et al. 2010; Hartnett 2010). Our method offers a solution to this, and allows us to better estimate age without bias in all ages with low inter-observer error.
Our image processing procedure is a limitation of this study. The mean HU is the average tissue absorbance by volume, which can vary depending on the size and characteristics of the subject and the CT parameters. The age estimation table we created for this study may not be directly applicable to CT images taken at other institutions. Thus, each institute might need to create its own estimation table.
In general, when performing age estimations, it is more common to include a broader age range to reduce the risk of exclusion. Individual differences in costal cartilage calcification can be large, and it is difficult to use traditional methods of age estimation without introducing observer error. Based on our results, it seems that our method was effectively free from inter-observer error. We anticipate that Bayesian statistics could be used in conjunction with other techniques in the field to help ascertain age at death, particularly in cases that prove difficult to solve with conventional methods alone.
The author wishs to acknowledge Dr. K. Sakaue, National Museum of Nature and Science, for his valuable advice and constructive discussion and Dr. A. Usui, Departments of Diagnostic Image Analysis Tohoku University Graduate School of Medicine, for technical assistance with the experiments. I also grateful to Dr. M. Funayama, Professor of Departments of Forensic Medicine Tohoku University Graduate School of Medicine, for his help in interpreting the significance of the results of this study.
The author declares no conflict of interest.