Abstract
Oral fat sensitivity (OFS), the ability to taste fat, is associated with eating habits in humans, including daily fatty food consumption; namely, proper OFS is important for health. In addition, lifestyle factors, such as stress and sleep, may affect fat intake. However, correlations between OFS, stress management, and sleep are largely unknown. Thus, we investigated the associations of OFS with lifestyle factors regarding stress management and daytime sleepiness in healthy young adult men. We measured OFS, sensitivities for three prototypical tastes (sweet, salty, and sour), and BMI in 22 subjects (27.2 ± 6.0 years), who also completed a self-reported questionnaire on health, including lifestyle-related questions. The correlations of taste sensitivities with stress management and daytime sleepiness were analyzed. We thus found that the number of mentors for personal concerns (a question regarding stress management, social support) was positively associated with OFS (P = 0.041), but not the other taste sensitivities. In contrast, other lifestyle factors related to stress management (frequency of relaxation, frequency of eating when irritated or worried, and degree of satisfaction with one’s sleep) and daytime sleepiness were not significantly associated with OFS, similar to that observed for other tested taste sensitivities. These results characterize the unique association of OFS with the degree of social support in healthy young men and provide novel insights into the nature of individual OFS differences. Thus, measuring the degree of social support may be helpful for the evaluation of OFS impairment, thereby contributing to the prevention of stress-induced overeating.
Introduction
Oral sensory perception may play an important role in driving food intake and energy balance. Sleep alterations perturb energy balance by disrupting appetite hormone regulation, increasing energy intake, and decreasing physical activity (Martínez-Ruiz et al. 2014; Loper et al. 2015; Smith et al. 2016). The importance of sleep and its influence on both intake and expenditure has been acknowledged in the last decade in both experimental and epidemiological studies (Kant and Graubard 2014; Smith et al. 2016).
Humans can perceive five prototypical taste qualities: sweet, salty, bitter, sour, and umami (Hettinger et al. 1996; Schiffman 2000; Satoh-Kuriwada et al. 2014; Zhang et al. 2017). Sensing taste is achieved at the level of taste receptor cells found in the surface regions of the oral cavity and clustered in the taste buds. The taste buds are small structures on the tongue and soft palate that allow particular taste recognition of drink and foods (Bachmanov and Beauchamp 2006; Janssen and Depoortere 2013). In contrast, the response to fat stimulation in the oral cavity was previously considered to rely largely on olfactory, textural, and post-ingestive cues. However, fatty acid taste (the taste of free fatty acids, but not triacylglycerides) has recently been suggested as a new basic taste (Costanzo et al. 2017). In fact, accumulating evidence indicates that long-chain fatty acids, such as oleic acid (OA, C18H34O2, a monounsaturated fatty acid found in many vegetable and animal oils), elicits a unique, perceptive sensation at concentrations relevant to the modern food supply (Running et al. 2015). Several studies have reported a difference in the OA detection threshold among human individuals and an inverse correlation between the body mass index (BMI; the weight in kilograms divided by the square of the height in meters [kg/m2]) and oral fat sensitivity (OFS), the ability to taste fat (Stewart et al. 2010, 2011; Haryono et al. 2014; Martínez-Ruiz et al. 2014; Asano et al. 2016). However, other studies failed to detect a significant association between BMI and OFS (Tucker et al. 2017). The reasons for the contradictory results are largely unknown, and more studies in this area are essential for a better understanding of the topic (Martínez-Ruiz et al. 2014). On the other hand, several studies proposed that fatty acid taste sensitivity is associated with fatty food consumption (Stewart et al. 2010, 2011) or other eating habits, including satiety after food intake (Asano et al. 2016; Costanzo et al. 2017), suggesting the existence of unique regulatory mechanisms of OFS in the body. In addition, an intervention study showed that fat taste threshold increased when participants were exposed to a low-fat diet over a four-week period. The report also showed that fat taste threshold decreased when participants were exposed to a high-fat diet over the same period (Stewart and Keast 2012), indicating that recent fat intake can modulate OFS in individuals.
Taste thresholds are not simply defined by genetics. Instead, they may be modulated by various biological and environmental factors, such as endogenous hormones, consumption of certain foods, BMI, smoking and alcohol consumption, aging, emotional states, sleep habits, and exposure to pathogens (Furchtgott and Willingham 1956; Wright 1973; Nakagawa et al. 1996; Mojet et al. 2003; Verma et al. 2005; Donaldson et al. 2009; Umabiki et al. 2010; Al’Absi et al. 2012; Karita et al. 2012; Platte et al. 2013; Loper et al. 2015; Noel and Dando 2015; Smith et al. 2016). For example, leptin, a hormone that has a major influence on energy balance and suppresses food intake, may affect sweet taste sensitivity (Ninomiya et al. 1995, 1998; Umabiki et al. 2010). The threshold for sour taste, but not sweet or salt taste, was significantly raised after sleep deprivation (Furchtgott and Willingham 1956).
Stress is an undeniable part of life and can be defined as a negative emotional experience accompanied by behavioral, biochemical, and physiological changes. Stress can be induced by various factors, such as insufficient sleep and insecurity in one’s personal, social, and professional life (Baum 1990; Geiker et al. 2018). Two systems, the autonomic sympathetic-adrenal system, and the hypothalamic-pituitary-adrenal (HPA) axis (a neuroendocrine unit comprising the hypothalamus, the pituitary gland, and the adrenal glands that control levels of cortisol and other stress related hormones, are considered to be the main neuroendocrine systems involved in the integrated stress response (Maggio et al. 2013). Cortisol is a primary stress hormone, produced by adrenal glands and is a powerful regulator of all mammalian physiological systems. This hormonal signal is utilized by almost all cells and physiological systems to optimize performance in accordance with circadian, environmental, and physiological demands. Thus, disturbances in normal HPA axis activity profiles are associated with various kinds of physiological and mental health disorders (Spencer and Deak 2017). In addition, research suggests that emotion regulation and HPA axis activity are causally correlated, such that HPA activation and regulation both influence, and are influenced by, emotions (Stansbury and Gunnar 1994; Kamradt et al. 2017).
Stress is associated with both increased food intake (emotional eating) and decreased food intake (Greeno and Wing 1994). The existence of these opposite patterns of food intake is considered to be a result of changes in the stress reactivity of the HPA-axis with chronic stress accompanied by hormonal changes in the body. Chronic stress may ultimately disrupt the regulatory effects of the HPA axis on stress-induced eating (Klatzkin et al. 2018). The blunted HPA-axis stress reactivity (typically indicated by low cortisol level) is suggested to be associated with stress-induced emotional eating in both animal and human studies (van Strien et al. 2013; Bast and Berry 2014). In addition, sleep has a detectable modulatory effect on HPA axis activity and other hormonal axes (Maggio et al. 2013). It has been well-documented that sleep displays a close and reciprocal relationship with HPA axis function: elevated HPA activation results in lighter sleep and more nocturnal awakenings, whereas inadequate sleep enhances the basal activity of the HPA axis (van Dalfsen and Markus 2017).
Social support, which is defined as the resources provided by one’s network with the intention of increasing one’s coping ability (Cohen 2004; Kwan and Gordon 2016), is considered as a psychosocial factor that has a significant impact on human health (Ehsanbakhsh et al. 2016). For instance, for social animals, including humans, there is much evidence that individuals who maintain stable, close social bonds have better health compared with those who do not (Wittig et al. 2016). In addition, a study suggested that social support in diabetic patients enables them to decrease their stress and cope with stressful events of their lives, as well as to control blood glucose levels and manage the disease (Fukunishi et al. 1998). An important mechanism through which these benefits could operate is through social buffering (a phenomenon observed among highly social mammals where a social partner can attenuate the release of stress hormones such as cortisol through mediation of the HPA axis in response to a threatening situation), in which social support provided by social partners cushions the adverse effects of stressful events (Cohen and Wills 1985; Kikusui et al. 2006; Hennessy et al. 2009; Sullivan and Perry 2015; Wittig et al. 2016). In addition, psychologically and physically induced repeated stress can cause dysregulation of the HPA axis, which can lead to severe health problems; however, social buffering during stress exposure has regulatory, stabilizing effects on HPA activity (Wittig et al. 2016).
Previously, we reported that healthy young Japanese adults who sense satiety easily after food intake have a lower threshold for OA (Asano et al. 2016). We also reported that the saliva flow rate was raised by OA stimulation in the oral cavity in healthy young adults (Izumi et al. 2016). However, the association of OFS with stress or sleepiness is still largely unknown. We investigated the association of various lifestyle factors regarding stress management (rather than testing the temporal status of stress per se) and daytime sleepiness with OFS and the sensitivities of three prototypical tastes (sweet, sour, and salty) using data of self-reported questionnaires from healthy young adult men; women were not included owing to potential confounding by hormonal changes during the menstrual cycle.
Materials and Methods
Subjects
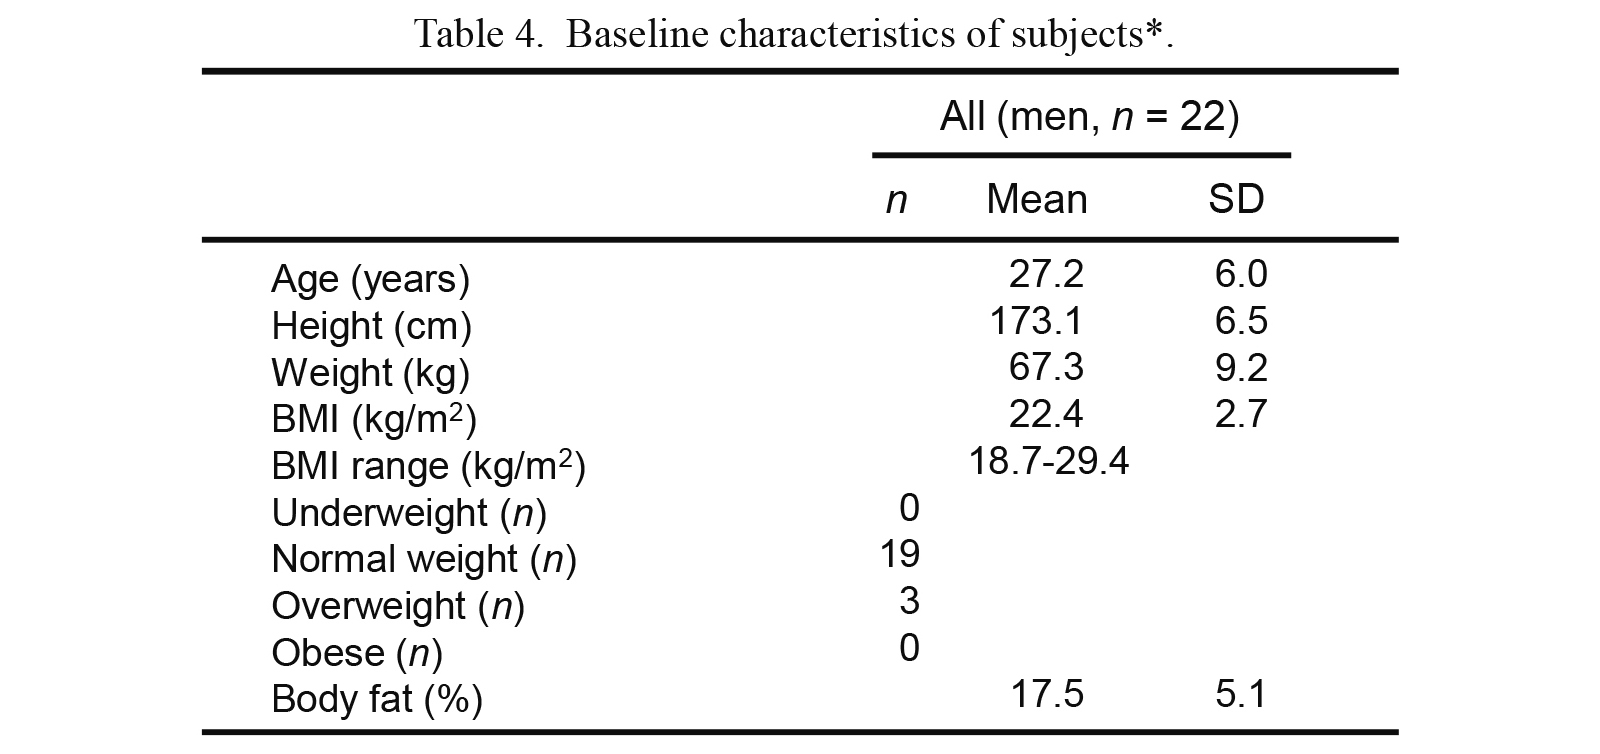
The subjects of the study were non-medicated, non-smoking young adult men between 20 and 39 years of age, who were normal weight or overweight but not underweight (BMI < 18.5 kg/m2) or obese (BMI ≥ 30 kg/m2) and also were in good health at the time of testing. Age, BMI, and sex of the subjects were limited as described above due to attenuate the influence of aging, degree of obesity, and female sex hormones on taste thresholds and other health conditions. Subjects were limited to non-medicated, non-smoking men because medications and smoking affect physiological functions of both the stomatognathic system (including taste perception system) and the central nervous system. Forty-six young adults were recruited as candidate subjects through public advertisements. Twenty-four candidate subjects were excluded because they did not meet the selection criteria or did not complete all of the tests for the study. The data of the remaining 22 adults (mean age 27.2 ± 6.0 years; range 20-39) were analyzed.
Study outline
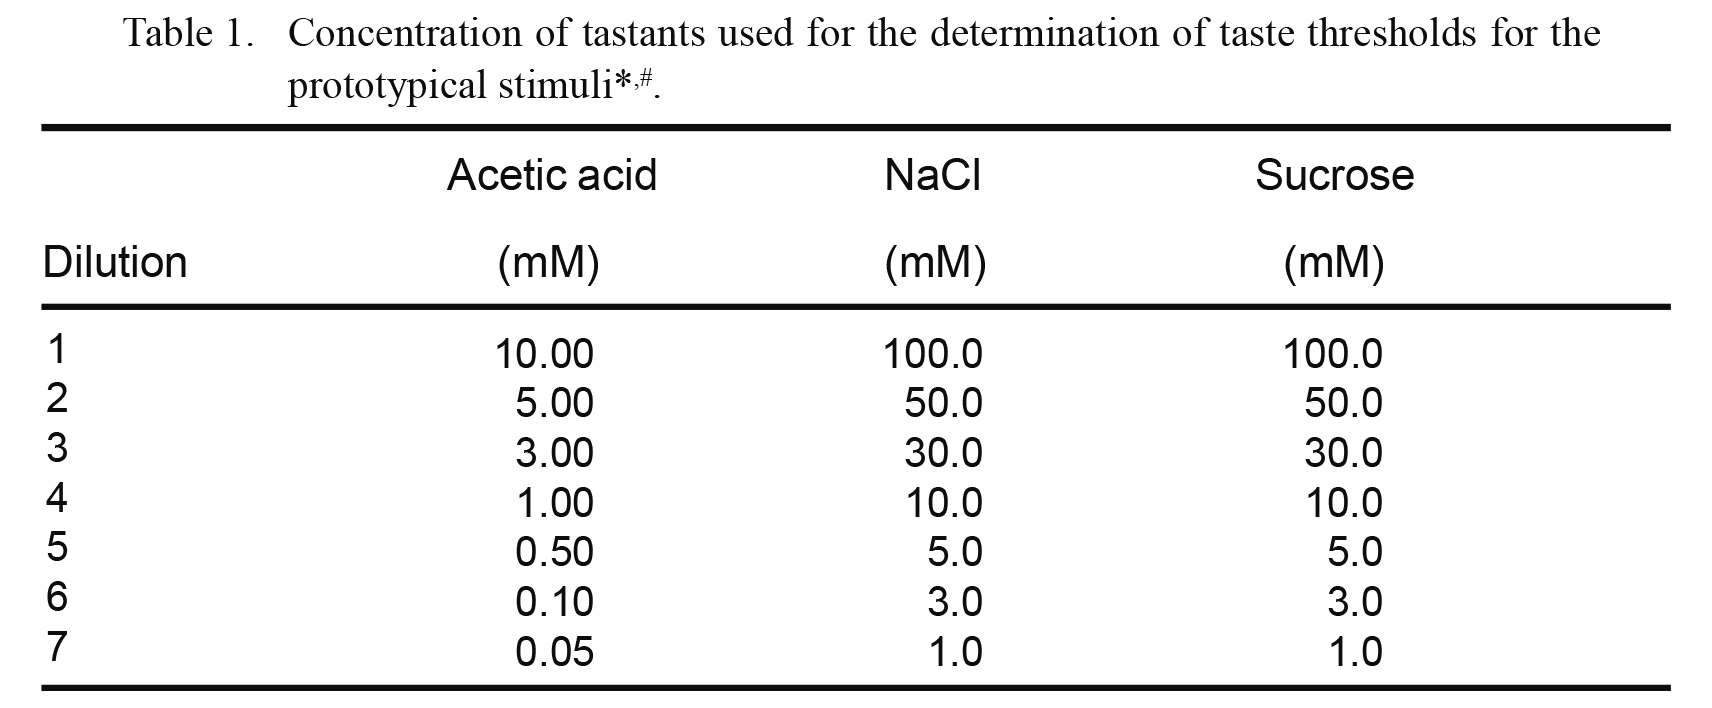
Candidate subjects attended the laboratory at the Tohoku University Graduate School of Dentistry and completed a self-reported questionnaire that obtained information on their health conditions, including lifestyle factors related to stress management. Each subject’s height, weight, BMI, and body fat percentage (the proportion of fat to the total body weight) were measured using a handcrafted stadiometer and a body composition monitor (Inner Scan 50; Tanita, Tokyo, Japan). The subjects participated in the following tests: (a) a taste test for thresholds for the prototypical tastants using sucrose, salt (NaCl), acetic acid, and other tastants that were not used for the analysis of the present study and (b) a taste test for OA thresholds.
All experiments were conducted according to the institutional guidelines and the Declaration of Helsinki. We obtained ethic approval for the study from the Ethics Committee of Tohoku University Graduate School of Dentistry. All subjects provided written informed consent prior to participation.
Measurement of OA detection thresholds
The measurement of OA detection thresholds is described in detail by Asano et al. (2016). Briefly, the test stimuli for OFS consisted of an emulsion of food grade OA (Sigma-Aldrich, MO, USA) in non-fat milk (Morinaga Milk Industry, Tokyo, Japan). An OA sample was freshly prepared for every session by a previously established method (Stewart et al. 2010; Haryono et al. 2014; Asano et al. 2016). To prepare different concentrations (0.02, 0.06, 1, 1.4, 2.8, 3.8, 5, 6.4, 8, 9.8, and 12 mM) of the OA sample, varying amounts of liquid OA were added to 12% (w/v) powdered non-fat milk and mixed. In addition, all of the preparations were mixed with 5% (w/v) gum arabic (acacia gum; Wako Pure Chemical Industries, Osaka, Japan) and 5% (w/v) liquid paraffin (Wako Pure Chemical Industries) to mask lubricity cues (Stewart et al. 2010; Haryono et al. 2014; Asano et al. 2016; Izumi et al. 2016). To prevent oxidation, each sample was mixed with 0.01% (w/v) ethylenediaminetetraacetic acid (EDTA; Dojindo Laboratories, Kumamoto, Japan). After addition of distilled water, the samples were emulsified for 12 min at 7000 rpm with an HM-310 homogenizer (As One, Tokyo, Japan) at room temperature. The vehicle was prepared in the same manner without added OA.
For each sample set, three samples were provided at room temperature to the subjects, two controls and one containing OA in ascending order (0.02 mM to 12 mM). The OA threshold was defined as the minimum OA concentration required for a participant to repeatedly and correctly identify the OA sample as “odd” compared to the two control samples. All tests were performed with the subjects wearing blinders and nose clips to minimize olfactory cues caused by volatilized OA. Subjects with missing values owing to the loss of taste were excluded from the subsequent correlational analysis. Subjects were requested to refrain from eating 2 h before testing. They were also asked to sit during the experiment and rinse their mouths with distilled water before tasting each sample.
Measurement of sensitivities to prototypical tastants
The measurement of sensitivities to prototypical tastants is described in detail by Asano et al. (2016). In brief, sample water solutions for sour, salty, and sweet tastants were prepared using acetic acid, salt, and sucrose, respectively, at the concentrations listed in Table 1. Each tastant was purchased from Wako Pure Chemical Industries. Subjects were presented with a set of seven solutions for each prototypical tastant, arranged in ascending order of concentration. The subjects took 1 mL of each solution into their mouths, expelled it shortly afterward, and then selected from the following options: (1) the solution tastes like water, (2) the solution tastes like something other than water, or (3) the solution has a specific taste. The recognition threshold was defined as the minimum concentration of a compound required for the subject to accurately identify the specific tastant. Subjects with missing values owing to the loss of taste were excluded from the subsequent correlational analysis. Subjects were requested to refrain from eating 2 h before testing. They were also asked to sit during the experiment and rinse their mouths with distilled water before tasting each sample.
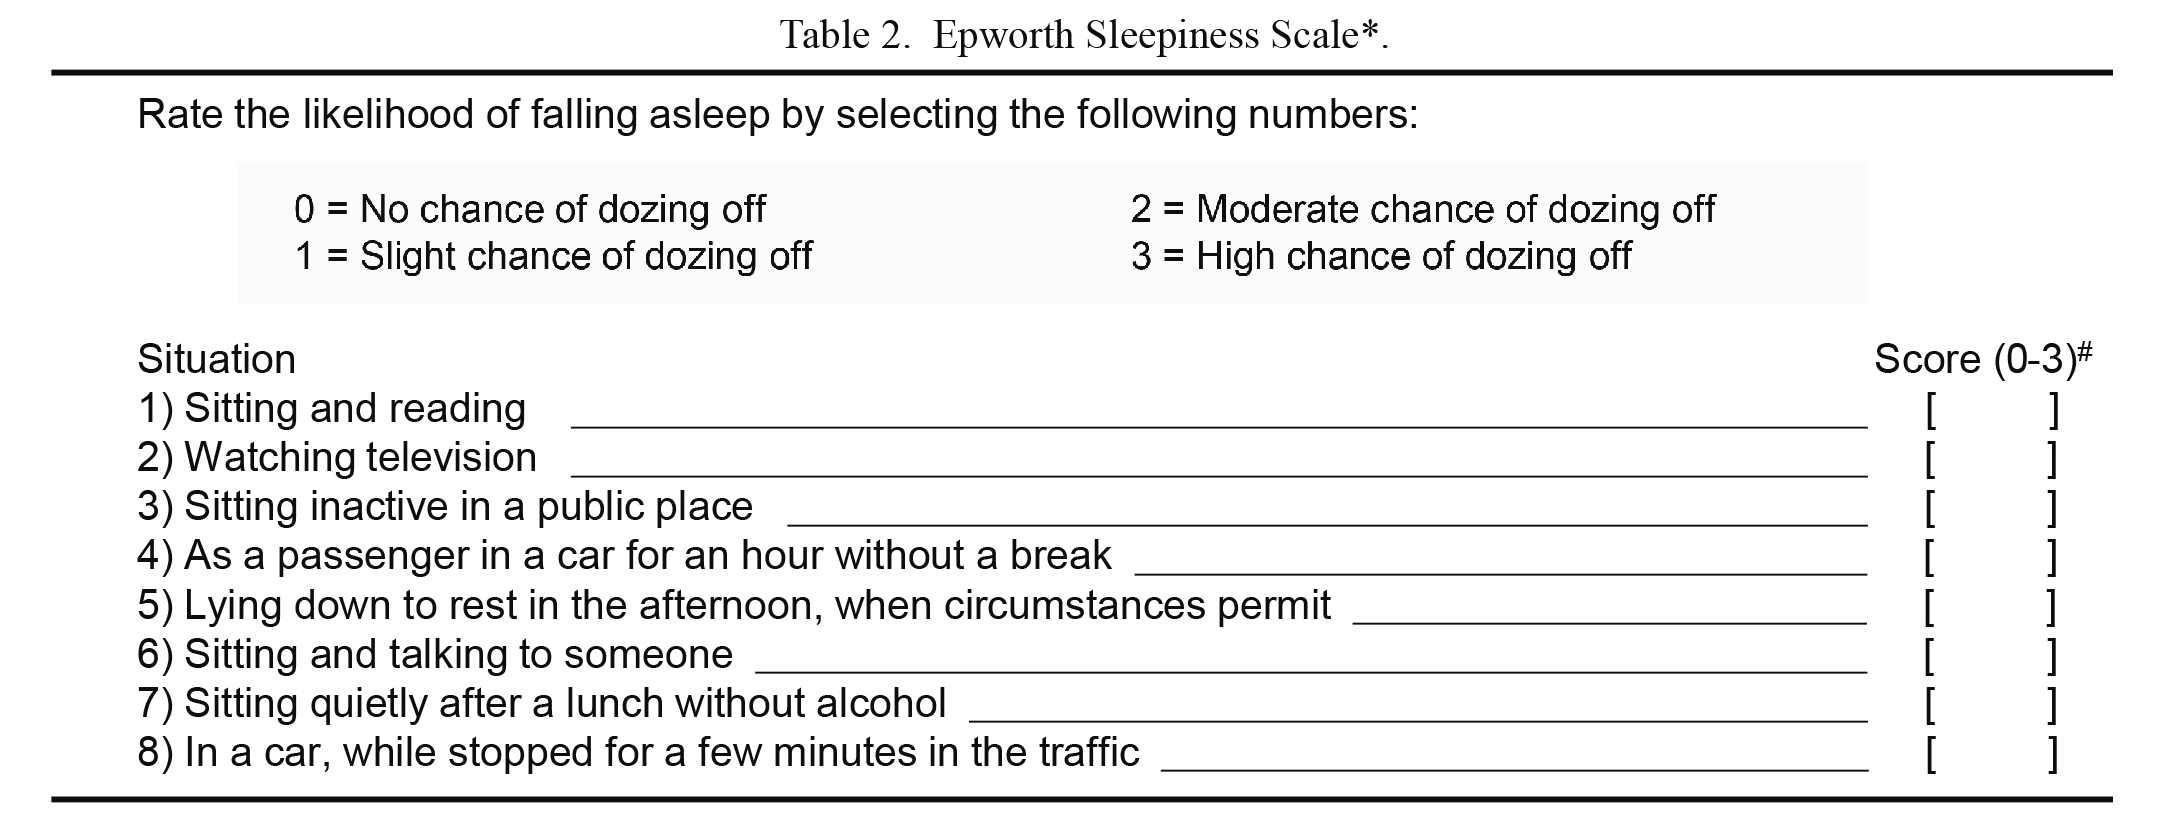
The ESS score was calculated based on a self-reported questionnaire to evaluate the degree of daytime sleepiness felt by each subject as described before (Izumi et al. 2016). The subjects were asked to rate the likelihood of falling asleep on a scale from 0-3 in each of the eight situations in Table 2. The ESS score was the sum of the eight item scores. An ESS score of 10 was adopted as the cutoff for normal sleepiness, with scores > 10 regarded as indicating excessive sleepiness (Johns 1991, 1994; Hossain et al. 2005).
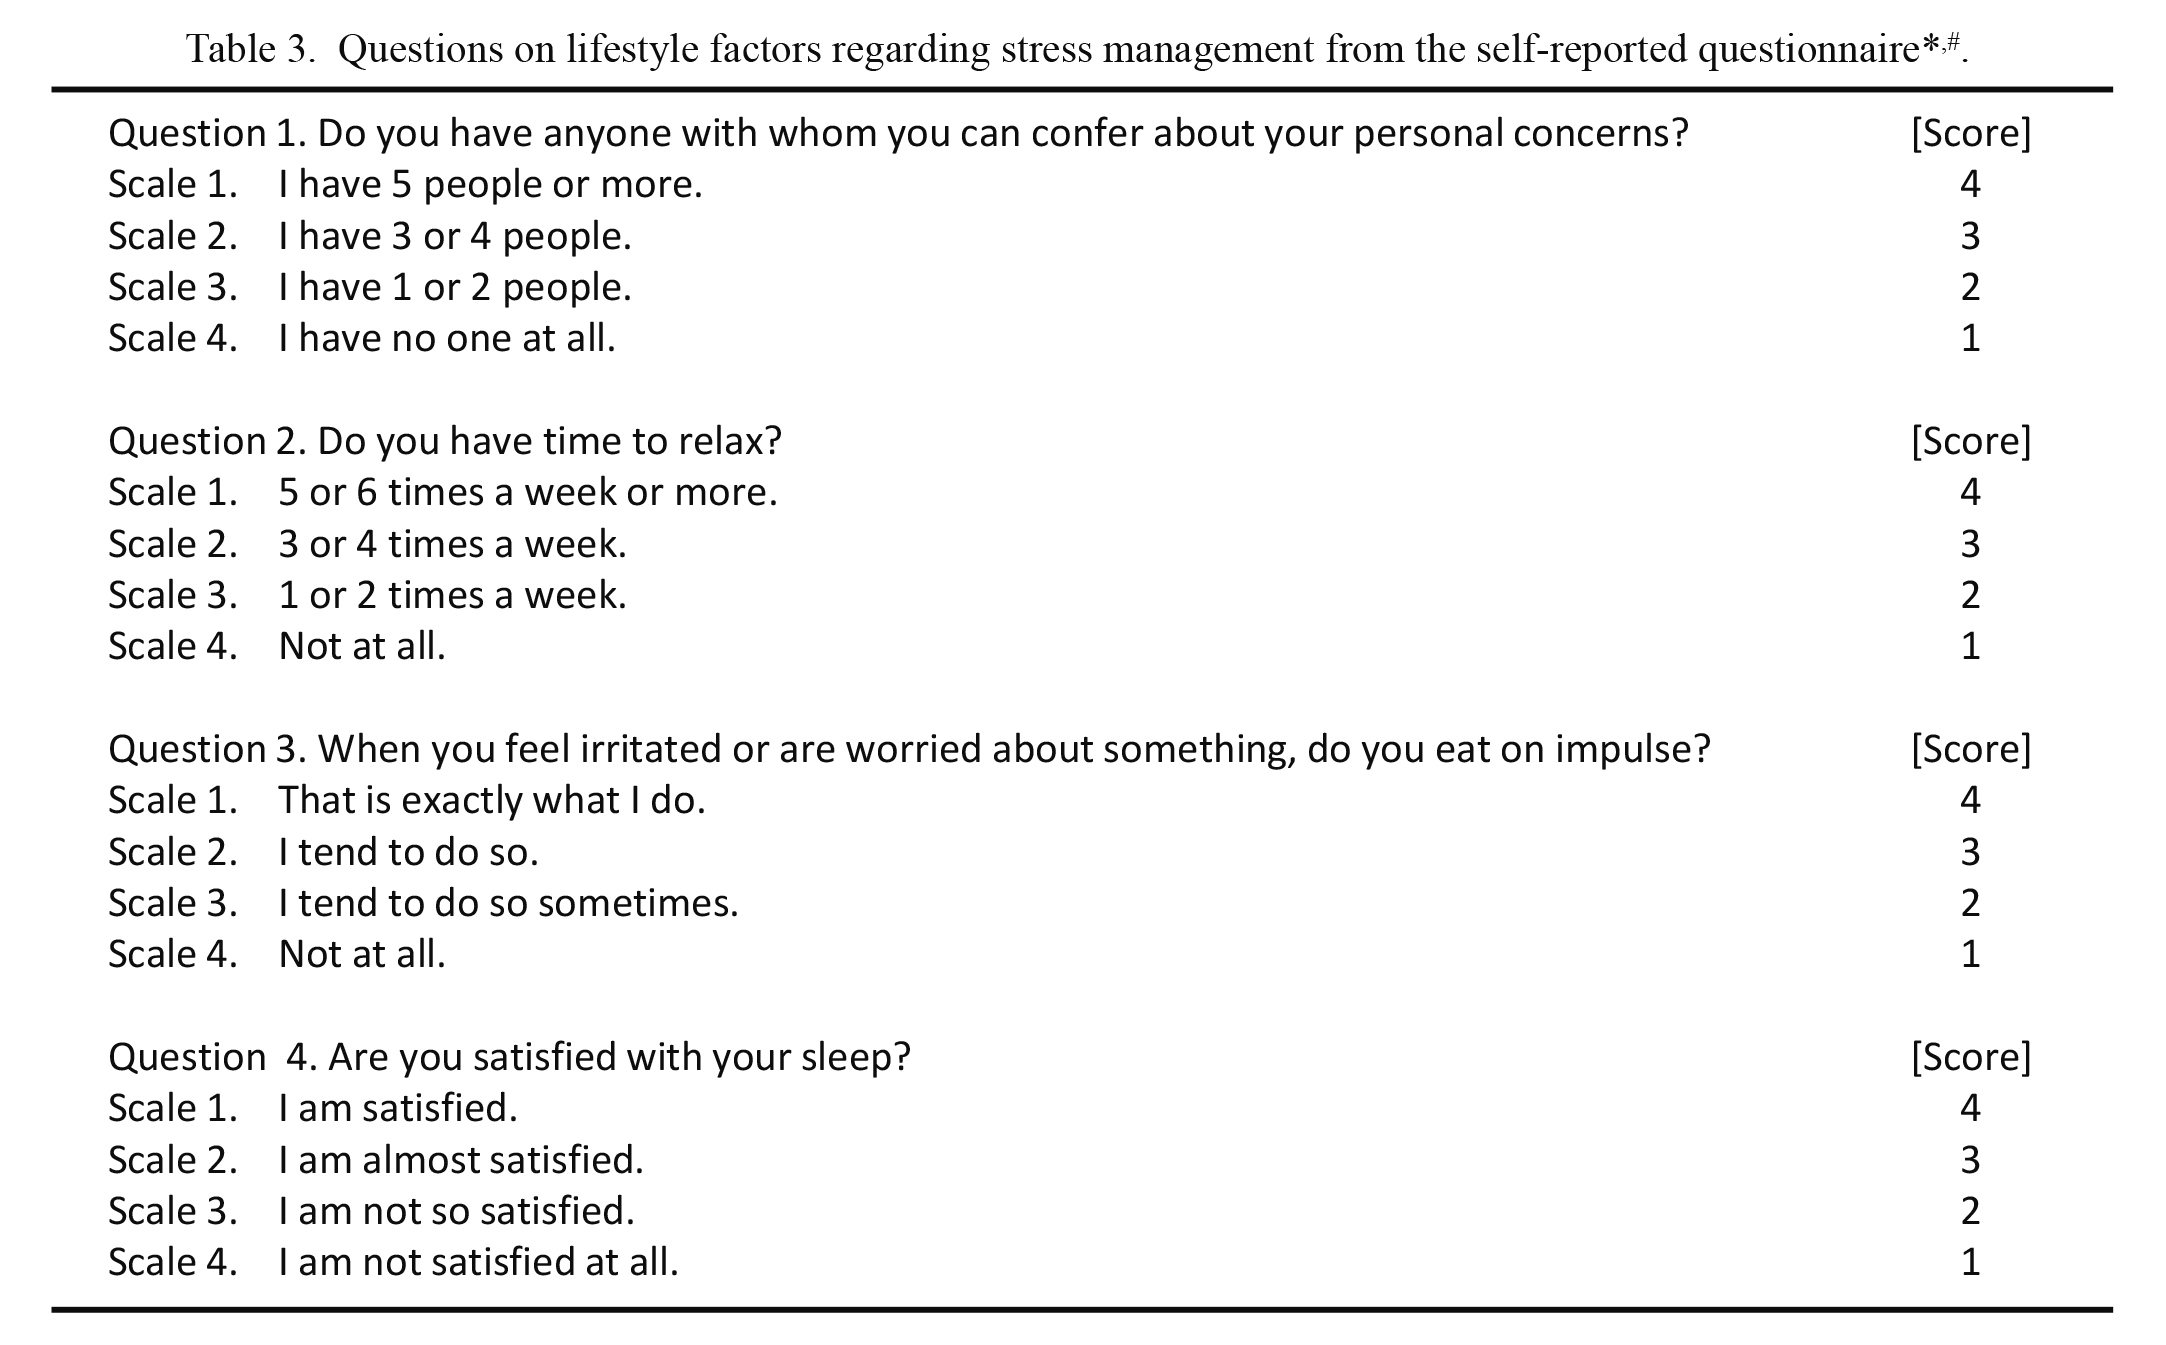
The subjects were also asked to rate certain lifestyle factors regarding stress management using a self-reported questionnaire, detailed in Table 3, on a scale of 1-4; responses were used to evaluate lifestyle habits concerning how subjects face or cope with stress. Of the four questions, question 1 was included for evaluating the number of mentors in one’s social support network for dealing with personal distress. Social support can help manage and buffer one’s stress and influence stress-induced emotional food intake (Torres and Nowson 2007; Kwan and Gordon 2016; Darling et al. 2017). Question 2 was selected for evaluating the frequency of relaxation. Relaxation has a stress-buffering effect and is useful to reduce the accumulation of stress (Iglesias et al. 2012; Jerath et al. 2015; Linnemann et al. 2017). Question 3 was employed for evaluating the frequency of eating when irritated or worried, which contributes to emotional eating. Stress-induced emotional eating is an unhealthy lifestyle habit and is causally linked to obesity (Kaplan et al. 1957; Torres and Nowson 2007; Bast and Berry 2014). Question 4 was included for evaluating the degree of satisfaction with one’s sleep. Although the question concerns sleep, it was selected because stress affects sleeping patterns and often induces poor sleep, thus reducing quality of life (Kim et al. 2016). In addition, impaired sleep is also associated with obesity (Geiker et al. 2018). These four questions that were included in the self-reported questionnaire (Table 3) were originally selected by our research group from a questionnaire on lifestyles that has been used for collecting statistical healthcare data at the annual physical examination of university students and graduate students in the Tohoku University for many years (Health Administration Center, Tohoku University 2004).
Statistical analysis was performed with the statistical package JSTAT for Windows, version 6.8 (Sato, Japan), and SPSS statistics, version 22.0 (IBM, Armonk, NY, USA). Spearman’s rank correlation coefficient was used to assess correlations of taste thresholds with lifestyle factors related to stress management and ESS scores. Significance was defined as P < 0.05.
Results
The general characteristics of the study subjects are summarized in Table 4. BMIs ranged from 18.7-29.4 kg/m2 (underweight [< 18.5 kg/m2]: n = 0; normal weight [18.5-24.9 kg/m2]: n = 19; overweight [25-29.9 kg/m2]: n = 3; obese [≥ 30 kg/m2]: n = 0).
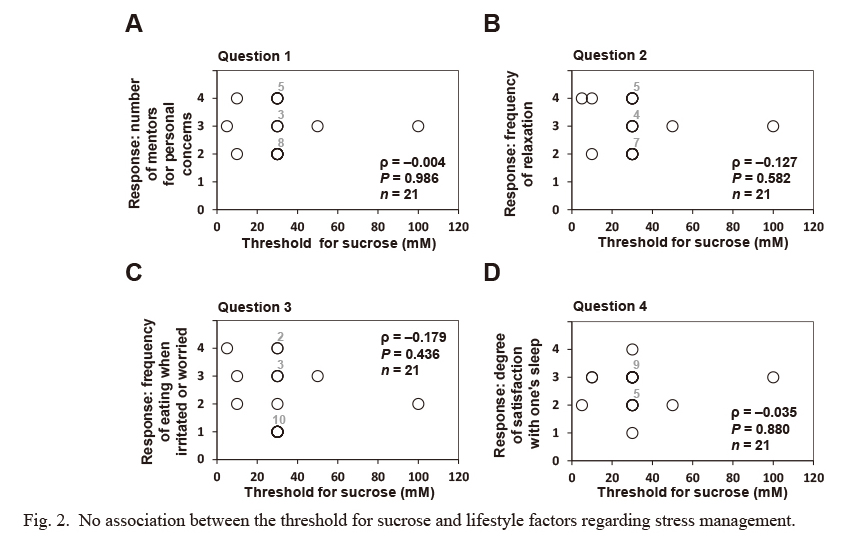
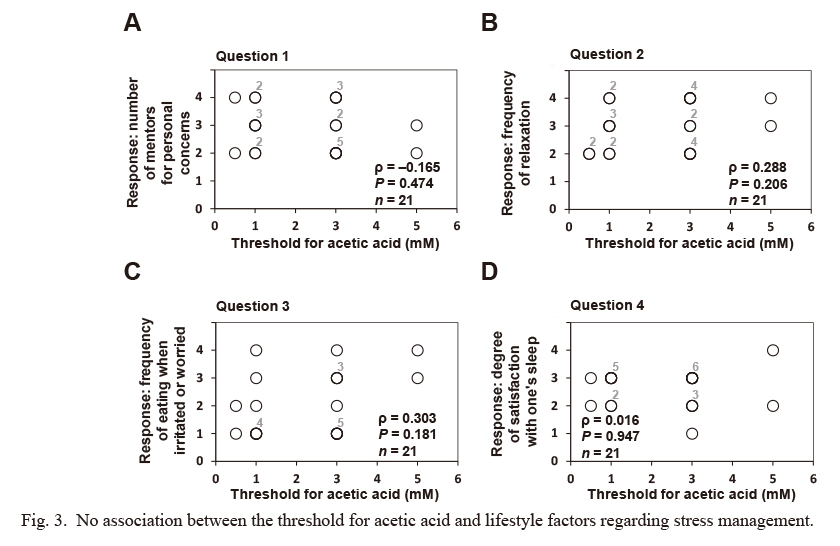
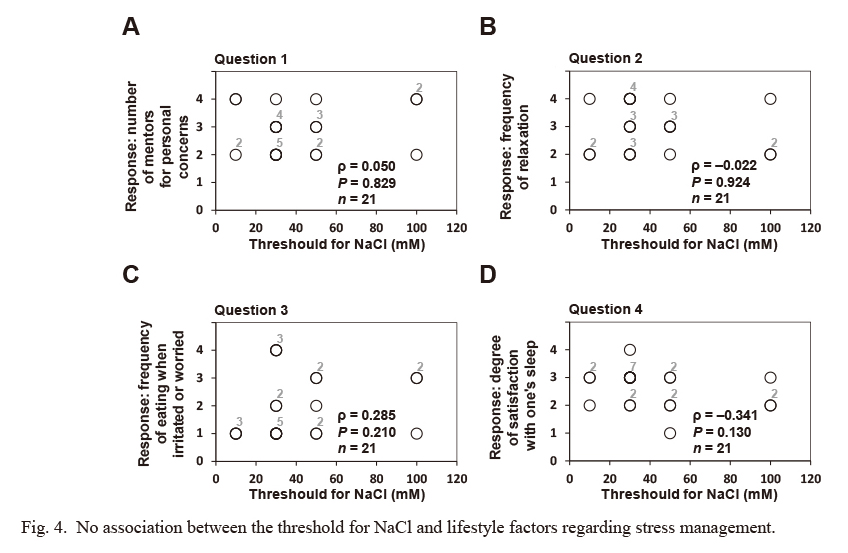
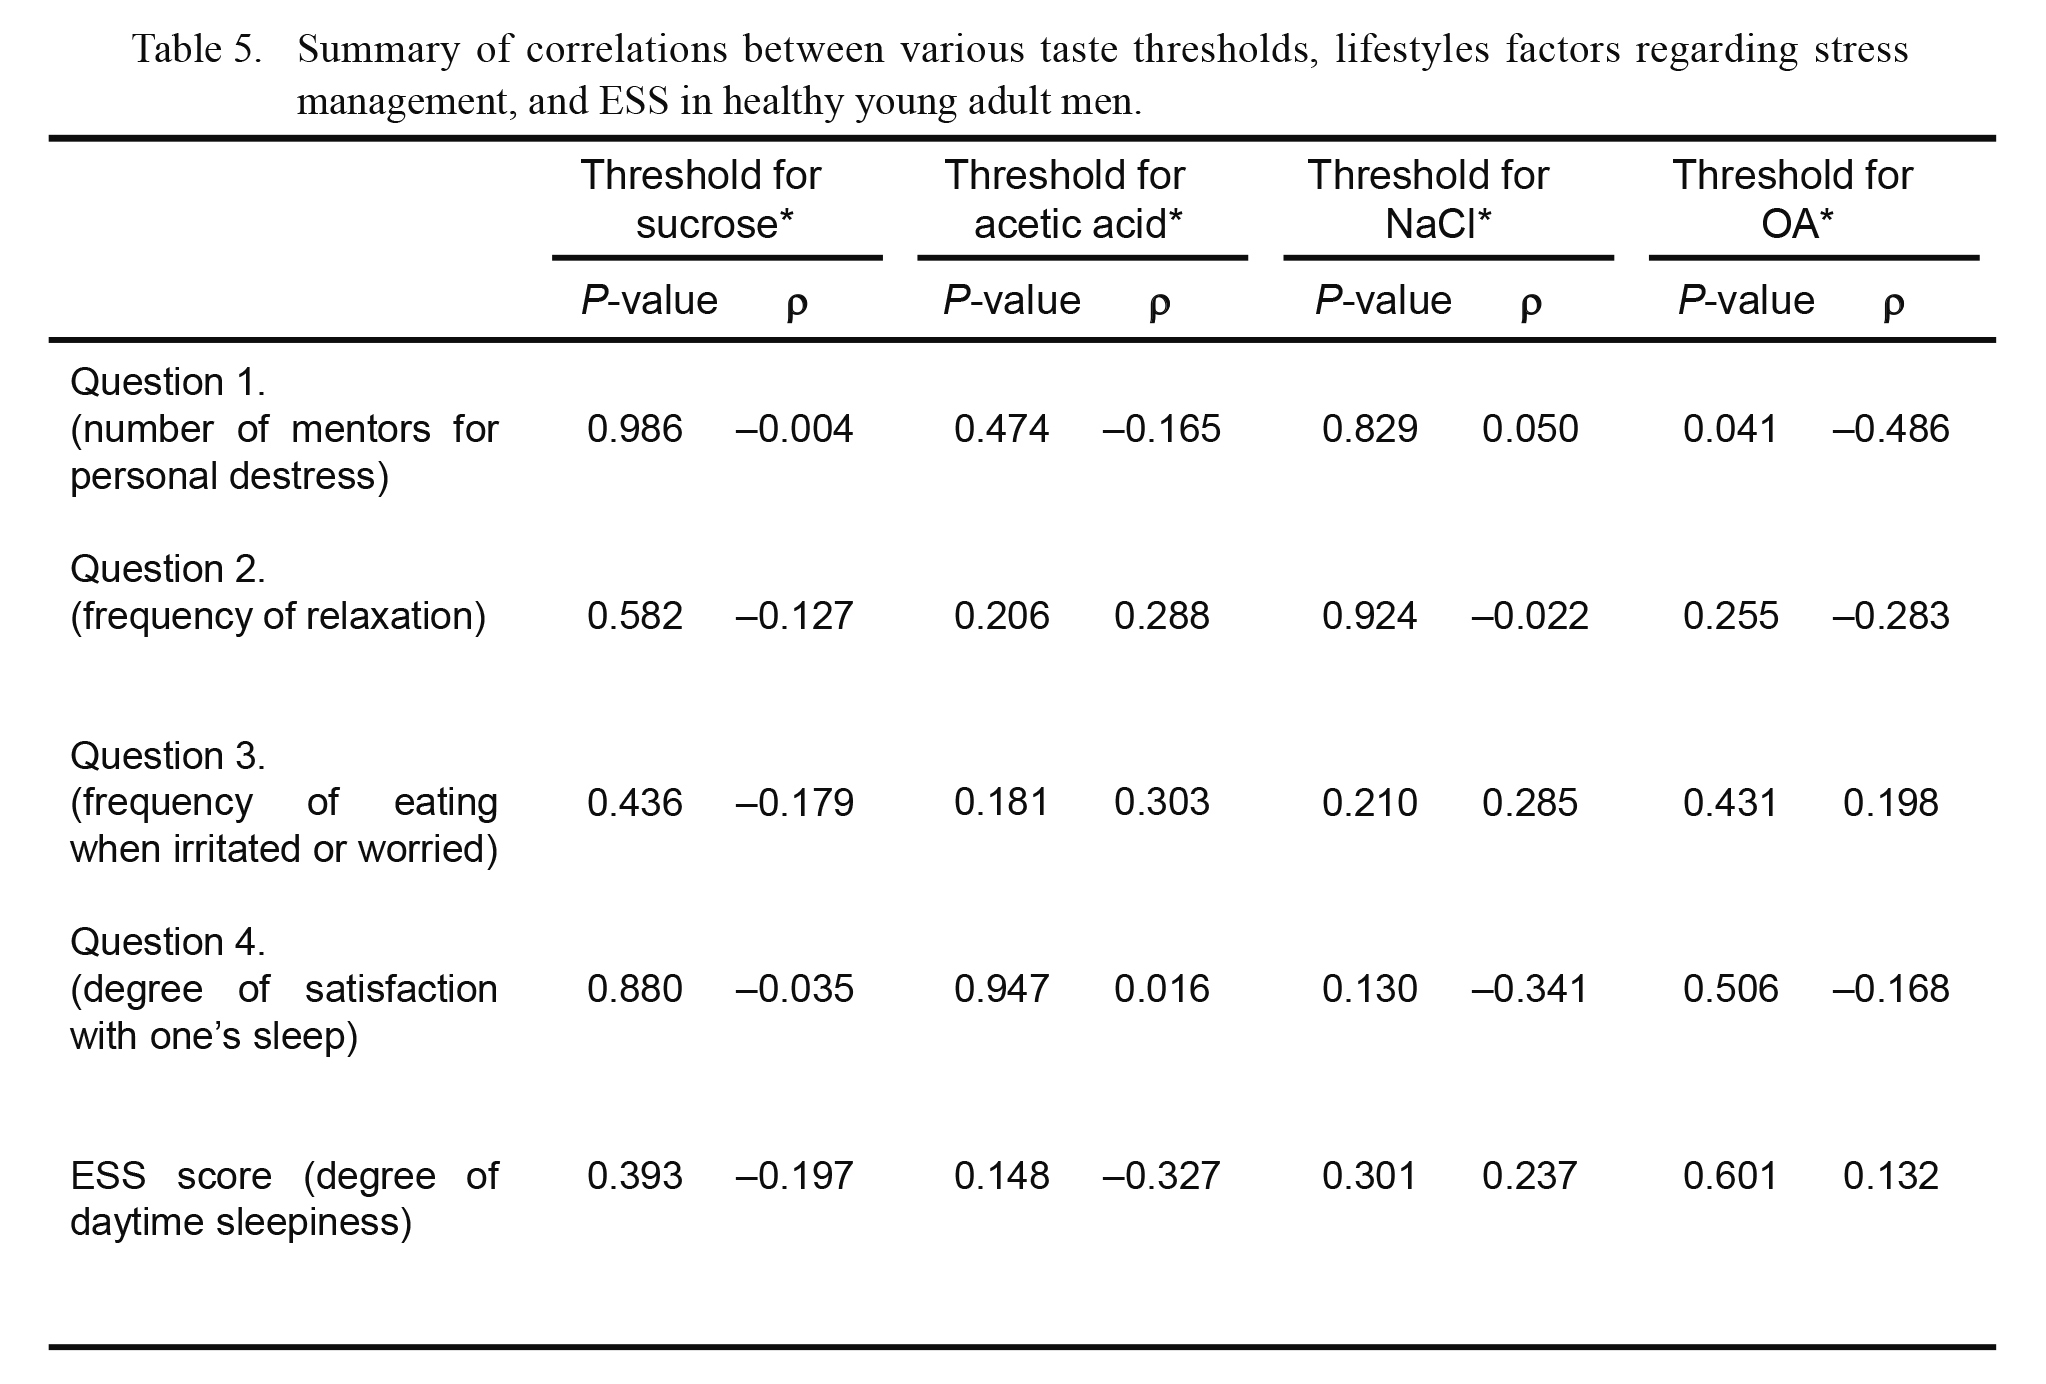
We investigated the association between OFS (or sensitivity for prototypical tastes as a control) and lifestyle factors regarding stress management using four questions from the self-reported questionnaires for the present study, as detailed in the Materials and Methods and Table 3. The OA threshold was significantly and inversely associated with the score for question 1 (number of mentors regarding personal concerns, ρ = −0.486, P = 0.041; Fig. 1). In addition, no statistical association was observed between the OA threshold and the scores for the other questions on lifestyle factors regarding stress management (i.e., the frequency of relaxation, the frequency of eating when irritated or worried, and the degree satisfaction with one’s sleep) (Fig. 1). In addition, no significant association was found between the threshold for each prototypical (sucrose, acetic acid, and NaCl) and any of the question scores on lifestyle factors regarding stress management (Figs. 2, 3 and 4).
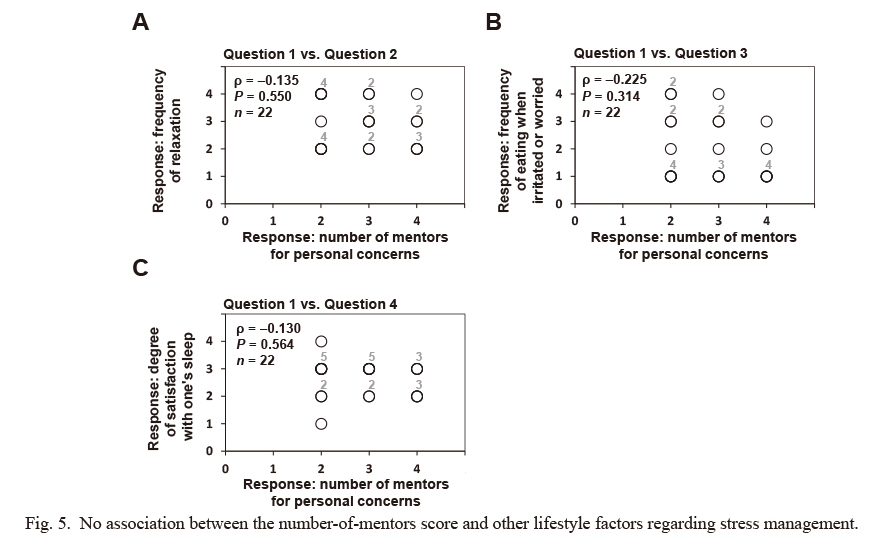
We then investigated the relationship of the score for the number of mentors on personal concerns (question 1) with the scores for the other questions on lifestyle factors related to stress management in Table 3. As shown in Fig. 5, no statistical association was observed between the score for question 1 and any of the other scores for the questions on lifestyle factors regarding stress management.
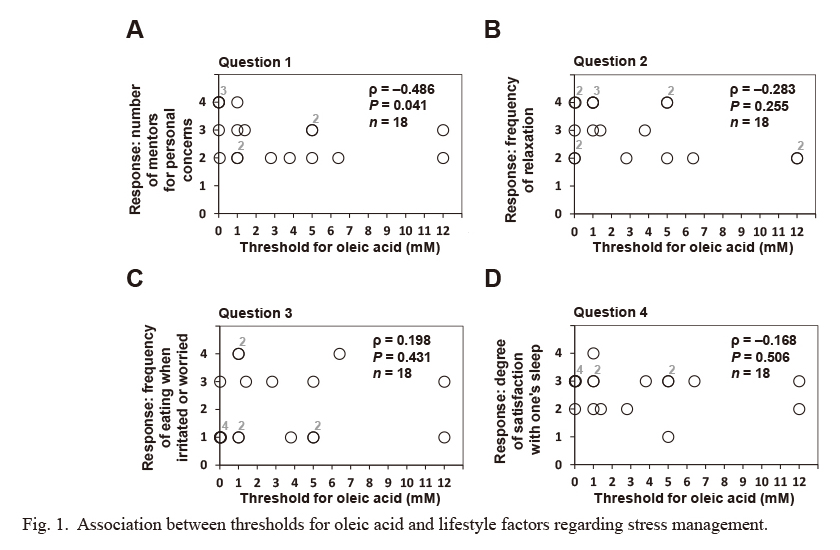
Finally, we investigated the correlation between the ESS score and the thresholds for prototypical tastes and OA. However, no statistical association was observed between the ESS score and any of the other tastant sensitivities (Fig. 6).
A summary of the correlation analysis of various taste thresholds with lifestyle factors regarding stress management and daytime sleepiness (Figs. 1, 2, 3, 4 and 6) is presented in Table 5.
Discussion
In the present study, OFS, which may have a regulatory role in the daily fat consumption in human individuals (Mattes 2011; Keast and Costanzo 2015), was inversely associated with the score for question 1 shown in Table 3 concerning the number of mentors for personal concerns (Fig. 1). The score measures the degree of one’s social support. We found no association between this lifestyle factor and the threshold for any prototypical tastes tested (sweet, sour, and salty) (Figs. 2, 3 and 4). In addition, the score for question 1 had no association with the scores for other questions tested (questions 2-4; Table 3) in the present study (Fig. 5), characterizing the specific and unique correlation between OFS and the degree of one’s social support indicated by the number-of-mentors score in healthy young adult men.
Although the exact reason for the observed association between the number of mentors on personal concerns and OFS is unclear in the present study, it should be noted that social support is a meaningful factor that is associated with development and maintenance of eating disorders (Limbert 2010). Experimental evidence suggests a lack of social support among individuals with eating disorders, including clinical and subclinical bulimia nervosa (a disorder characterized by binge eating followed by purging) (Ghaderi and Scott 1999; Limbert 2010).
In consideration of these facts, including those of the present study regarding the association between social support and OFS, the observed correlation of social support with OFS (P = 0.041) may also be biologically meaningful. Although the present results, because of their correlative nature, do not explain why social support might cause a change in OFS, we speculate one possible explanation: individuals who have larger numbers of mentors for personal concerns may be able to alleviate stress regarding their concerns more easily by coping with stressful events of their lives, and this social buffering may induce the regulatory and stabilizing effect of social support on HPA axis reactivity. As described in the Introduction, the HPA axis is one of the major systems involved in the integrated stress response in the body, and blunted HPA axis reactivity is associated with enhancement of stress-induced emotional eating. Thereby, social support eventually could prevent or attenuate stress-induced emotional eating of high-calorie and high-fat foods. In this context, it should be noted that emotional eating in humans often leads to eating nutrient-dense foods and especially excess consumption of high-calorie, sweet, and fatty foods (Torres and Nowson 2007). Thus, individuals who have larger numbers of mentors for personal concerns may tend to have higher OFS than those with fewer mentors; this is because habitual exposure of low-fat food intake decreases oral fat thresholds and increases OFS in humans (Stewart and Keast 2012). Taken together, our findings raise the possibility that healthy young adult men with larger numbers of mentors may have reduced opportunity for high-fat food intake because the effects of stress are buffered; the effects of social support mediate the regulatory and stabilizing effect on HPA axis reactivity, which lowers OA thresholds. However, the aforementioned assumption is just one possible mechanism explaining the association between OFS and social support; thus, further studies need to investigate the meaning and mechanisms of this relationship.
No significant associations of prototypical taste thresholds and scores for lifestyle factors regarding stress management were observed in healthy young adult men (Figs. 2, 3 and 4), suggesting that lifestyle factors regarding (i) the frequency of relaxation, (ii) the frequency of eating while irritated or worried, and (iii) the degree of satisfaction with one’s sleep may not be important physiological factors that modulate the investigated taste thresholds. However, it should be noted that these results do not disprove the possibility that these prototypical taste thresholds are associated with other lifestyle-related factors that were not investigated in the present study. Indeed, there are reports concerning the effect of stress on the thresholds of prototypical tastants (Nakagawa et al. 1996; Heath et al. 2006; Al’Absi et al. 2012; Ileri-Gurel et al. 2013; Parker et al. 2014). Moreover, our results also do not disprove the possibility of a significant association between the threshold of prototypical tastants and the four questions regarding stress management used in the present study (Table 3) in healthy young adult women; sex has a powerful influence on lifestyle habits, such as impulsive eating when irritated or worried (Kuriyama and Shibasaki 2004; Klatzkin et al. 2018).
Shorter periods of sleep could be a risk factor for weight gain and obesity (Patel and Hu 2008; Brondel et al. 2010). In fact, lack of sleep has been correlated with increased energy intake, especially from carbohydrates and fat (Bosy-Westphal et al. 2008; Brondel et al. 2010; Smith et al. 2016). Thus, we firstly investigated the correlation of daytime sleepiness and OFS in healthy young adult men. However, we observed no significant association between the ESS score and the sensitivity for OA and prototypical tastants (sucrose, acetic acid and NaCl) (Fig. 6), suggesting that daytime sleepiness may not be an essential physiological factor that mediates the tasted taste thresholds in healthy young adult men. More detailed and interdisciplinary research using established tools to study sleep habits, such as the Pittsburgh Sleep Quality Index, a self-reported questionnaire on sleep quality, is necessary to bring new insight into the association between lack of sleep and OFS.
The present study has several limitations. The first is the small number of participants, which might have resulted in low statistical power, but nonetheless was sufficient to show significant associations between taste thresholds, scores for lifestyle factors regarding stress management, and sleepiness. The second is the application of a number of different tests with the same P-value threshold (the multiple-comparison problem). The third is the self-reported design of the questionnaire, which might have led to the participants’ personal biases affecting results. It should also be noted that our group originally prepared the questions in Table 3 in Japanese. The study subjects used the Japanese version, but not the translated version shown in the table. However, to measure daytime sleepiness using the ESS score, we used a version of the ESS questionnaire that had previously been translated into Japanese and used in clinics in Japan. This version of the ESS questionnaire is different from the validated Japanese version (Takegami et al. 2009). Our data on daytime sleepiness might have been different had the latter been used. Finally, the study subjects were non-medicated, non-smoking, normal weight or overweight, young adult men in good health and may not accurately represent underweight, obese, women, or general populations.
Obesity is a global epidemic and is associated with various health complications, including cardiovascular disease, cancer, hyperlipidemia, and sleep-related breathing disorders, such as obstructive sleep apnea (Hubert et al. 1983; Izumi et al. 2016). The causes of obesity are complex and diverse and can be attributed to physiologic, environmental, and genetic factors (Torres and Nowson 2007). Perception of taste is only one factor in the complex cause of obesity, and it might be a relatively minor one (Donaldson et al. 2009). Nonetheless, dietary fat is primarily involved in weight maintenance (Bray et al. 2004; Astrup 2005; Haryono et al. 2014), suggesting that inappropriate fat perception may influence the risk of obesity by affecting eating behavior (Laugerette et al. 2005; Fushiki 2014). Therefore, it is highly important to clarify how factors impacting OFS, including stress and sleepiness, are related to human weight maintenance (Blundell and Rogers 1991; Hill et al. 1991; Asano et al. 2016).
In the present study, we focused on the link between OFS and lifestyle factors regarding stress management and sleepiness in healthy young adult men. We firstly found that the OA detection threshold, but not those for the prototypical tastants tested, was associated with a lifestyle factor related to stress management, indicated by the score for the number of mentors for personal concerns. This is important, as the score concerning the number of mentors for personal concerns represents the degree of one’s social support. Social support is a social factor that can reduce stress and is related with mental health among social animals including rodents, non-human primates, and humans (Kikusui et al. 2006). In addition, social support often influences food contents consumed by human individuals (Cohen 2004; Torres and Nowson 2007; Lakey and Orehek 2011; Kwan and Gordon 2016; Darling et al. 2017). In contrast, tested taste sensitivities, including OFS, had no association with daytime sleepiness in healthy young adult men. Taken together, our results suggest that OFS may have a specific correlation with aspects of social support in healthy young adult men via an unknown mechanism. Further study of the association of lifestyle factors related to social support for stress management with OFS would be highly valuable for understanding the regulatory mechanisms of OFS and the development of tools to analyze individual OFS differences, which may contribute to the evaluation of OFS-related dysfunction and prevention or management of stress-induced health complications such as emotional eating.
Acknowledgments
We are grateful to Messrs. Tomoya Saito, Kentaro Nishi, Toru Atsumi, Dr. Kei Watanabe, Dr. Satoshi Izumi, and Prof. Minoru Wakamori for advice, helpful discussion, and technical assistance on this work.
Conflict of Interest
The authors declare no conflict of interest.
References
-
Al’Absi,
M.,
Nakajima,
M.,
Hooker,
S.,
Wittmers,
L. &
Cragin,
T.
(2012) Exposure to acute stress is associated with attenuated sweet taste. Psychophysiology, 49, 96-103.
-
Asano,
M.,
Hong,
G.,
Matsuyama,
Y.,
Wang,
W.,
Izumi,
S.,
Izumi,
M.,
Toda,
T. &
Kudo,
T.
(2016) Association of oral fat sensitivity with body mass index, taste preference, and eating habits in healthy Japanese young adults. Tohoku J. Exp. Med., 238, 93-103.
-
Astrup,
A.
(2005) The role of dietary fat in obesity. Semin. Vasc. Med., 5, 40-47.
-
Bachmanov,
A.A. &
Beauchamp,
G.K.
(2006) Taste receptor genes. Annu. Rev. Nutr., 27, 389-414.
-
Bast,
E.S. &
Berry,
E.M.
(2014) Laugh away the fat? Therapeutic humor in the control of stress-induced emotional eating. Rambam Maimonides Med. J., 5, e0007.
-
Baum,
A.
(1990) Stress, intrusive imagery, and chronic distress. Health Psychol., 9, 653-675.
-
Blundell,
J.E. &
Rogers,
P.J.
(1991) Hunger, hedonics and the control of satiation satiety. In Chemical Senses, vol. 4: Appetite and Nutrition, edited by
Friedman,
M.A.,
Tordoff,
M.G. &
Kare,
M.R.
Marcel Dekker, New York, pp. 127-148.
-
Bosy-Westphal,
A.,
Hinrichs,
S.,
Jauch-Chara,
K.,
Hitze,
B.,
Later,
W.,
Wilms,
B.,
Settler,
U.,
Peters,
A.,
Kiosz,
D. &
Muller,
M.J.
(2008) Influence of partial sleep deprivation on energy balance and insulin sensitivity in healthy women. Obes. Facts, 1, 266-273.
-
Bray,
G.A.,
Paeratakul,
S. &
Popkin,
B.M.
(2004) Dietary fat and obesity: a review of animal, clinical and epidemiological studies. Physiol. Behav., 83, 549-555.
-
Brondel,
L.,
Romer,
M.A.,
Nougues,
P.M.,
Touyarou,
P. &
Davenne,
D.
(2010) Acute partial sleep deprivation increases food intake in healthy men. Am. J. Clin. Nutr., 91, 1550-1559.
-
Cohen,
S.
(2004) Social relationships and health. Am. Psychol., 59, 676-684.
-
Cohen,
S. &
Wills,
T.A.
(1985) Stress, social support, and the buffering hypothesis. Psychol. Bull., 98, 310-357.
-
Costanzo,
A.,
Orellana,
L.,
Nowson,
C.,
Duesing,
K. &
Keast,
R.
(2017) Fat taste sensitivity is associated with short-term and habitual fat intake. Nutrients, 9, 781.
-
Darling,
K.E.,
Fahrenkamp,
A.J.,
Wilson,
S.M.,
Karazsia,
B.T. &
Sato,
A.F.
(2017) Does social support buffer the association between stress eating and weight gain during the transition to college? Differences by gender. Behav. Modif., 41, 368-381.
-
Donaldson,
L.F.,
Bennett,
L.,
Baic,
S. &
Melichar,
J.K.
(2009) Taste and weight: is there a link? Am. J. Clin. Nutr., 90, 800S-803S.
-
Ehsanbakhsh,
H.,
Mirzaei,
A.,
Mahaki,
B. &
Jalilian,
M.
(2016) Stress management in type 2 diabetes: the role of self-efficacy and perceived social support. Res. J. Med. Sci., 10, 828-833.
-
Fukunishi,
I.,
Horikawa,
N.,
Yamazaki,
T.,
Shirasaka,
K.,
Kanno,
K. &
Akimoto,
M.
(1998) Perception and utilization of social support in diabetic control. Diabetes Res. Clin. Pract., 41, 207-211.
-
Furchtgott,
E. &
Willingham,
W.W.
(1956) The effect of sleep-deprivation upon the thresholds of taste. Am. J. Psychol., 69, 111-112.
-
Fushiki,
T.
(2014) Why fat is so preferable: from oral fat detection to inducing reward in the brain. Biosci. Biotechnol. Biochem., 78, 363-369.
-
Geiker,
N.R.W.,
Astrup,
A.,
Hjorth,
M.F.,
Sjödin,
A.,
Pijls,
L. &
Markus,
C.R.
(2018) Does stress influence sleep patterns, food intake, weight gain, abdominal obesity and weight loss interventions and vice versa? Obes. Rev., 19, 81-97.
-
Ghaderi,
A. &
Scott,
B.
(1999) Prevalence and psychological correlates of eating disorders among females aged 18-30 years in the general population. Acta Psychiatr. Scand., 99, 261-266.
-
Greeno,
C.G. &
Wing,
R.R.
(1994) Stress-induced eating. Psychol. Bull., 115, 444-464.
-
Haryono,
R.Y.,
Sprajcer,
M.A. &
Keast,
R.S.
(2014) Measuring oral fatty acid thresholds, fat perception, fatty food liking, and papillae density in humans. J. Vis. Exp., 88, e51236.
-
Health Administration Center, Tohoku University
(2004) Tohoku University annual report Health Administration Center, Health Administration Center, Tohoku University, Sendai, Japan.
-
Heath,
T.P.,
Melichar,
J.K.,
Nutt,
D.J. &
Donaldson,
L.F.
(2006) Human taste thresholds are modulated by serotonin and noradrenaline. J. Neurosci., 26, 12664-12671.
-
Hennessy,
M.B.,
Kaiser,
S. &
Sachser,
N.
(2009) Social buffering of the stress response: diversity, mechanisms, and functions. Front. Neuroendocrinol., 30, 470-482.
-
Hettinger,
T.P.,
Frank,
M.E. &
Myers,
W.E.
(1996) Are the tastes of polycose and monosodium glutamate unique? Chem. Senses, 21, 341-347.
-
Hill,
A.J.,
Weaver,
C.F. &
Blundell,
J.E.
(1991) Food craving, dietary restraint and mood. Appetite, 17, 187-197.
-
Hossain,
J.L.,
Ahmad,
P.,
Reinish,
L.W.,
Kayumov,
L.,
Hossain,
N.K. &
Shapiro,
C.M.
(2005) Subjective fatigue and subjective sleepiness: two independent consequences of sleep disorders? J. Sleep Res., 14, 245-253.
-
Hubert,
H.B.,
Feinleib,
M.,
McNamara,
P.M. &
Castelli,
W.P.
(1983) Obesity as an independent risk factor for cardiovascular disease: a 26-year follow-up of participants in the Framingham Heart Study. Circulation, 67, 968-977.
-
Iglesias,
S.L.,
Azzara,
S.,
Argibay,
J.C.,
Arnaiz,
M.L.,
de Valle,
Carpineta, M.,
Granchetti,
H. &
Lagomarsino,
E.
(2012) Psychological and physiological response of students to different types of stress management programs. Am. J. Health Promot., 26, e149-e158.
-
Ileri-Gurel,
E.,
Pehlivanoglu,
B. &
Dogan,
M.
(2013) Effect of acute stress on taste perception: in relation with baseline anxiety level and body weight. Chem. Senses, 38, 27-34.
-
Izumi,
S.,
Hong,
G.,
Iwasaki,
K.,
Izumi,
M.,
Matsuyama,
Y.,
Chiba,
M.,
Toda,
T. &
Kudo,
T.
(2016) Gustatory salivation is associated with body mass index, daytime sleepiness, and snoring in healthy young adults. Tohoku J. Exp. Med., 240, 153-165.
-
Janssen,
S. &
Depoortere,
I.
(2013) Nutrient sensing in the gut: new roads to therapeutics? Trends Endocrinol. Metab., 24, 92-100.
-
Jerath,
R.,
Crawford,
M.W.,
Barnes,
V.A. &
Harden,
K.
(2015) Self-regulation of breathing as a primary treatment for anxiety. Appl. Psychophysiol. Biofeedback, 40, 107-115.
-
Johns,
M.W.
(1991) A new method for measuring daytime sleepiness: the Epworth sleepiness scale. Sleep, 14, 540-545.
-
Johns,
M.W.
(1994) Sleepiness in different situations measured by the Epworth sleepiness scale. Sleep, 17, 703-710.
-
Kamradt,
J.M.,
Momany,
A.M. &
Nikolas,
M.A.
(2017) A meta-analytic review of the association between cortisol reactivity in response to a stressor and attention-deficit hyperactivity disorder. Atten. Defic. Hyperact. Disord., doi: 10.1007/s12402-017-0238-5. [Epub ahead of print].
-
Kant,
A.K. &
Graubard,
B.I.
(2014) Association of self-reported sleep duration with eating behaviors of American adults: NHANES 2005-2010. Am. J. Clin. Nutr., 100, 938-947.
-
Kaplan,
H.I.,
Kaplan,
H.S. &
Leder,
H.L.
(1957) The psychosomatic management of obesity. NY State J. Med., 57, 2815-2826.
-
Karita,
K.,
Harada,
M.,
Yosida,
M. &
Kokaze,
A.
(2012) Factors associated with dietary habits and mood states affecting. J. Nutr. Sci. Vitaminol., 58, 360-365.
-
Keast,
R.S. &
Costanzo,
A.
(2015) Is fat the sixth taste primary? Evidence and implications. Flavour, 4, 5.
-
Kikusui,
T.,
Winslow,
J.T. &
Mori,
Y.
(2006) Social buffering: relief from stress and anxiety. Philos. Trans. R. Soc. Lond. B Biol. Sci., 361, 2215-2228.
-
Kim,
S.M.,
Park,
J.M. &
Seo,
H.J.
(2016) Effects of mindfulness-based stress reduction for adults with sleep disturbance: a protocol for an update of a systematic review and meta-analysis. Syst. Rev., 5, 51.
-
Klatzkin,
R.R.,
Baldassaro,
A. &
Hayden,
E.
(2018) The impact of chronic stress on the predictors of acute stress-induced eating in women. Appetite, 123, 343-351.
-
Kuriyama,
H. &
Shibasaki,
T.
(2004) Sexual differentiation of the effects of emotional stress on food intake in rats. Neuroscience, 124, 459-465.
-
Kwan,
M.Y. &
Gordon,
K.H.
(2016) The effects of social support and stress perception on bulimic behaviors and unhealthy food consumption. Eat Behav., 22, 34-39.
-
Lakey,
B. &
Orehek,
E.
(2011) Relational regulation theory: a new approach to explain the link between perceived social support and mental health. Psychol. Rev., 118, 482-495.
-
Laugerette,
F.,
Passilly-Degrace,
P.,
Patris,
B.,
Niot,
I.,
Febbraio,
M.,
Montmayeur,
J.P. &
Besnard,
P.
(2005) CD36 involvement in orosensory detection of dietary lipids, spontaneous fat preference, and digestive secretions. J. Clin. Invest., 115, 3177-3184.
-
Linnemann,
A.,
Strahler,
J. &
Nater,
U.M.
(2017) Assessing the effects of music listening on psychobiological stress in daily life. J. Vis. Exp., 2, 120.
-
Limbert,
C.
(2010) Perceptions of social support and eating disorder characteristics. Health Care Women Int., 31, 170-178.
-
Loper,
H.B.,
La Sala,
M.,
Dotson,
C. &
Steinle,
N.
(2015) Taste perception, associated hormonal modulation, and nutrient intake. Nutr. Rev., 73, 83-91.
-
Maggio,
M.,
Colizzi,
E.,
Fisichella,
A.,
Valenti,
G.,
Ceresini,
G.,
Dall’Aglio,
E.,
Ruffini,
L.,
Lauretani,
F.,
Parrino,
L. &
Ceda,
G.P.
(2013) Stress hormones, sleep deprivation and cognition in older adults. Maturitas, 76, 22-44.
-
Martínez-Ruiz,
N.R.,
López-Díaz,
J.A.,
Wall-Medrano,
A.,
Jiménez-Castro,
J.A. &
Angulo,
O.
(2014) Oral fat perception is related with body mass index, preference and consumption of high-fat foods. Physiol. Behav., 129, 36-42.
-
Mattes,
R.D.
(2011) Accumulating evidence supports a taste component for free fatty acids in humans. Physiol. Behav., 104, 624-631.
-
Mojet,
J.,
Heidema,
J. &
Christ-Hazelhof,
E.
(2003) Taste perception with age: generic or specific losses in supra-threshold intensities of five taste qualities? Chem. Senses, 28, 397-413.
-
Nakagawa,
M.,
Mizuma,
K. &
Inui,
T.
(1996) Changes in taste perception following mental or physical stress. Chem. Senses, 21, 195-200.
-
Ninomiya,
Y.,
Imoto,
T.,
Yatabe,
A.,
Kawamura,
S.,
Nakashima,
K. &
Katsukawa,
H.
(1998) Enhanced responses of the chorda tympani nerve to nonsugar sweeteners in the diabetic db/db mouse. Am. J. Physiol., 274, 1324-1330.
-
Ninomiya,
Y.,
Sako,
N. &
Imai,
Y.
(1995) Enhanced gustatory neural responses to sugars in the diabetic db/db mouse. Am. J. Physiol., 269, 930-937.
-
Noel,
C. &
Dando,
R.
(2015) The effect of emotional state on taste perception. Appetite, 95, 89-95.
-
Parker,
M.R.,
Feng,
D.,
Chamuris,
B. &
Margolskee,
R.F.
(2014) Expression and nuclear translocation of glucocorticoid receptors in type 2 taste receptor cells. Neurosci. Lett., 571, 72-77.
-
Patel,
S.R. &
Hu,
F.B.
(2008) Short sleep duration and weight gain: a systematic review. Obesity, 16, 643-653.
-
Platte,
P.,
Herbert,
C.,
Pauli,
P. &
Breslin,
P.A.
(2013) Oral perceptions of fat and taste stimuli are modulated by affect and mood induction. PLoS One, 8, e65006.
-
Running,
C.A.,
Craig,
B.A. &
Mattes,
R.D.
(2015) Oleogustus: the unique taste of fat. Chem. Senses, 40, 507-516.
-
Satoh-Kuriwada,
S.,
Kawai,
M.,
Iikubo,
M.,
Sekine-Hayakawa,
Y.,
Shoji,
N.,
Uneyama,
H. &
Sasano,
T.
(2014) Development of an umami taste sensitivity test and its clinical use. PLoS One, 9, e95177.
-
Schiffman,
S.S.
(2000) Taste quality and neural coding: implications from psychophysics and neurophysiology. Physiol. Behav., 69, 147-159.
-
Smith,
S.L.,
Ludy,
M.J. &
Tucker,
R.M.
(2016) Changes in taste preference and steps taken after sleep curtailment. Physiol. Behav., 163, 228-233.
-
Spencer,
R.L. &
Deak,
T.
(2017) A users guide to HPA axis research. Physiol. Behav., 178, 43-65.
-
Stansbury,
K. &
Gunnar,
M.R.
(1994) Adrenocortical activity and emotion regulation. Monogr. Soc. Res. Child Dev., 59, 108-134.
-
Stewart,
J.E.,
Feinle-Bisset,
C.,
Golding,
M.,
Delahunty,
C.,
Clifton,
P.M. &
Keast,
R.S.
(2010) Oral sensitivity to fatty acids, food consumption and BMI in human subjects. Br. J. Nutr., 104, 145-152.
-
Stewart,
J.E. &
Keast,
R.S.
(2012) Recent fat intake modulates fat taste sensitivity in lean and overweight subjects. Int. J. Obes., 36, 834-842.
-
Stewart,
J.E.,
Newman,
L.P. &
Keast,
R.S.
(2011) Oral sensitivity to oleic acid is associated with fat intake and body mass index. Clin. Nutr., 30, 838-844.
-
Sullivan,
R.M. &
Perry,
R.E.
(2015) Mechanisms and functional implications of social buffering in infants: lessons from animal models. Soc. Neurosci., 10, 500-511.
-
Takegami,
M.,
Suzukamo,
Y.,
Wakita,
T.,
Noguchi,
H.,
Chin,
K.,
Kadotani,
H.,
Inoue,
Y.,
Oka,
Y.,
Nakamura,
T.,
Green,
J.,
Johns,
M.W. &
Fukuhara,
S.
(2009) Development of a Japanese version of the Epworth sleepiness scale (JESS) based on item response theory. Sleep Med., 10, 556-565.
-
Torres,
S.J. &
Nowson,
C.A.
(2007) Relationship between stress, eating behavior, and obesity. Nutrition, 23, 887-894.
-
Tucker,
R.M.,
Kaiser,
K.A.,
Parman,
M.A.,
George,
B.J.,
Allison,
D.B. &
Mattes,
R.D.
(2017) Comparisons of fatty acid taste detection thresholds in people who are lean vs. overweight or obese: a systematic review and meta-analysis. PLoS One, 12, e0169583.
-
Umabiki,
M.,
Tsuzaki,
K.,
Kotani,
K.,
Nagai,
N.,
Sano,
Y.,
Matsuoka,
Y.,
Kitaoka,
K.,
Okami,
Y.,
Sakane,
N. &
Higashi,
A.
(2010) The improvement of sweet taste sensitivity with decrease in serum leptin levels during weight loss in obese females. Tohoku J. Exp. Med., 220, 267-271.
-
van Dalfsen,
J.H. &
Markus,
C.R.
(2017) The influence of sleep on human hypothalamic-pituitary-adrenal (HPA) axis reactivity: a systematic review. Sleep Med. Rev., doi: 10.1016/j.smrv.2017.10.002. [Epub ahead of print].
-
van Strien,
T.,
Roelofs,
K. &
de Weerth,
C.
(2013) Cortisol reactivity and distress-induced emotional eating. Psychoneuroendocrinology, 38, 677-684.
-
Verma,
P.,
Mahaja,
K.K.,
Mital,
S. &
Ghildiyal,
A.
(2005) Salt preference across different phases of menstrual cycle. Indian J. Physiol. Pharmacol., 49, 99-102.
-
Wittig,
R.M.,
Crockford,
C.,
Weltring,
A.,
Langergraber,
K.E.,
Deschner,
T. &
Zuberbühler,
K.
(2016) Social support reduces stress hormone levels in wild chimpanzees across stressful events and everyday affiliations. Nat. Commun., 7, 13361.
-
Wright,
P.
(1973) Menstrual cycle: effect on sweetness preferences in women. Horm. Behav., 4, 387-391.
-
Zhang,
Y.,
Venkitasamy,
C.,
Pan,
Z.,
Liu,
W. &
Zhao,
L.
(2017) Novel umami ingredients: umami peptides and their taste. J. Food Sci., 82, 16-23.