Abstract
For the prevention of suicides, the early detection of depression symptoms and the implementation of suicide prevention measures based on the local community’s conditions are critical. In rural or remote communities with poor access to urban areas, the medical care is often insufficient. We conducted the present study to investigate the relationship between depressive state and social-environmental factors in a depopulated inland rural area in central Japan, where the suicide rate is high and specialized psychiatric care is not available. Using a correspondence analysis, logistic regression analysis, and structural equation modeling (SEM), we examined the questionnaire responses of 912 residents (average 60.5 years old). Total Health Index-Depression (THI-D) scale scores were used to measure depressive state. The lifestyle-related factor with the strongest link to depressive state was ‘concerns about interpersonal relationships’ (OR = 2.7, 95% CI: 2.06-3.53, p < 0.0001), whereas financial concerns, number of friends, exercise habits, and perceived amount of sleep were also useful for predicting depressive state. The SEM showed that one’s job and private life, particularly concerns about interpersonal relationships, are correlated with higher THI-D scores. Thus, social and lifestyle factors (e.g., concerns about interpersonal relationships and financial situation) can be used to predict depressive state in a depopulated rural area, and the newly revealed order in which depressive symptoms manifest is important. Our findings can be used to advance assessments of depressive symptoms and will be useful for mental health and suicide prevention.
Introduction
Depression (the third leading cause of lost disability-adjusted life years around the world) and suicide are important public health concerns (Lépine and Briley 2011; Mall et al. 2015). A 2015 report published by the World Health Organization (WHO) noted that the age-adjusted suicide rate in Japan was higher than the global average. According to a 2013 announcement by Japan’s National Police Agency, the primary cause (motive) of suicide at the time was health problems, with depression accounting for approx. 20% of the recorded cases (Cabinet Office for Policy of Suicide Prevention and National Police Agency Community Safety Planning Division, 2013). The early detection of the symptoms of depression and appropriate interventions are critical for suicide prevention, and many researchers have investigated the onset of depression and related factors, including physiological factors (Kim et al. 2013) such as physical conditions (Luppino et al. 2010; Taspinar et al. 2010; Audino et al. 2014; Ide 2011; Webel et al. 2016) and sleep (Baglioni et al. 2011; Yokoyama et al. 2010) as well as social-environmental factors such as household and economic circumstances (Matthews et al. 2016; Umubyeyi et al. 2016; Niedzwiedz et al. 2016; Sapranaviciute-Zabazlajeva et al. 2014; Shidhaye et al. 2016; St. John et al. 2006).
In Japan, suicide rates tend to be higher in rural areas than in urban areas (Sakamoto et al. 2004; Motohashi et al. 2017). Japan’s Ministry of Health, Labour and Welfare (2016) reported that suicide rates were higher in “hilly areas with steep slopes” in the country, which may be due to these areas’ inadequate medical resources such as hospitals and specialist physicians, and/or because the less frequent interactions with neighbors can lead to social isolation. Proactive screening and public awareness of depression are especially important in communities in mountainous regions.
We have been investigating the relationship between depressive status—which can lead to depression—and lifestyle factors among residents of mountainous regions by distributing questionnaire surveys in a small town in a mountainous region of Japan’s Gunma Prefecture since 2007. The goal of our series of studies including the present investigation is to identify the depressive status among residents of medically depopulated areas and the related lifestyle factors for which interventions would be feasible. We also analyzed the town residents’ perceived happiness and its impact on depressive state; we did so because perceived happiness has been a concern in recent years, as are extending individuals’ life expectancy and health expectancy and enhancing their quality of life and subjective sense of well-being (Costanza et al. 2007; Steptoe et al. 2015). We also analyzed the internal structure of the questionnaire to ensure that it will remain effective for subsequent surveys.
We expect that improving our understanding of the mental states of residents of rural/remote communities, identifying cases of depressive state at an early time point, and implementing appropriate countermeasures will lead to both improved quality of life for the residents of these communities and a decrease in the number of suicides. Our findings have implications for mental health and suicide prevention measures in other medically depopulated areas.
Methods
Target region and participants
A small town in a mountainous region (approx. 800 m above sea level) of Gunma Prefecture in Japan was selected as the survey site for this study. We have been conducting annual surveys in this town since 2007 (Murayama et al. 2012), and its population has been declining for the last 60 years, since its peak of 8,500 people in 1955. This decline became especially pronounced over the last 20 years. Aging and depopulation have become serious societal concerns. The town’s population in 2007 was approx. 4,700 people, and it increased slightly over the next 5 years. However, by 2017 the population had fallen to ~4,500 people with ~1,700 households. Moreover, in 2015, nearly 35% of the population was over 65 years old and nearly 20% was over 75. Those figures were significantly higher than both the national share of persons ≥ 65 years (~27%) and ≥ 75 years (~13%) and the share for Gunma Prefecture (~28% and 13%, respectively). In 2015, the proportion of the town’s population < 14 years old was ~10%, and the proportion of the working-age population was low at ~56%. The main industries of the town have been tourism and agriculture. Tourism accounts for 24% of the town’s total industry, but the number of tourists has decreased every year. This region is inconvenient for transportation, shopping, medical care, and employment opportunities. The town has two internal medicine clinics, but neither performs psychiatric evaluations; thus, as the nearest psychiatric hospital is over 1 hour away, residents of the target town cannot receive specialized psychiatric care without first securing transportation. According to Japan’s National Health Insurance Receipt Data for 2016, 117 of the 4,893 insured persons in the target town suffered from mental illness. The data health plan created in the same region in 2018 indicates that (1) the proportions of persons on medication and those with a medical history were low, and (2) the proportion of people who had not undergone a medical examination was high. However, many people who need medical care may not have access to medical care, and even when they suffer from physical illness, they may not seek medical help and tend to be hospitalized only after the disease has progressed. The suicide rate in our target town is higher than the Japanese national average and those of urban areas in the same prefecture; in 2012, the national average suicide rate per 100,000 people was 21.8, but during the same year, the suicide rate in the town was 97.7 (males: 121.8, females: 75.4; < 60 years of age: 126.5, aged ≥ 60 years: 51.26).
We administered a questionnaire to residents of the target town in 2012, during the annual health examinations conducted every spring. Of the 1,536 residents who underwent the health examination, 915 (response rate: 59.6%) provided consent to participate in our survey after receiving a briefing regarding the nature and purpose of our study. While the questionnaires were designed to be completed by the respondents themselves, in cases in which a respondent was unable to read or complete the questionnaire independently, a public health nurse or medical student read the items to the respondent and helped him or her complete the questionnaire.
Questionnaire details
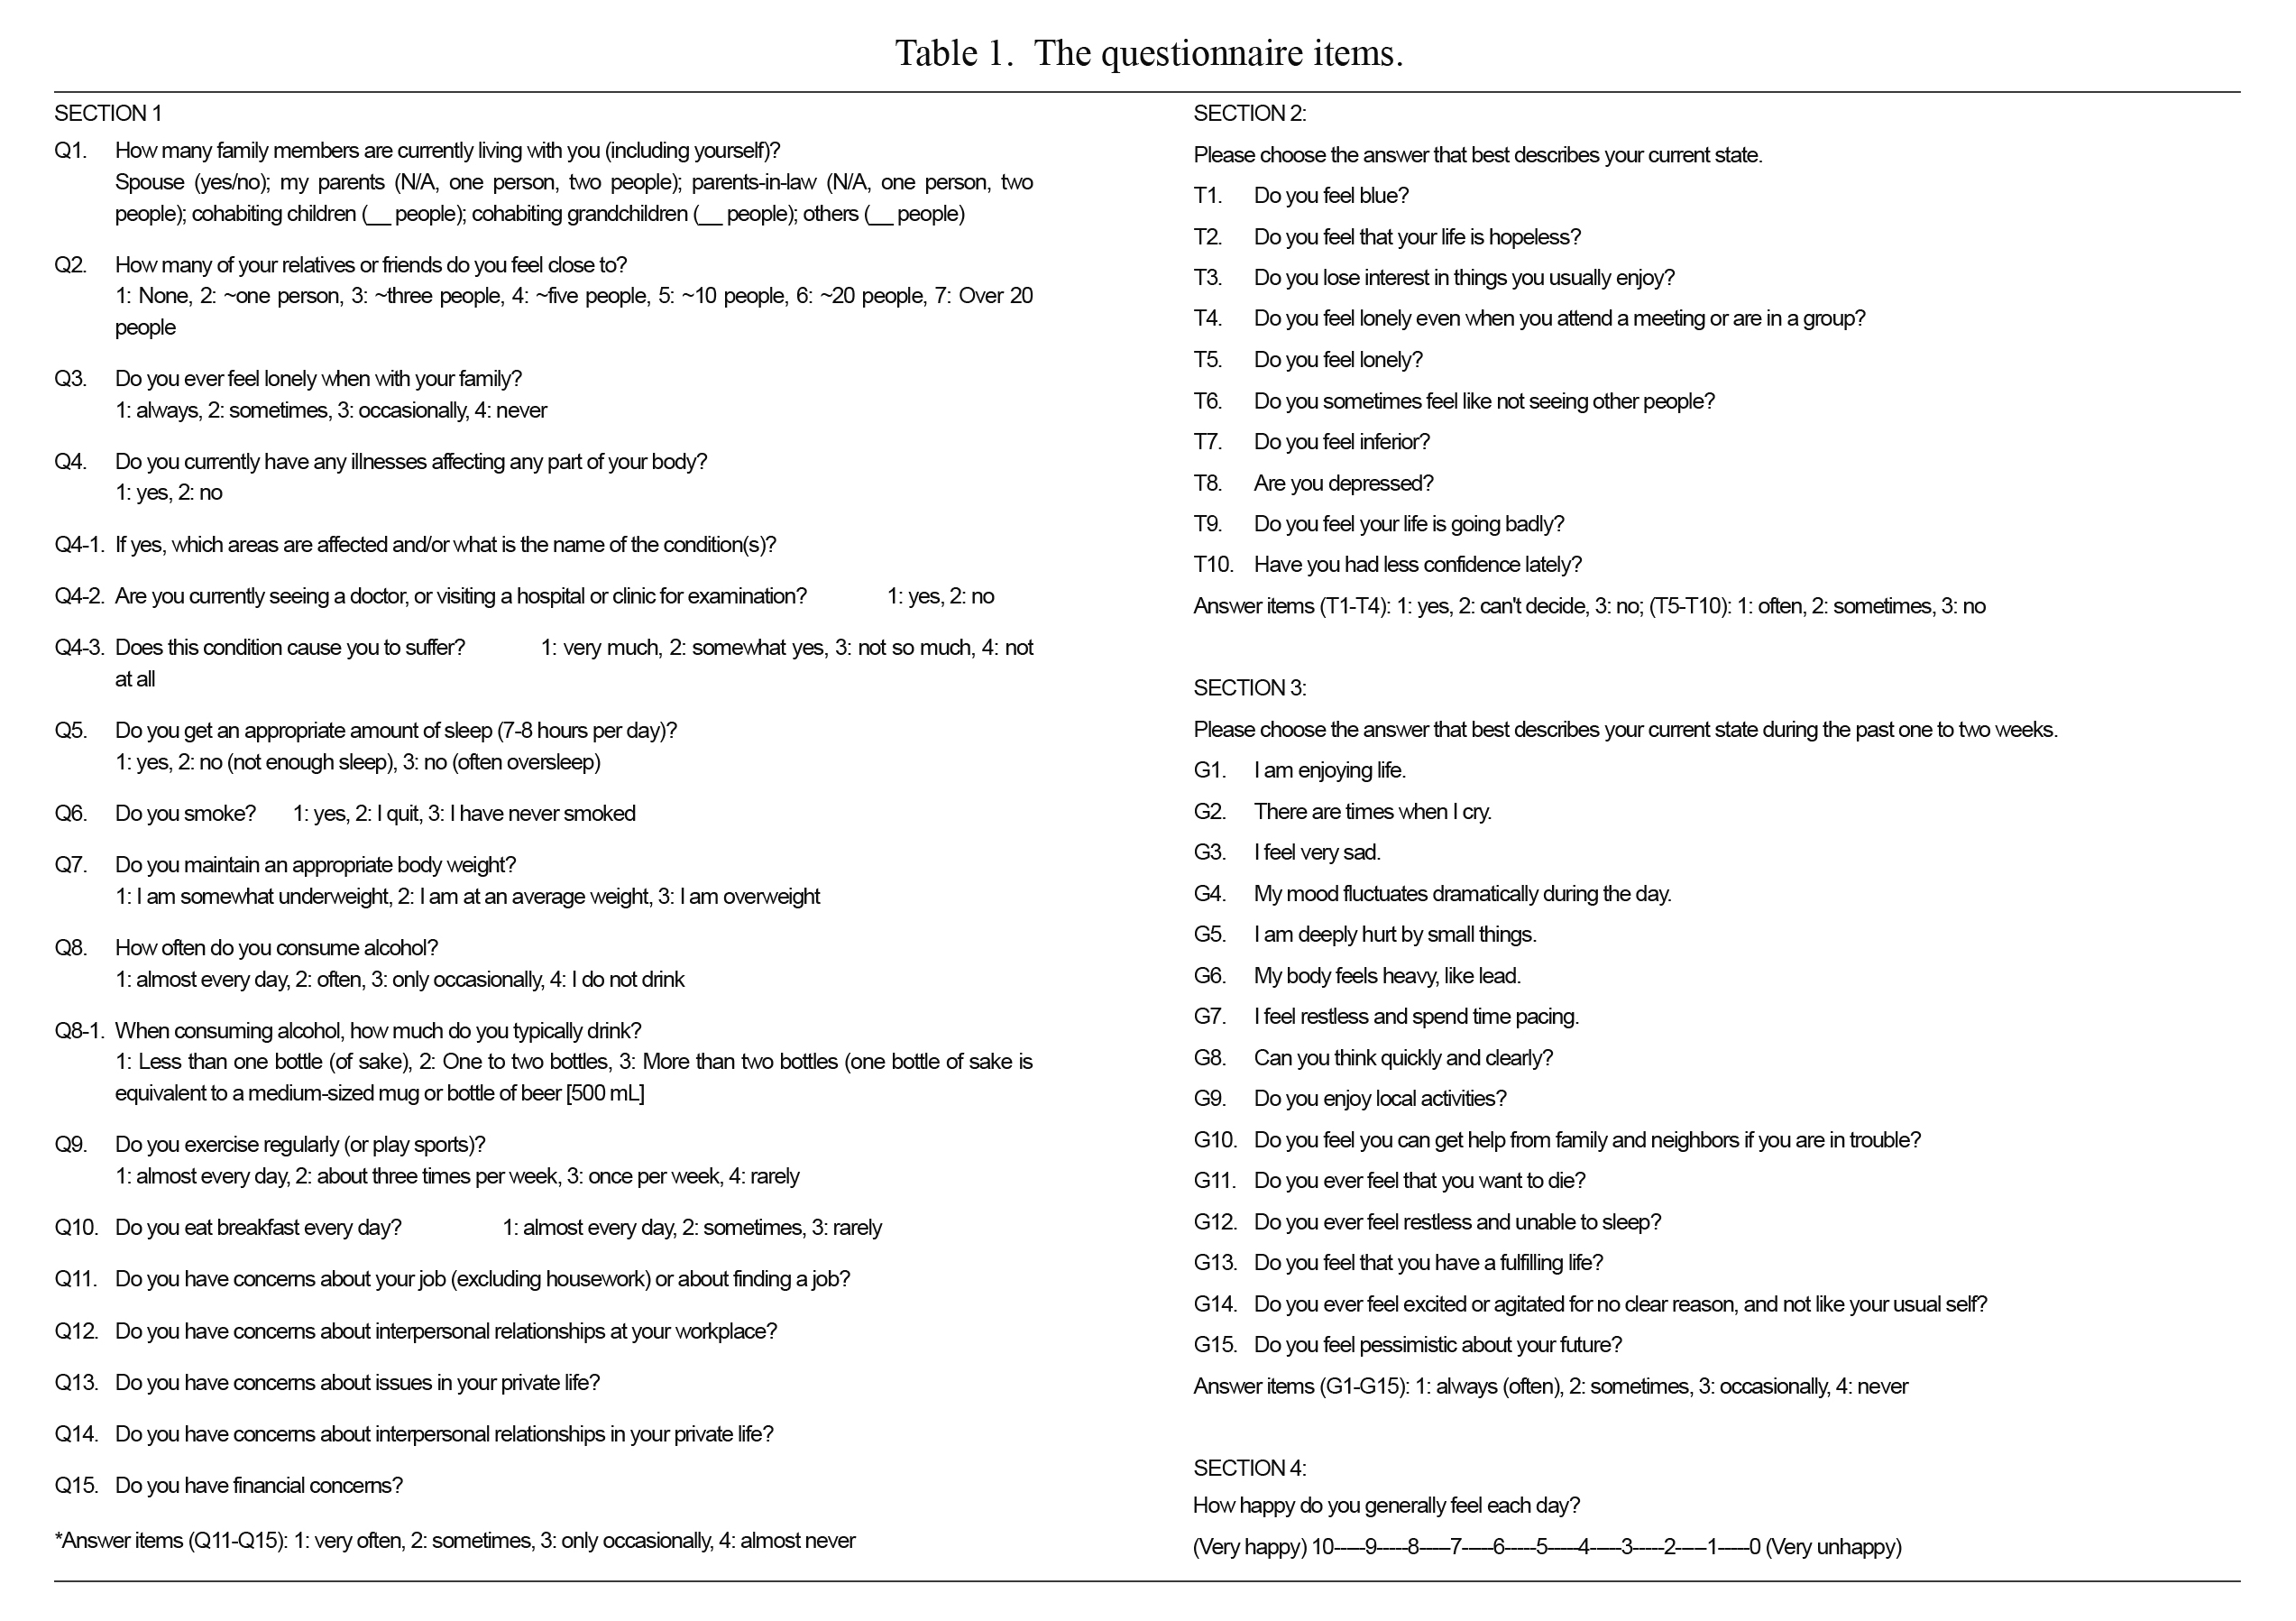
We used a questionnaire that we developed for application in suicide prevention measures. This is a self-administered questionnaire for the early detection of depressive state, and it examines various factors related to depressive states. It contains 41 items grouped into four sections; these items are displayed in Table 1. Section 1 consists of 15 lifestyle and social-economic related questions (Q1-Q15). Section 2 (T1-T10) is used to determine the presence of depressive state. We also used 10 depression-related question items from the Total Health Index-Depression (THI-D), which is widely used in health examinations in Japan (Aoki 1980). For these 10 items, positive answers are given 3 points, intermediate answers are 2 points, and negative answers are 1 point, with the total score being defined as the THI-D score. As in prior studies, missing values are awarded 2 points (Tanaka et al. 2011). The THI-D scores can thus range from 10 to 30 points, with higher scores indicating a more pronounced depressive state.
In accord with previous research (Kawada et al. 1999), we considered scores of ≥ 22 points (corresponding to the 97.5th percentile) to indicate a ‘depressive state.’ Incidentally, when we set 22 points as the cutoff value, the correct determination rate was 87.5%, with 91% sensitivity and 84% specificity. The THI-D is a subscale of the Total Health Index (THI), and the factor-related validity of the 130 THI items has been confirmed (Aoki 1980).
The eight items contained in Section 3 of the THI-D (G1-G15) are adapted from Zung’s Self-Rating Depression Scale (SDS) (Zung 1965), the Center for Epidemiologic Studies Depression Scale (CES-D) (Radloff 1977), and the DSM Scale for Depression (DSD) (Roberts et al. 1997). Section 3 (which demonstrated internal consistency as it had a Cronbach’s alpha of 0.77) was designed to serve as an aid for determining subjects’ depressive state subtypes at the time of their interview, and thus Section 3 was outside the present study’s scope and was not used for the analysis. The questionnaire used in this study has been repeatedly revised based on the results of other studies of companies and towns (Yamaguchi et al. 2009). Section 4 includes a question assessing subjective well-being.
Statistical analyses
The data obtained herein are expressed as mean values and standard deviations (SDs). Of the original 915 respondents, three were excluded because of response styles, leaving 912 respondents’ scores for analysis. Summary statistics were calculated with respect to the respondents’ lifestyle and social-economic characteristics and THI-D scores, which are indicators of a depressive state. There were 35 cases of data with missing values, which were awarded 2 points for the calculation of the THI-D score. The Wilcoxon rank-sum test was used to analyze differences between respondents. The ten questionnaire items designed to calculate THI-D scores (T1-T10) were also subjected to a correspondence analysis in order to clarify the internal structure of the recorded THI-D scores. By graphing the measurement results for items T1-T10 on the coordinate plane, it is possible to clarify the relationship between each symptom and the depressive state. Respondents’ answers were analyzed after being binarized into either ‘yes’ or ‘neither/no.’
We performed a logistic regression analysis to investigate the factors influencing THI-D scores. Questionnaire answer choices were rearranged during this analysis such that the more pronounced the depressive state, the higher the numerical value. As there was a small number of respondents who were assessed as being in a depressive state (i.e., a THI-D score of ≥ 22), we divided the target variable into two groups: the top ~20% of THI-D scores (≥ 16 points), and all other scores (< 16 points.) Respondents who had THI-D scores of ≥ 16 points comprised 16% of the total respondent population. The explanatory variables were Q1, Q2, and Q4-Q15, and we selected these explanatory variables by using the variable reduction method. Q3 concerned feelings of loneliness, and it was excluded because questions regarding feelings of loneliness were already included in the calculation of the THI-D score. We also excluded Q8-1 and Q14, because the correlation coefficients for the items “how often do you consume alcohol?” (Q8) and “when consuming alcohol, how much do you typically drink?” (Q8-1) and the items “do you have concerns about issues in your private life?” (Q13) and “do you have concerns about interpersonal relationships in your private life?” (Q14) were high at 0.90 and 0.69, respectively.
We utilized structural equation modeling (SEM) by applying the same model as that used in the 2007 survey (Murayama et al. 2012). This model was originally obtained through exploratory modeling based on the results of a factor analysis conducted to determine the relationship between the depressive state and lifestyle factors identified during a previous survey. In the present study’s multivariate analysis, for any unanswered items the mean value for the corresponding questionnaire item was inputted instead.
The software used for the statistical analyses was R (ver. 3.5.3). For the correspondence analysis, the MCA function included with the R FactoMineR (ver. 1.35) package was used. The level of significance for analytical results was set as p = 0.05.
Ethical considerations
Prior to administering this questionnaire, we obtained the verbal and written consent of all respondents concerning the use of their answers for this study. Personal information that could identify individuals was removed. This manuscript does not contain clinical studies or patient data. The execution and publication of this study was approved by the Institutional Review Board for Epidemiological Studies at Gunma University Graduate School of Medicine.
Results
Target population characteristics
Our survey received responses from 356 men and 50 2 women. The male respondents were aged 34-88 years (61.3 ± 12.8 mean ± standard deviation [SD]); these ages displayed a normal distribution. The female respondents were aged 22-98 years (59.8 ± 14.1); this age distribution displayed an almost symmetrical, unimodal pattern. The respondent population contained a higher proportion of elderly people compared to that of the greater Japanese population.
The distribution of THI-D scores was positively skewed (1.75); the median score was 11, and 27 respondents (3%) were assessed as being in a depressed state based on their THI-D scores. The distribution of subjective happiness ratings was negatively skewed (−0.34); the median value was 7, and 48 respondents (5.3%) submitted ratings of ≤ 4 points.
Table 2 summarizes the respondents’ other lifestyle and social-environmental characteristics. Notably, there were few respondents who lived alone, and the average number of family members cohabiting with the respondents was 3.4 (1.8).
Compared to the respondents who gave different answers, the average THI-D score was significantly higher for the respondents who reported getting insufficient sleep (p < 0.001, Q5), only occasionally or never consuming alcohol (p = 0.02, Q8), and rarely exercising or playing sports (p < 0.001, Q9). There was no significant difference in THI-D scores with respect to the respondents who answered various questionnaire items by stating that they lived alone (p = 0.14, Q1), smoked (p = 0.20, Q6), were at an average weight (p = 0.38, Q7), consumed alcohol ‘almost every day’ (p = 0.16, Q8), or ate breakfast ‘almost every day’ (p = 0.23, Q10) and the respondents who provided different answers.
The THI-D scores of the respondents who reported the following were significantly higher than those of the respondents who provided different answers to these items (all p < 0.001): ‘always’ or ‘sometimes’ feeling lonely when with their family (Q3), having concerns about interpersonal relationships at their jobs or in their private lives (Q11-14), and having financial concerns ‘very often’ or ‘sometimes’ (Q15). In particular, the respondents’ reports of feeling lonely when with family and to having concerns about their private lives were moderately positively correlated with higher THI-D scores (both p < 0.001). The average score of the respondents who lived alone with respect to ‘always’ or ‘sometimes’ feeling lonely when with their family (Q3) was significantly higher than that of the respondents who reported living with others.
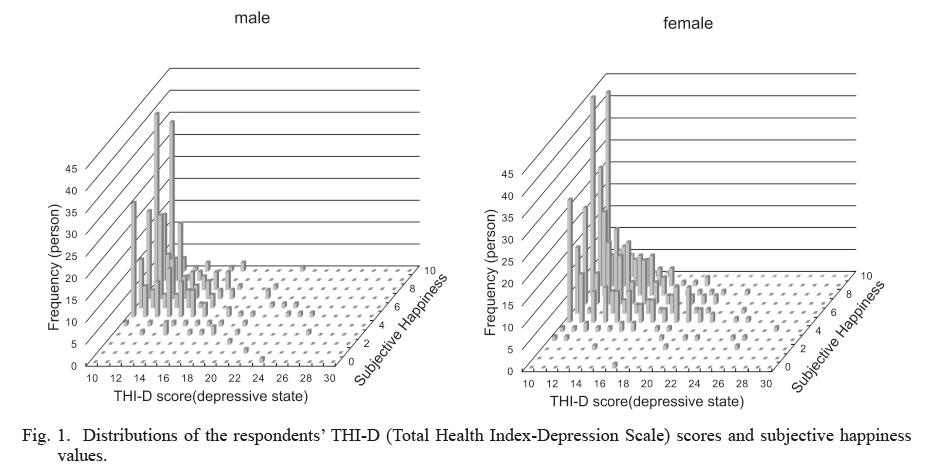
Fig. 1 displays the distribution of THI-D scores and the respondents’ subjective happiness values. The overall trend was that many of the respondents with high subjective happiness had a low THI-D score. As the number of respondents with high THI-D scores was small, the trend applicable to this range is unclear, but as the THI-D scores increased, the more likely it was for the subjective happiness values to decrease. However, the correlation coefficient between the THI-D scores and subjective happiness values was −0.39 (p < 0.001), and this was not indicative of a strong correlation. The subjective happiness of the respondents who had low THI-D scores and were not in a depressive state varied. For example, although the responses of having concerns about jobs and private life (Q11-14) and feeling lonely when with family (Q3) contributed to increased THI-D scores, these factors did not contribute significantly to reductions in the subjective happiness values.
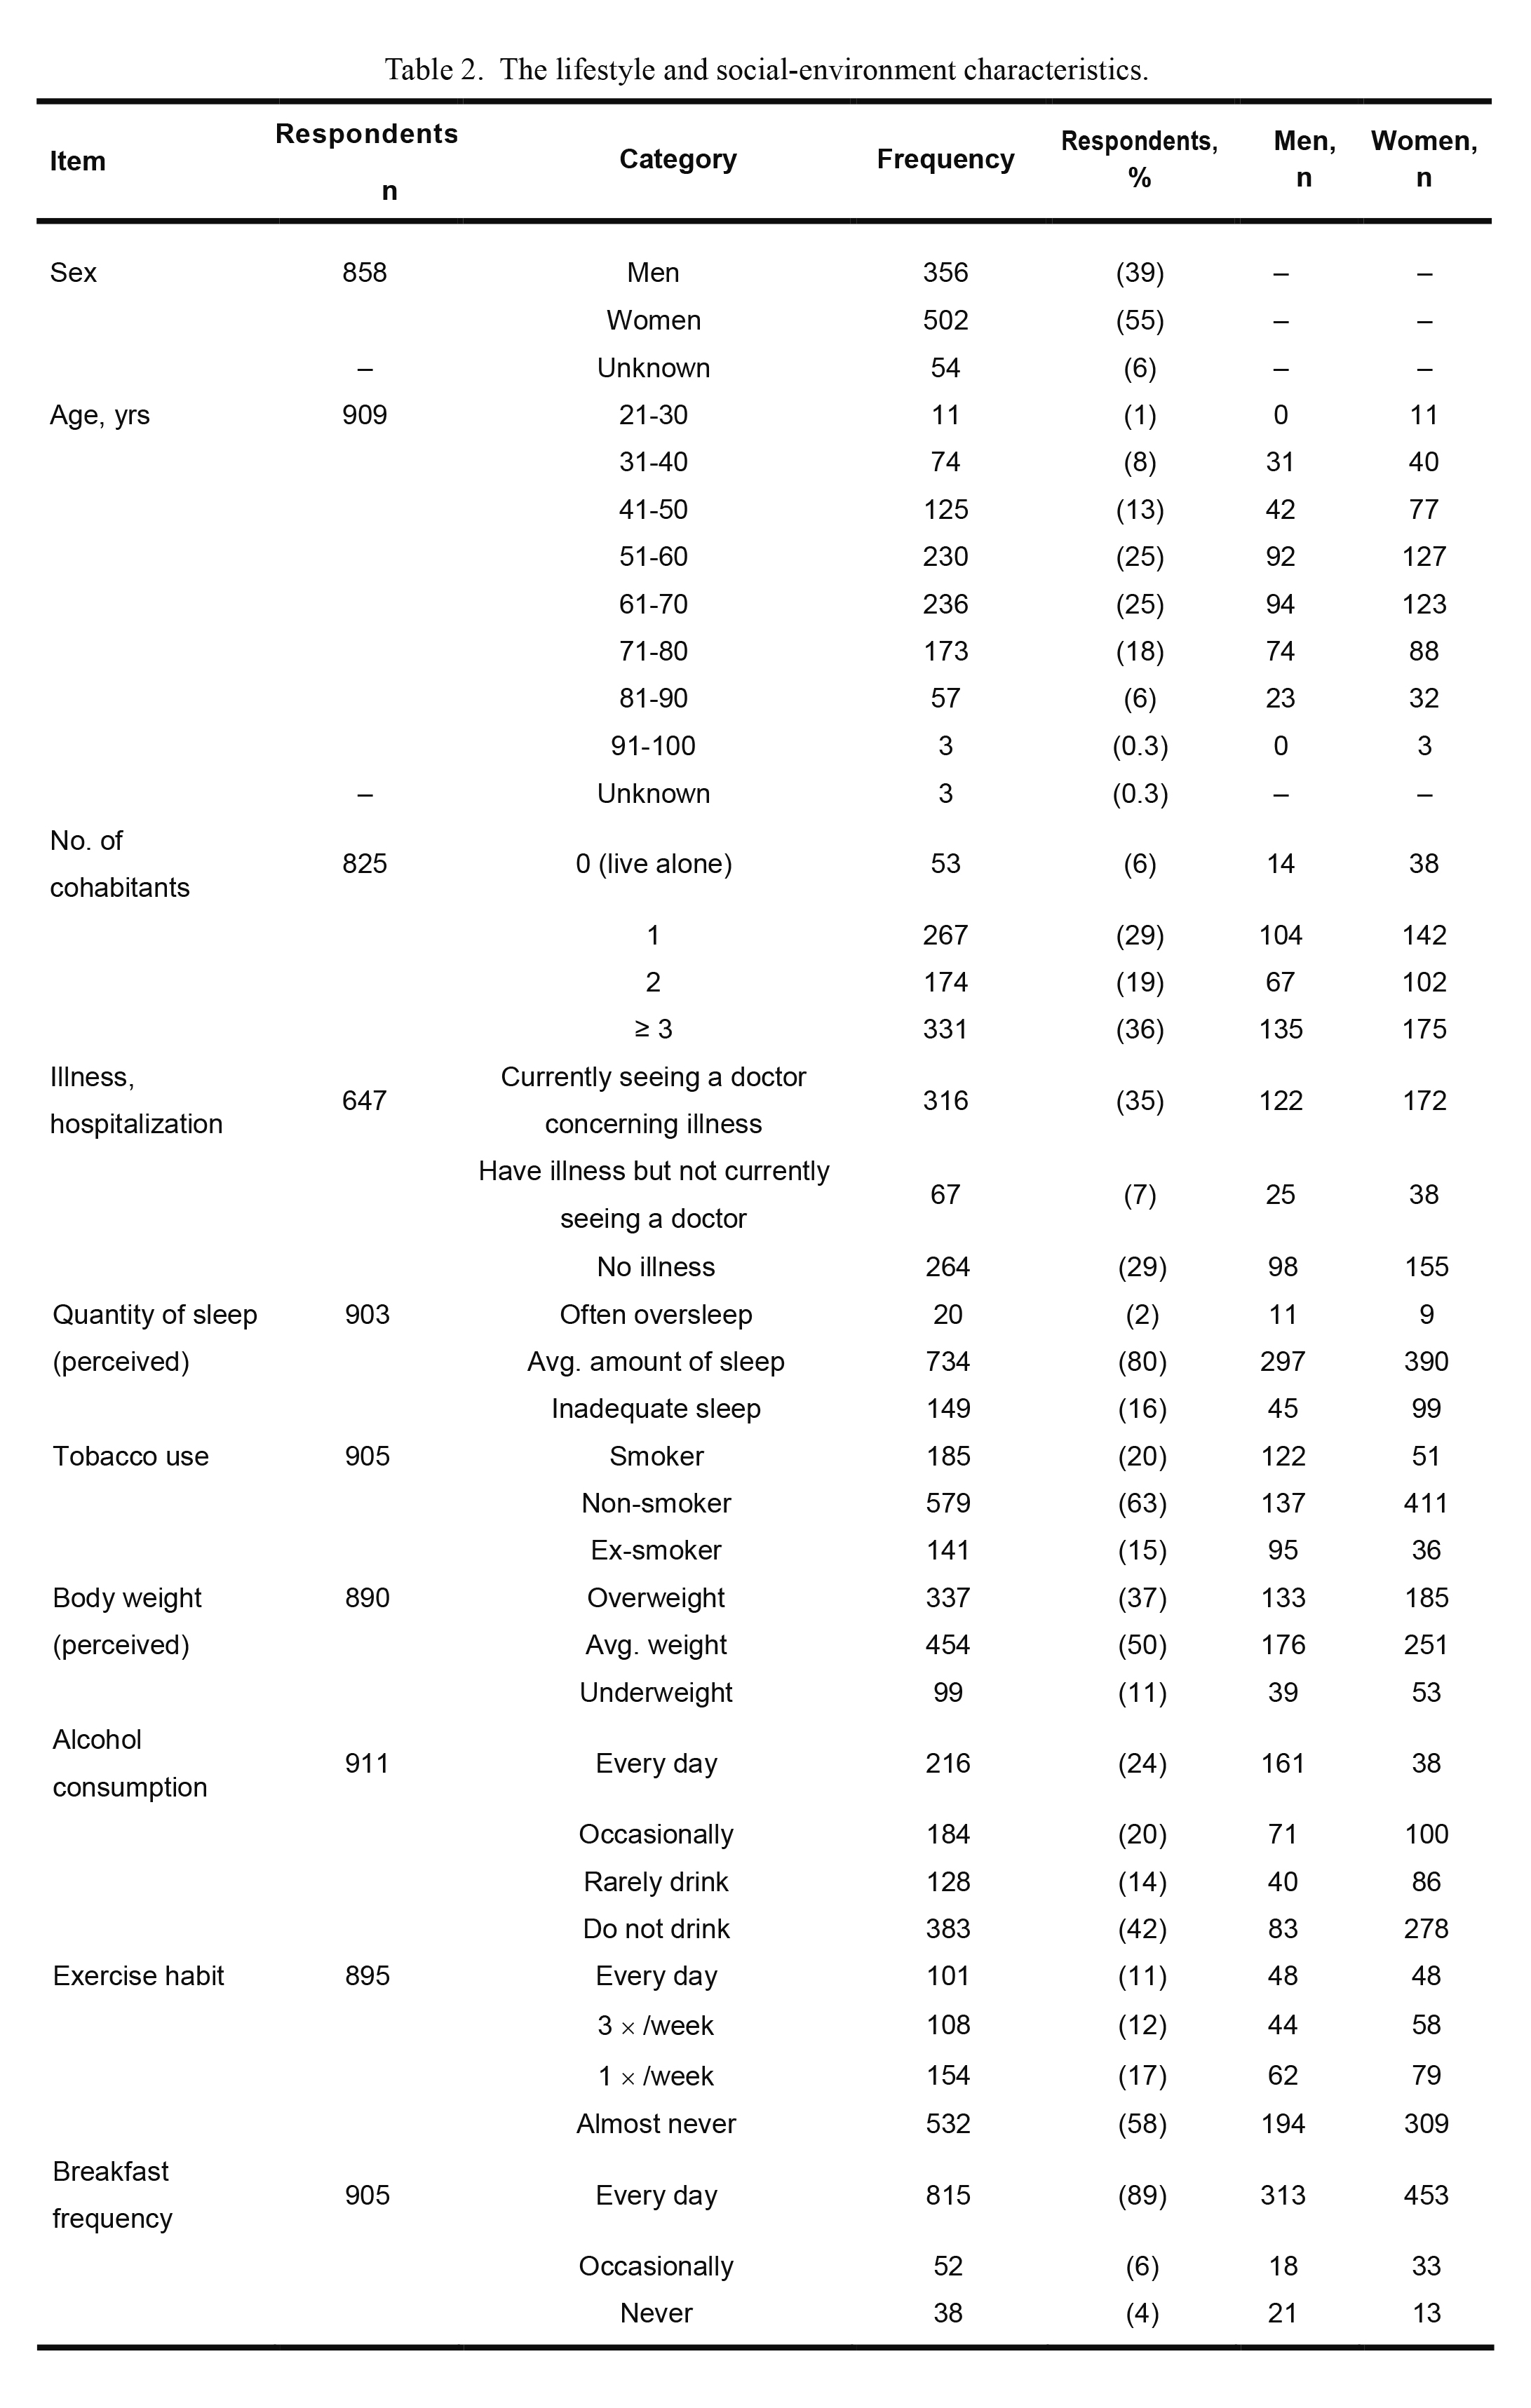
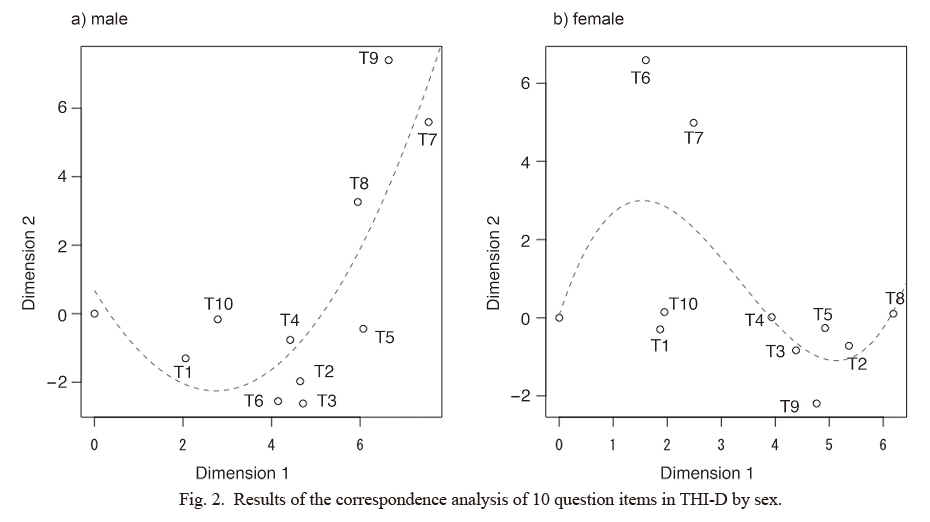
Fig. 2 provides the results of the correspondence analysis in two dimensions with respect to 10 questionnaire items (T1-T10) for each gender. For each item, answers of “no symptoms” were omitted because they were all plotted at the origin. The broken line shows an approximate curve. The plots indicate how close the items scores are to each other. When the data is linear in one dimension, the plot indicates a horseshoe shape. Each symptom of depression was arranged in a horseshoe pattern from the origin towards the upper right portion.
For the male respondents, the plot showed a horseshoe shape, indicating that the data were arranged in order. The plot was not in a horseshoe shape for the female respondents, suggesting that one dimension is insufficient to explain the data of the females. The contributions for men were 47.0% for dimension-1 and 14.6% for dimension-2, explaining 61.6% overall. The contributions for women were 35.1% for dimension-1 and 11.8% for dimension-2, explaining 46.9% overall.
Lack of self-confidence (T10) and lack of energy (T1) were the factors closest to the origin, while feeling depressed (T8) and feeling inferior (T7) were the farthest, and they also shared some points. However, the items closely related to feeling inferior (T7) differed by gender; for the men, it was “I feel my life is going badly” (T9) whereas for the women it was “I sometimes feel like not seeing other people” (T6).
The relationship between the THI-D score and multiple variables
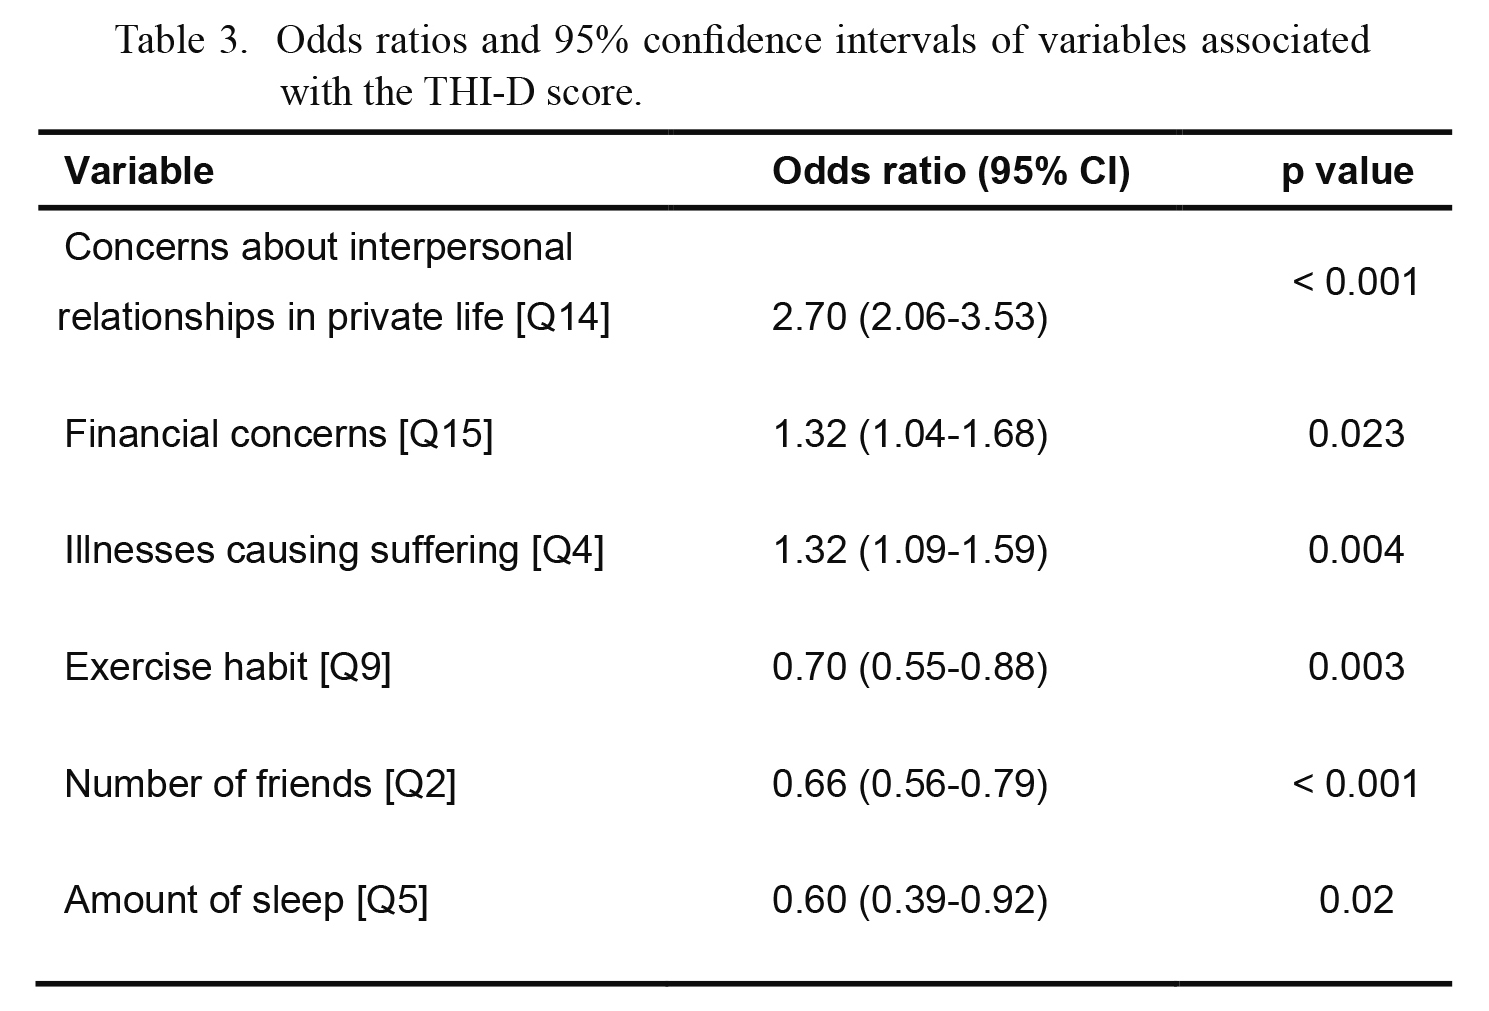
Concerns about interpersonal relationships in private life (Q14), financial concerns (Q15), illnesses causing suffering (Q4), exercise habits (Q9), number of friends (Q2), and perceived amount of sleep (Q5) were revealed as factors influencing THI-D score (binary values of ≥ 16 points). Table 3 demonstrates the respective odds ratios (ORs) for each factor. The C statistic (area under the receiver operating characteristic [ROC] curve) was 0.81. Thus, concerns about interpersonal relationships in private life (Q14) made the largest contribution to increasing the THI-D score, while having financial concerns (Q15), suffering from illness (Q4), infrequent exercise (Q9), having few friends (Q2), and having a perceived lack of sleep (Q5) also contributed to the increase in the THI-D score.
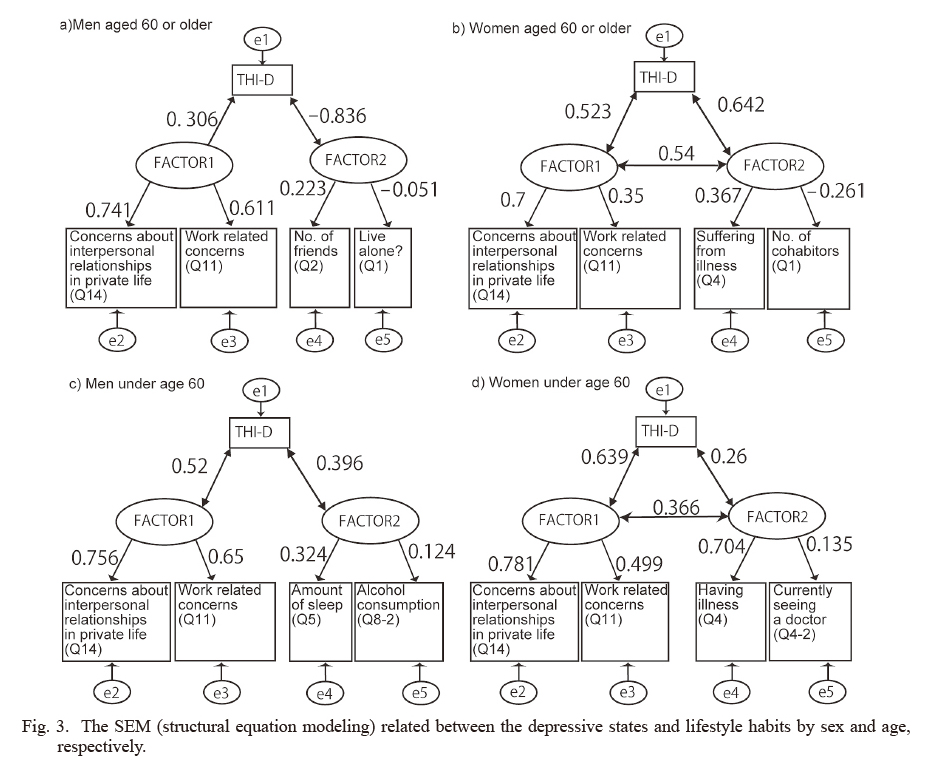
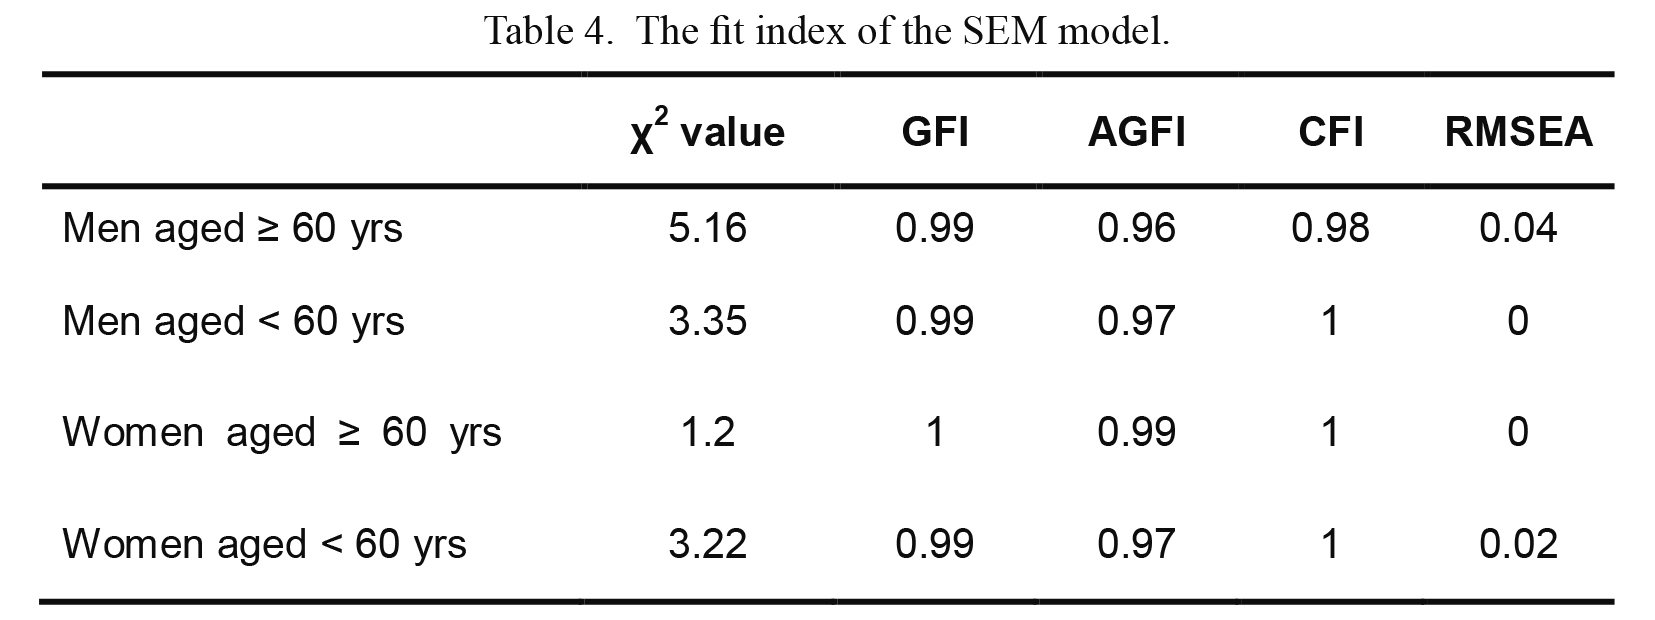
The SEM results and the degree of fit for the men and women aged < 60 years and ≥ 60 years are shown in Fig. 3 and Table 4. To verify whether the model we created in our 2007 survey can also sufficiently explain our present data, we analyzed the data obtained in 2012 using the same model. For the group of respondents aged ≥ 60 years, the degree of fit with this model was revealed to be favorable; for the respondents under 60 years old, a model with suitable goodness of fit was obtained by changing just one variable to an affinity item. For the younger male respondents, we revised the item concerning the frequency of alcohol consumption to focus on quantity instead, and for the younger female respondents, we changed the item “does this condition cause you to suffer?” to “do you feel ill?”
Based on the index value for the degree of fit, the 2007 model can be said to almost completely fit with the results of our 2012 survey. Employing Graetz’s three-factor model (Graetz 1991), we observed that Factor 1, which was common to all groups, corresponded to “social dysfunction,” which is identical to the result in our previous study. Factor 2 is thought to reflect the respondents’ health status and social capital.
Discussion
When comparing the 2007 survey (Murayama et al. 2012) and the present 2012 survey, it becomes evident that in both surveys concerns about one’s job and private life, particularly concerns about interpersonal relationships, are correlated with higher THI-D scores. Moreover, the 2012 SEM results were also almost identical to the 2007 findings, and we thus decided to continue to use this model to analyze applicable groups.
In the logistic regression analysis, concerns relating to interpersonal relationships, financial concerns, and health problems were all shown to raise the THI-D score, which is consistent with the recognized top motivations for suicide. When Japan’s economy went into a recession in ~2010, financial concerns became the main reason for suicide. Financial concerns are commonly related to employment problems, but rural mountainous areas generally have more individual business owners than company employees, and occupational healthcare staff have few opportunities to implement health and wellness programs or provide interventional support. Thus, to promote community health, employers and business owners in medically depopulated areas must consider both employees’ mental health and any available opportunities to deepen the owners and employees’ understanding of persons with disabilities. Simultaneously, setting up a consultation desk and working with a business association are considered effective measures for promoting employers’ own health. The general public should be provided with learning opportunities such as lectures and workshops by professionals. These activities help reduce prejudice around mental illness.
It should be noted that our inclusion of financial concerns in the logistic regression analysis results but not in the SEM results does not imply a structural difference; the questionnaire items related to financial aspects were not included in the 2007 survey and were therefore excluded from the SEM in the present study. Research conducted in Japan has revealed that mountainous areas have a high level of social capital intimacy (Yoshimura and Kitayama 2018) and that in large cities, neighbors are selective in their relationships (Harada and Sugisawa 2014). According to one survey, people support each other by mutual assistance (Furukawa and Tomokiyo 2003). In the target town in the present study, according to the public relations materials, many of the residents are blood relatives and have the same last name. In mountainous areas, interpersonal relationships may differ from those in urban areas in that they have a more direct impact on people’s lives.
Although symptoms such as anxiety, irritability, and psychotic episodes are considered to be severe in depressed individuals, the order of the manifestation of other symptoms of depression is currently unknown. Our correspondence analysis indicated that depression symptoms first manifest as a lack of self-confidence (T10) or a lack of energy (T1), with feeling inferior (T7) and feelings of depressed (T8) appearing last; thus, the respondents’ depression symptoms often developed over time or progressed from mild to severe in the above-described order.
The most widely used diagnostic criteria and scales in clinical practice for assessing the severity of depression are the DSM-5 (Diagnostic and Statistical Manual of Mental Disorders, 5th Edition) published by the American Psychiatric Association, the ICD-10 (International Classification of Diseases, Tenth Revision) published by the WHO, and the Hamilton Depression Rating Scale (Hamilton 1960), but these frameworks assess disease severity quantitatively, based on the degree and number of symptoms present. The results of our correspondence analysis show that depressive symptoms can be evaluated qualitatively. By focusing on self-confidence and lack of energy, early intervention becomes possible, and we believe that this knowledge can be used to plan community health and wellness programs.
There is also the possibility that urgent intervention may be necessary if symptoms of “feeling inferior” or “feeling depressed” appear, as these can be indicative of more serious depressive states. However, differences between the genders in this regard were revealed, such as the men’s responses to “I feel my life is going badly” and the women’s responses to “I sometimes feel like not seeing other people.” Beck (Salkovskis 1998) proposed the “helpless schema” and the “unlovable schema” as characteristic beliefs held by people in depressive states in regard to their perceptions of their abilities/goal achievement and their interpersonal relationships, respectively, and they also suggested that the region of interest can differ by gender. Consistent with Beck’s claims, our present findings also demonstrated the existence of gender differences concerning questions about one’s abilities and interpersonal relationships. When responding to these questions, it is possible that the degree of progress or severity of symptoms may differ by gender.
Other indicators that differed between our male and female respondents included items related to alcohol and tobacco consumption (Khan et al. 2013). According to the 2007 Japanese National Health and Nutrition Survey (National Institute of Health and Nutrition 2007), the rate of tobacco use was 39.4% among men and 11.0% among women, and 63.4% of the men and 92.1% of the women did not regularly consume alcohol. Similarly, in the target town in the present study, the men tended to regularly drink and smoke, while the women rarely did so. Initially, as it is known that alcohol consumption and depression are related (Pengpid et al. 2013), it seems illogical that answering “only occasionally” or “I do not drink” to Q8 would increase the THI-D score; however, in the target town the men exhibited common regional cultural characteristics such as frequently drinking with peers. The frequency of alcohol consumption is thought to be an indicator of affinity with the local community. This observation (i.e., that social identity can help relieve depressive states and maintain life satisfaction) is in agreement with previous findings (Smeekes et al. 2017). Other researchers have also reported that smoking affects depression and depression scores (Breslau et al. 1998; Benjet et al. 2004), but in our survey, there were no differences in THI-D score regardless of whether or not the respondents smoked.
In medically depopulated areas with many elderly people such as the present survey site, lack of transportation makes it difficult to go to a hospital. The following countermeasures should be considered: the new establishment of a small clinic, patrols by physicians and nurses, visits by local welfare commissioners, regular buses, and shared taxis to hospitals.
We originally expected that, for communities that have a lower awareness of mental illness and/or are hesitant to discuss it, items related to lifestyle and physical condition would be more easily discussed and could help inform intervention planning (Jorm et al. 2005; Nakane et al. 2005). However, the results of our present analyses revealed that it would be difficult to predict questionnaire respondents’ THI-D scores based on lifestyle aspects such as smoking habits, perceived fluctuations in body weight, and whether they ate breakfast. Nevertheless, other factors such as financial concerns, number of friends, exercise habit, illnesses, and perceived amount of sleep can serve as predictors of THI-D scores to some extent, and therefore these factors are potentially useful to consider during the planning of community health initiatives.
We attempted to formulate a regression equation similar to the equation for THI-D score but using subjective happiness as the objective variable, which would enable us to analyze subjective happiness. However, we were unable to explain subjective happiness based on the question items in this questionnaire (R2 = 0.179). Thus, to conduct further research into individuals’ quality of life in this area, it will first be necessary to reconsider the questionnaire items and conduct additional surveys.
Our study has some limitations. As not all members of the communities we targeted participated in the questionnaire, there is a possibility of selection bias. For example, some people may not have responded to the questionnaire due to negative attitudes toward mental illness. There was also the possibility that some individuals with weakened physical or mental conditions were unable to participate in medical examinations or the questionnaire.
Although it is possible to screen for “depressive state” using this questionnaire, it should also be noted that depression can occur in conjunction with other conditions. In cases of major depression, objective findings carry more weight than subjective symptoms, and medical staff should conduct patient interviews as necessary to support their patients’ diagnoses. Treatment policies should be developed based on evaluations of objective findings.
In conclusion, our analyses revealed that the concern about interpersonal relationships was the factor most relevant to a depressive state in the respondents’ lives, while financial concerns, number of friends, exercise habit, illnesses, and perceived amount of sleep were also useful for predicting a depressive state. An awareness of feeling inferior or depressed was a symptom that was suggestive of a more severe depressive state. Our findings will contribute to the advancement of qualitative assessments of depression and its symptoms.
Acknowledgments
We thank Ms. Machiko Hoshino for her assistance in the study’s execution.
Conflict of Interest
The authors declare no conflict of interest.
References
-
Aoki,
S.
(1980) Study on the validity of the health questionnaire, THI (II). The means of evaluation in the discriminative diagnosis of psychosomatic disease by THI. Nihon Eiseigaku Zasshi, 34, 766-776.
-
Audino,
P.,
La Grutta,
S.,
Cibella,
F.,
La Grutta,
S.,
Melis,
M.R.,
Bucchieri,
S.,
Alfano,
P.,
Marcantonio,
S. &
Cuttitta,
G.
(2014) Rhinitis as a risk factor for depressive mood in pre-adolescents: a new approach to this relationship. Pediatr. Allergy Immunol., 25, 360-365.
-
Baglioni,
C.,
Spiegelhalder,
K.,
Nissen,
C. &
Riemann,
D.
(2011) Clinical implications of the causal relationship between insomnia and depression: how individually tailored treatment of sleeping difficulties could prevent the onset of depression. EPMA J., 2, 287-293.
-
Benjet,
C.,
Wagner,
F.A.,
Borges,
G.G. &
Medina-Mora,
M.E.
(2004) The relationship of tobacco smoking with depressive symptomatology in the Third Mexican National Addictions Survey. Psychol. Med., 34, 881-888.
-
Breslau,
N.,
Peterson,
E.L.,
Schultz,
L.R.,
Chilcoat,
H.D. &
Andreski,
P.
(1998) Major depression and stages of smoking. A longitudinal investigation. Arch. Gen. Psychiatry, 55, 161-166.
-
Cabinet Office for Policy of Suicide Prevention and National Police Agency Community Safety Planning Division
(2013) Heisei 24 nen ni okeru Jisatsu no uchiwake (Suicide situation in 2012). National Police Agency. https://www.npa.go.jp/safetylife/seianki/jisatsu/H24/H24_jisatunojoukyou_02.pdf [Accessed: March 1, 2018] (in Japanese).
-
Costanza,
R.,
Fisher,
B.,
Ali,
S.,
Beer,
C.,
Bond,
L.,
Boumans,
R.,
Danigelis,
N.L.,
Dickinson,
J.,
Elliott,
C.,
Farley,
J.,
Gayer,
D.E.,
Glenn,
L.M.,
Hudspeth,
T.,
Mahoney,
D.,
McCahill,
L.,
et al. (2007) Quality of life: an approach integrating opportunities, human needs, and subjective well-being. Ecol. Econ., 61, 267-276.
-
Furukawa,
K. &
Tomokiyo,
T.
(2003) A study of the various associations supporting life of the old people in an aging and depopulated district/. J. Archit. Plan. (Transactions AIJ), 68, 77-84 (in Japanese).
-
Graetz,
B.
(1991) Multidimensional properties of the General Health Questionnaire. Soc. Psychiatry Psychiatr. Epidemiol., 26, 132-138.
-
Hamilton,
M.
(1960) A rating scale for depression. J. Neurol. Neurosurg. Psychiatry, 23, 56-62.
-
Harada,
K. &
Sugisawa,
H.
(2014) Urbanism and personal networks. Japanese Sociol. Rev., 65, 80-96 (in Japanese).
-
Ide,
M.
(2011) The association between depressive mood and pain amongst individuals with limb amputations. Eur. J. Trauma Emerg. Surg., 37, 191-195.
-
Jorm,
A.F.,
Nakane,
Y.,
Christensen,
H.,
Yoshioka,
K.,
Griffiths,
K.M. &
Wata,
Y.
(2005) Public beliefs about treatment and outcome of mental disorders: a comparison of Australia and Japan. BMC Med., 3, 12.
-
Kawada,
T.,
Suzuki,
S.,
Kubota,
F.,
Ohnishi,
N. &
Satoh,
K.
(1999) Content and cross validity of the Todai Health Index Depression Scale in relation to the Center for Epidemiologic Studies Depression Scale and the Zung Self-rating Depression Scale. J. Occup. Heal., 41, 154-159.
-
Khan,
S.,
Okuda,
M.,
Hasin,
D.S.,
Secades-Villa,
R.,
Keyes,
K.,
Lin,
K.H.,
Grant,
B. &
Blanco,
C.
(2013) Gender differences in lifetime alcohol dependence: results from the national epidemiologic survey on alcohol and related conditions. Alcohol. Clin. Exp. Res., 37, 1696-1705.
-
Kim,
J.,
Nakamura,
T.,
Kikuchi,
H.,
Sasaki,
T. &
Yamamoto,
Y.
(2013) Co-variation of depressive mood and locomotor dynamics evaluated by ecological momentary assessment in healthy humans. PLoS One, 8, e74979.
-
Lépine,
J.P. &
Briley,
M.
(2011) The increasing burden of depression. Neuropsychiatr. Dis. Treat., 7, 3-7.
-
Luppino,
F.S.,
de Wit,
L.M.,
Bouvy,
P.F.,
Stijnen,
T.,
Cuijpers,
P.,
Penninx,
B.W. &
Zitman,
F.G.
(2010) Overweight, obesity, and depression: a systematic review and meta-analysis of longitudinal studies. Arch. Gen. Psychiatry, 67, 220-229.
-
Mall,
S.,
Lund,
C.,
Vilagut,
G.,
Alonso,
J.,
Williams,
D.R. &
Stein,
D.J.
(2015) Days out of role due to mental and physical illness in the South African stress and health study. Soc. Psychiatry Psychiatr. Epidemiol., 50, 461-468.
-
Matthews,
T.,
Danese,
A.,
Wertz,
J.,
Odgers,
C.L.,
Ambler,
A.,
Moffitt,
T.E. &
Arseneault,
L.
(2016) Social isolation, loneliness and depression in young adulthood: a behavioural genetic analysis. Soc. Psychiatry Psychiatr. Epidemiol., 51, 339-348.
-
Ministry of Health, Labour and Welfare
(2016) Jisatsu taisaku hakusyo (White paper on suicide prevention in Japan). https://www.mhlw.go.jp/wp/hakusyo/jisatsu/16/ [Accessed: March 1, 2018] (in Japanese).
-
Motohashi,
Y.,
Kaneko,
Y. &
Fujita,
K.
(2017) The present trend of suicide prevention policy in Japan. Suicide Policy Research, 1, 1-7.
-
Murayama,
Y.,
Yamamoto,
R.,
Yamaguchi,
M.,
Yamazaki,
C.,
Nakazawa,
M. &
Koyama,
H.
(2012) Relationship between depressive state and lifestyle factors in a rural area in Gunma Prefecture: an analysis of ‘Kokoro Check Sheet’ using structural equation modeling. Kitakanto Med. J., 62, 41-51 (in Japanese, English abstract).
-
Nakane,
Y.,
Jorm,
A.F.,
Yoshioka,
K.,
Christensen,
H.,
Nakane,
H. &
Griffiths,
K.M.
(2005) Public beliefs about causes and risk factors for mental disorders: a comparison of Japan and Australia. BMC Psychiatry, 5, 33.
-
National Institute of Health and Nutrition
(2007) Outline for the results of the national health and nutrition survey, Japan. https://www.mhlw.go.jp/bunya/kenkou/eiyou09/dl/01-04.pdf [Accessed: March 1, 2018] (in Japanese).
-
Niedzwiedz,
C.L.,
Mitchell,
R.J.,
Shortt,
N.K. &
Pearce,
J.R.
(2016) Social protection spending and inequalities in depressive symptoms across Europe. Soc. Psychiatry Psychiatr. Epidemiol., 51, 1005-1014.
-
Pengpid,
S.,
Peltzer,
K.,
van der Heever,
H. &
Skaal,
L.
(2013) Screening and brief interventions for hazardous and harmful alcohol use among university students in South Africa: results from a randomized controlled trial. Int. J. Environ. Res. Public Health, 10, 2043-2057.
-
Radloff,
L.S.
(1977) The CES-D scale: a self-report depression scale for research in hte general population. Appl. Psychol. Meas., 1, 385-401.
-
Roberts,
R.E.,
Roberts,
C.R. &
Chen,
Y.R.
(1997) Ethnocultural differences in prevalence of adolescent depression. Am. J. Community Psychol., 25, 95-110.
-
Sakamoto,
S.,
Tanaka,
E.,
Neichi,
K. &
Ono,
Y.
(2004) Where is help sought for depression or suicidal ideation in an elderly population living in a rural area of Japan? Psychiatry Clin. Neurosci., 58, 522-530.
-
Salkovskis, P.M. (1998) Frontiers of cognitive therapy, Guilford, New York.
-
Sapranaviciute-Zabazlajeva,
L.,
Reklaitiene,
R.,
Tamosiunas,
A.,
Baceviciene,
M.,
Virviciute,
D. &
Peasey,
A.
(2014) Correlates of depressive symptoms in urban middle-aged and elderly Lithuanians. Soc. Psychiatry Psychiatr. Epidemiol., 49, 1199-1207.
-
Shidhaye,
R.,
Gangale,
S. &
Patel,
V.
(2016) Prevalence and treatment coverage for depression: a population-based survey in Vidarbha, India. Soc. Psychiatry Psychiatr. Epidemiol., 51, 993-1003.
-
Smeekes,
A.,
Verkuyten,
M.,
Celebi,
E.,
Acarturk,
C. &
Onkun,
S.
(2017) Social identity continuity and mental health among Syrian refugees in Turkey. Soc. Psychiatry Psychiatr. Epidemiol., 52, 1317-1324.
-
St. John,
P.D.,
Blandford,
A.A. &
Strain,
L.A.
(2006) Depressive symptoms among older adults in urban and rural areas. Int. J. Geriatr. Psychiatry, 21, 1175-1180.
-
Steptoe,
A.,
Deaton,
A. &
Stone,
A.A.
(2015) Subjective wellbeing, health, and ageing. Lancet, 385, 640-648.
-
Tanaka,
H.,
Sasazawa,
Y.,
Suzuki,
S.,
Nakazawa,
M. &
Koyama,
H.
(2011) Health status and lifestyle factors as predictors of depression in middle-aged and elderly Japanese adults: a seven-year follow-up of the Komo-Ise cohort study. BMC Psychiatry, 11, 20.
-
Taspinar,
B.,
Gursoy,
S.,
Baser,
S.,
Evyapan,
F. &
Taspinar,
F.
(2010) Comparison of pulmonary function, physical function, quality of life, depressive symptoms and cognitive abilities between patients with chronic obstructive pulmonary disease and healthy subjects. J. Med. Sci., 10, 71-79.
-
Umubyeyi,
A.,
Mogren,
I.,
Ntaganira,
J. &
Krantz,
G.
(2016) Help-seeking behaviours, barriers to care and self-efficacy for seeking mental health care: a population-based study in Rwanda. Soc. Psychiatry Psychiatr. Epidemiol., 51, 81-92.
-
Webel,
A.R.,
Sattar,
A.,
Schreiner,
N.,
Kinley,
B.,
Moore,
S.M. &
Salata,
R.A.
(2016) The impact of mental wellness on HIV self-management. J. Assoc. Nurses AIDS Care, 27, 468-475.
-
Yamaguchi,
M.,
Murayama,
Y.,
Onda,
R.,
Mitsuhashi,
M.,
Yamazaki,
C.,
Nakazawa,
M. &
Koyama,
H.
(2009) Factor analysis of the Kokoro Check Sheet (KCS). Kitakanto Med. J., 59, 231-240 (in Japanese).
-
Yokoyama,
E.,
Kaneita,
Y.,
Saito,
Y.,
Uchiyama,
M.,
Matsuzaki,
Y.,
Tamaki,
T.,
Munezawa,
T. &
Ohida,
T.
(2010) Association between depression and insomnia subtypes: a longitudinal study on the elderly in Japan. Sleep, 33, 1693-1702.
-
Yoshimura,
T. &
Kitayama,
A.
(2018) Social capital in mountainous regions. J. Japanese Assoc. Rural Med., 66, 548-561 (in Japanese).
-
Zung,
W.W.
(1965) A Self-Rating Depression Scale. Arch. Gen. Psychiatry, 12, 63-70.